10-K: Annual report [Section 13 and 15(d), not S-K Item 405]
Published on February 26, 2025
UNITED STATES
SECURITIES AND EXCHANGE COMMISSION
Washington, D.C. 20549
FORM
(Mark One) |
|
ANNUAL REPORT PURSUANT TO SECTION 13 OR 15(d) OF THE SECURITIES EXCHANGE ACT OF 1934 |
|
For the fiscal year ended | |
OR | |
TRANSITION REPORT PURSUANT TO SECTION 13 OR 15(d) OF THE SECURITIES EXCHANGE ACT OF 1934 |
|
For the transition period from to | |
Commission file number
(Exact name of registrant as specified in its charter)
|
|
|
|
(
Registrant’s telephone number, including area code:
Securities registered pursuant to Section 12(b) of the Act:
Title of each class |
Trading Symbol |
Name of each exchange on which registered |
||
Securities registered pursuant to Section 12(g) of the Act: None.
Indicate by check mark if the registrant is a well-known seasoned issuer, as defined in Rule 405 of the Securities Act.
Indicate by check mark if the registrant is not required to file reports pursuant to Section 13 or Section 15(d) of the Act. Yes ☐
Indicate by check mark whether the registrant (1) has filed all reports required to be filed by Section 13 or 15(d) of the Securities Exchange Act of 1934 during the preceding 12 months (or for such shorter period that the registrant was required to file such reports), and (2) has been subject to such filing requirements for the past 90 days.
Indicate by check mark whether the registrant has submitted electronically every Interactive Data File required to be submitted pursuant to Rule 405 of Regulations S-T (§232.405 of this chapter) during the preceding 12 months (or for such shorter period that the registrant was required to submit such files).
Indicate by check mark whether the registrant is a large accelerated filer, an accelerated filer, a non-accelerated filer, a smaller reporting company, or an emerging growth company. See definitions of “large accelerated filer,” “accelerated filer,” “smaller reporting company,” and emerging growth company in Rule 12b-2 of the Exchange Act.
Accelerated filer ☐ |
Non-accelerated filer ☐ |
|
Smaller reporting company |
Emerging Growth Company |
If an emerging growth company, indicate by check mark if the registrant has elected not to use the extended transition period for complying with any new or revised financial accounting standards provided pursuant to Section 13(a) of the Exchange Act. ◻
Indicate by check mark whether the registrant has filed a report on and attestation to its management’s assessment of the effectiveness of its internal control over financial reporting under Section 404(b) of the Sarbanes-Oxley Act (15 U.S.C. 7262 (b)) by the registered public accounting firm that prepared or issued its audit report.
If securities are registered pursuant to Section 12(b) of the Act, indicate by check mark whether the financial statements of the registrant included in the filing the correction of an error to previously issued financial statements.
Indicate by check mark whether any of those error corrections are restatements that required a recovery analysis of incentive-based compensation received by any of the registrant’s executive officers during the relevant recovery period pursuant to§240.10D-1(b). ◻
Indicate by check mark whether the registrant is a shell company (as defined in Rule 12b-2 of the Act). Yes
The aggregate market value of the voting and non-voting common equity held by non-affiliates of the registrant on June 30, 2024, computed by reference to the price at which the registrant’s Class A common stock was last sold on the New York Stock Exchange on such date was $
Shares of Class A common stock outstanding—
DOCUMENTS INCORPORATED BY REFERENCE
Certain portions of the registrant’s definitive proxy statement, in connection with its 2024 annual meeting of stockholders, to be filed within 120 days of December 31, 2024, are incorporated by reference into Part III of this Annual Report on Form 10-K.
AMC ENTERTAINMENT HOLDINGS, INC.
FORM 10-K
FOR THE YEAR ENDED DECEMBER 31, 2024
INDEX
1
Forward-Looking Statements
In addition to historical information, this Annual Report on Form 10-K contains “forward-looking statements” within the meaning of the “safe harbor” provisions of the United States Private Securities Litigation Reform Act of 1995. Forward-looking statements may be identified by the use of words such as “may,” “will,” “forecast,” “estimate,” “project,” “intend,” “plan,” “expect,” “should,” “believe” and other similar expressions that predict or indicate future events or trends or that are not statements of historical matters. These forward-looking statements are based only on our current beliefs, expectations and assumptions regarding the future of our business, future plans and strategies, projections, anticipated events and trends, the economy and other future conditions and speak only as of the date on which it is made. Examples of forward-looking statements include statements we make regarding future attendance levels, revenues and our liquidity. These forward-looking statements involve known and unknown risks, uncertainties, assumptions and other factors, including those discussed in “Risk Factors” and “Management’s Discussion and Analysis of Financial Condition and Results of Operations,” which may cause our actual results, performance or achievements to be materially different from any future results, performance or achievements expressed or implied by such forward-looking statements. These risks and uncertainties include, but are not limited to, the following:
| ● | the risks and uncertainties relating to the sufficiency of our existing cash and cash equivalents and available borrowing capacity, including following the termination of our senior secured revolving credit facility (“Senior Secured Revolving Credit Facility”), to fund operations, and satisfy obligations including cash outflows for planned capital expenditures currently and through the next twelve months. In order to achieve net positive cash flows provided by operating activities revenues will need to increase from current levels to levels at least in line with pre-COVID-19 revenues. However, there remain significant risks that may negatively impact revenues and attendance levels, including changes to movie studios release schedules (including as a result of production delays and delays to the release of movies caused by labor stoppages) and direct to streaming or other changing movie studio practices. If we are unable to achieve increased levels of attendance and revenues, we will be required to obtain additional liquidity. If such additional liquidity is not obtained or is insufficient, we likely would seek an in-court or out-of-court restructuring of our liabilities, and in the event of such future liquidation or bankruptcy proceeding, holders of our Class A common stock (“Common Stock”) and other securities would likely suffer a total loss of their investment; |
| ● | the risks and uncertainties relating to the Refinancing Transactions (as defined below), including, but not limited to, (i) the potential for additional future dilution of our Common Stock as a result of issuance of shares underlying our 6.00%/8.00% Cash/PIK Toggle Senior Secured Exchangeable Notes (the “Exchangeable Notes”), (ii) the possibility that the extension of certain debt maturities will not provide enough time for attendance and revenues to increase to sufficient levels and generate net positive cash flows from operating activities and long-term profitability to overcome liquidity concerns or may be insufficient to do so if the Company does not achieve revenue levels at least in line with pre-COVID-19 revenues and (iii) the impact on the market price of our Common Stock and our capital structure of litigation resulting from the Refinancing Transactions or the claims of default or any additional litigation that has arisen or may arise in connection with the Refinancing Transactions, including the Noteholder Action (as defined herein). See Note 11—Commitments and Contingencies in the Notes to the Consolidated Financial Statements under Part II, Item 8 of this Form 10-K, for a description of the litigation; |
| ● | changing practices of distributors, which accelerated during the COVID-19 pandemic, including increased use of alternative film delivery methods including premium video on demand, streaming platforms, shrinking exclusive theatrical release windows or release of movies to theatrical exhibition and streaming platforms on the same date, the theatrical release of fewer movies, or transitioning to other forms of entertainment; |
| ● | the impact of changing movie-going behavior of consumers; |
| ● | the risk that the North American and international box office in the near term will not recover sufficiently, resulting in higher cash burn and the need to seek additional financing, which may not be available at favorable terms, or at all; |
2
| ● | risks and uncertainties relating to our significant indebtedness, including our borrowings and our ability to meet our debt covenants; |
| ● | the dilution caused by recent and potential future sales of our Common Stock and future potential share issuances to repay, refinance, redeem or repurchase indebtedness (including expenses, accrued interest and premium, if any); |
| ● | risks relating to motion picture production, promotion, marketing, and performance, including labor stoppages affecting the production, supply and release schedule of theatrical motion picture content; |
| ● | the seasonality of our revenue and working capital, which are dependent upon the timing of motion picture releases by distributors, such releases being seasonal and resulting in higher attendance and revenues generally during the summer months and holiday seasons, and higher working capital requirements during the other periods such as the first quarter; |
| ● | intense competition in the geographic areas in which we operate among exhibitors, streaming platforms, or from other forms of entertainment; |
| ● | certain covenants in the agreements that govern our indebtedness that limit or restrict our ability to take advantage of certain business opportunities, pay dividends, incur additional debt, pre-pay debt, and also to refinance debt and to do so at favorable terms, and such covenants that impose additional administrative and operational burdens on our business; |
| ● | risks relating to impairment losses, including with respect to goodwill and other intangibles, and theatre and other closure charges; |
| ● | general and international economic, political, regulatory, social and financial market conditions, including potential economic recession, inflation, rising interest rates, the financial stability of the banking industry, and other risks that may negatively impact discretionary income and our revenues and attendance levels; |
| ● | our lack of control over distributors of films; |
| ● | limitations on the availability of capital or poor financial results may prevent us from deploying strategic initiatives; |
| ● | an issuance of preferred stock could dilute the voting power of the common stockholders and adversely affect the market value of our outstanding Common Stock; |
| ● | limitations on the authorized number of Common Stock shares could in the future prevent us from raising additional capital through Common Stock; |
| ● | our ability to achieve expected synergies, benefits and performance from our strategic initiatives; |
| ● | our ability to refinance our indebtedness on terms favorable to us or at all; |
| ● | our ability to optimize our theatre circuit through new construction, the transformation of our existing theatres, and strategically closing underperforming theatres may be subject to delay and unanticipated costs; |
| ● | failures, unavailability or security breaches of our information systems, including due to cybersecurity incidents; |
| ● | our ability to utilize interest expense deductions will be limited annually due to Section 163(j) of the Internal Revenue Code of 1986, as amended (the “Code”), as amended by the Tax Cuts and Jobs Act of 2017; |
3
| ● | our ability to recognize interest deduction carryforwards, net operating loss carryforwards, and other tax attributes to reduce our future tax liability; |
| ● | our ability to recognize certain international deferred tax assets which currently do not have a valuation allowance recorded; |
| ● | review by antitrust authorities in connection with acquisition opportunities; |
| ● | risks relating to the incurrence of legal liability, including costs associated with the ongoing securities class action lawsuits; |
| ● | dependence on key personnel for current and future performance and our ability to attract and retain senior executives and other key personnel, including in connection with any future acquisitions; |
| ● | increased costs in order to comply or resulting from a failure to comply with governmental regulation, including the General Data Protection Regulation (“GDPR”) and all other current and pending privacy and data regulations in the jurisdictions where we have operations; |
| ● | supply chain disruptions may negatively impact our operating results; |
| ● | the availability and/or cost of energy, particularly in Europe; |
| ● | the market price and trading volume of our shares of Common Stock has been and may continue to be volatile, and purchasers of our securities could incur substantial losses; |
| ● | future offerings of debt, which would be senior to our Common Stock for purposes of distributions or upon liquidation, could adversely affect the market price of our Common Stock; |
| ● | the potential for political, social, or economic unrest, terrorism, hostilities, cyber-attacks or war, including the conflict between Russia and Ukraine and other international conflicts; |
| ● | the potential impact of financial and economic sanctions on the regional and global economy, or widespread health emergencies, such as pandemics or epidemics, causing people to avoid our theatres or other public places where large crowds are in attendance; |
| ● | anti-takeover protections in our Third Amended and Restated Certificate of Incorporation (the “Certificate of Incorporation”) and our amended and restated bylaws (the “Bylaws”) may discourage or prevent a takeover of our Company, even if an acquisition would be beneficial to our stockholders; and |
| ● | other risks and uncertainties referenced from time to time in filings with the SEC. |
This list of factors that may affect future performance and the accuracy of forward-looking statements is illustrative but not exhaustive. In addition, new risks and uncertainties may arise from time to time. Accordingly, all forward-looking statements should be evaluated with an understanding of their inherent uncertainty and we caution accordingly against relying on forward-looking statements.
Except as required by law, we assume no obligation to publicly update or revise these forward-looking statements for any reason. Actual results could differ materially from those anticipated in these forward-looking statements, even if new information becomes available in the future.
Readers are urged to consider these factors carefully in evaluating the forward-looking statements. For further information about these and other risks and uncertainties as well as strategic initiatives, see Item 1. “Business” and Item 1A. “Risk Factors” in this Annual Report on Form 10-K.
All subsequent written and oral forward-looking statements attributable to us or persons acting on our behalf are expressly qualified in their entirety by these cautionary statements. The forward-looking statements included herein are made only as of the date of this Annual Report on Form 10-K, and we do not undertake any obligation to release
4
publicly any revisions to such forward-looking statements to reflect events or circumstances after the date hereof or to reflect the occurrence of unanticipated events.
PART I
Item 1. Business.
General Development of Business
AMC Entertainment Holdings, Inc. (“Holdings”), through its direct and indirect subsidiaries, including American Multi-Cinema, Inc. and its subsidiaries, (collectively with Holdings, unless the context otherwise requires, the “Company” or “AMC”), is principally involved in the theatrical exhibition business and owns, operates or has interests in theatres primarily located in the United States and Europe.
Our business was founded in Kansas City, Missouri in 1920. Holdings was incorporated under the laws of the state of Delaware on June 6, 2007. We maintain our principal executive offices at One AMC Way, 11500 Ash Street, Leawood, Kansas 66211.
Liquidity
As of December 31, 2024, we had cash and cash equivalents of approximately $632.3 million.
We took action to lower the future interest expense of our fixed-rate debt through debt buybacks and exchanges for equity and enhanced liquidity through equity issuances. See Note 8—Corporate Borrowings and Finance Lease Liabilities, Note 9—Stockholders’ Deficit, and Note 16—Subsequent Events in the Notes to the Consolidated Financial Statements under Part II, Item 8 of this Form 10-K, for further information.
We expect to, from time to time, continue to seek to retire or purchase our outstanding debt through cash purchases and/or exchanges for equity or debt, in open-market purchases, privately negotiated transactions or otherwise. Such repurchases or exchanges, if any, will be upon such terms and at such prices as we may determine, and will depend on prevailing market conditions, our liquidity requirements, contractual restrictions and other factors. The amounts involved may be material, and to the extent equity is used, dilutive.
Refinancing Transactions
On July 22, 2024, we completed a series of refinancing transactions (the “Refinancing Transactions”) with two creditor groups to refinance and extend to 2029 and 2030 the maturities of approximately $1.6 billion of our debt previously maturing in 2026.
During the third quarter of 2024 we completed follow-on open market repurchases of our existing senior secured term loans maturing 2026 (the “Existing Term Loans”), and in exchange, issued to such selling holders our New Term Loans (as defined herein) pursuant to the New Term Loan Credit Agreement (as defined herein) of approximately $793.0 million.
As of December 31, 2024, we completed open market purchases of $1,895.0 million aggregate principal amount of our Existing Term Loans and issued $2,024.3 million aggregate principal amount of the New Term Loans. Accordingly, as of such date, the Company had no remaining aggregate principal amount of Existing Term Loans outstanding and the loan documents relating to the Existing Term Loans were terminated.
Please see Item 7—Management’s Discussion and Analysis of Financial Condition and Results of Operations and Note 8—Corporate Borrowings and Finance Lease Liabilities in the Notes to the Consolidated Financial Statements under Part II, Item 8 of this Form 10-K for additional information.
5
Narrative Description of Business
We are the world’s largest theatrical exhibition company and an industry leader in innovation and operational excellence. Over the course of our 100+ year history, we have pioneered many of the theatrical exhibition industry’s most important innovations. We introduced multiplex theatres in the 1960s and the North American stadium-seated Megaplex theatre format in the 1990s. Most recently, we continued to innovate and evolve the movie-going experience with the deployment of our theatre renovations featuring plush, powered recliner seating and the launch of our U.S. subscription loyalty tier, AMC Stubs® A-List. Our growth has been driven by a combination of organic growth through reinvestment in our existing assets and through the acquisition of some of the most significant companies in the theatrical exhibition industry.
Our business is operated in two theatrical exhibition reportable segments, U.S. markets and International markets. Substantially all of our international operations are attributed to Odeon Cinemas Group Limited (“OCGL”) and its subsidiaries (collectively with OCGL, unless the context otherwise requires, “Odeon Cinemas Group”), Odeon and UCI Cinemas Holdings Limited (“Odeon”) and Nordic Cinema Group Holding AB (“Nordic”).
As of December 31, 2024, we owned, leased or operated 871 theatres and 9,798 screens in 11 countries, including 544 theatres with a total of 7,185 screens in the United States and 327 theatres and 2,613 screens in European markets. We have productive assets in each of the capital cities and most densely populated areas of the countries in which we operate.
As of December 31, 2024, we were the market leader in the United States and Europe including in Italy, Sweden, Norway, and Finland, and a leading theatre operator in the United Kingdom, Ireland, Spain, Portugal and Germany. We have operations in four of the world’s 10 largest economies, including four of the six largest European economies (the United Kingdom, Spain, Italy and Germany) as of December 31, 2024.
As of December 31, 2024, in the U.S. markets, we owned, leased or operated theatres in 41 states and the District of Columbia, with approximately 48% of the U.S. population living within 10 miles of one of our theatres. We have a diversified footprint with complementary global geographic and guest demographic profiles, which we believe gives our circuit a unique profile and offers us strategic and operational advantages while providing our studio partners with a large and diverse distribution channel. We operate some of the most productive theatres in the top markets in the United States and were the market leader in the top two markets for the year ended December 31, 2024: Los Angeles and New York. During 2024, our top five markets, in each of which we held the #1 share position, were New York, Los Angeles, Chicago, Atlanta, and Philadelphia, according to data provided by Comscore.
6
The following table provides detail with respect to the geographic location of our theatrical exhibition circuit as of December 31, 2024:
U.S. Markets |
|
Theatres(1) |
|
Screens(1) |
|
Alabama |
|
18 |
|
237 |
|
Arizona |
|
12 |
|
187 |
|
Arkansas |
|
2 |
|
21 |
|
California |
|
57 |
|
777 |
|
Colorado |
|
14 |
|
193 |
|
Connecticut |
|
9 |
|
104 |
|
Florida |
|
38 |
|
588 |
|
Georgia |
|
26 |
|
350 |
|
Idaho |
1 |
11 |
|||
Illinois |
|
47 |
|
578 |
|
Indiana |
|
21 |
|
276 |
|
Iowa |
|
3 |
|
43 |
|
Kansas |
|
9 |
|
132 |
|
Kentucky |
|
2 |
|
40 |
|
Louisiana |
|
7 |
|
99 |
|
Maryland |
|
14 |
|
164 |
|
Massachusetts |
|
11 |
|
154 |
|
Michigan |
|
10 |
|
154 |
|
Minnesota |
|
6 |
|
95 |
|
Missouri |
|
9 |
|
108 |
|
Montana |
5 |
55 |
|||
Nebraska |
|
1 |
|
14 |
|
Nevada |
|
2 |
|
28 |
|
New Jersey |
|
25 |
|
319 |
|
New Mexico |
1 |
12 |
|||
New York |
|
30 |
|
322 |
|
North Carolina |
|
19 |
|
244 |
|
North Dakota |
1 |
9 |
|||
Ohio |
|
11 |
|
140 |
|
Oklahoma |
|
11 |
131 |
||
Oregon |
2 |
25 |
|||
Pennsylvania |
|
24 |
|
276 |
|
South Carolina |
|
2 |
|
26 |
|
South Dakota |
1 |
10 |
|||
Tennessee |
15 |
191 |
|||
Texas |
|
40 |
|
590 |
|
Utah |
|
3 |
|
29 |
|
Virginia |
|
13 |
|
173 |
|
Washington |
|
15 |
|
181 |
|
West Virginia |
1 |
12 |
|||
Wisconsin |
|
5 |
|
73 |
|
District of Columbia |
1 |
|
14 |
||
Total U.S. Markets |
544 |
7,185 |
|||
International Markets |
|||||
Denmark |
2 |
12 |
|||
Finland |
31 |
174 |
|||
Germany |
21 |
188 |
|||
Ireland |
11 |
77 |
|||
Italy |
37 |
378 |
|||
Norway |
12 |
90 |
|||
Portugal |
3 |
42 |
|||
Spain |
35 |
413 |
|||
Sweden |
72 |
394 |
|||
United Kingdom |
103 |
845 |
|||
Total International Markets |
327 |
2,613 |
|||
Total |
|
871 |
|
9,798 |
| (1) | Included in the above table are 65 theatres and 320 screens that we manage or in which we have a partial ownership interest. In the U.S. markets segment, we manage or have a partial interest in four theatres and 55 screens. In the International markets segment, we manage or have a partial interest in 61 theatres and 265 screens. |
Our theatrical exhibition revenues are generated primarily from box office admissions and theatre food and beverage sales. We offer consumers a broad range of entertainment alternatives including traditional film programming,
7
private theatre rentals, independent and foreign films, performing arts, music and sports. We also offer food and beverage alternatives beyond traditional concession items, including collectible concession vessels, made-to-order meals, customized coffee, healthy snacks, beer, wine, premium cocktails, and dine-in theatre options. The balance of our revenues is generated from ancillary sources, including on-screen advertising, fees earned from our customer loyalty programs, rental of theatre auditoriums, income from gift card and exchange ticket sales, theatrical distribution, retail popcorn sales, and online ticketing fees.
Our Strategy
We are committed to maintaining a leadership position in the exhibition industry by focusing on forward-thinking initiatives for the benefit of our guests. We do this through a combination of unique marketing outreach, seamless digital technology and innovative theatre amenities designed for us to 1) be a world-class leader in customer engagement, 2) deliver the best in-person experience while at AMC theatres, 3) selectively enhance our footprint through expansion in attractive markets, investments in Premium Large Format (“PLF”) screens, and strategic closure of underperforming theatres, 4) pursue adjacent opportunities that extend the AMC brand, and 5) explore attractive acquisitions leveraging our existing capabilities and core competencies. Consistent with our history and culture of innovation, we believe our vision and relentless focus on these key elements, which apply strategic and marketing components to traditional theatrical exhibition, will drive our future success.
| 1) | Be a World-Class Leader in Customer Engagement |
We engage movie-goers through advances in technology and marketing activities to strengthen the bonds with our current guests and create new connections with potential customers that drive both growth and loyalty. We serve our guests, end-to-end, from before they enter our theatres, through their enjoyment of a comprehensive spectrum of film content while at our theatres and then again after the movie when they’ve left the theatre and are deciding what film to see the next time they visit.
In our U.S. markets, we begin the process of engagement with AMC Stubs® (“Stubs”), our customer loyalty program, which allows members to earn rewards, receive discounts and participate in exclusive members-only offerings and services. It features a paid tier called AMC Stubs Premiere™ (“Premiere”) for a flat annual membership fee and a non-paid tier called AMC Stubs Insider™ (“Insider”). Both programs reward loyal guests for their patronage of AMC theatres. Rewards earned are redeemable on future purchases at AMC locations.
AMC Stubs® A-List (“A-List”) is our monthly subscription-based tier of our Stubs loyalty program. This program offers guests admission to movies at AMC up to three times per week, including multiple movies per day and repeat visits to movies. A-List also includes premium offerings including IMAX®, Dolby Cinema™ at AMC, RealD, Prime and other PLF brands. A-List members can book tickets online in advance with reserved seating at AMC Theatres for no additional cost.
As of December 31, 2024, we had a combined total of approximately 35 million member households enrolled in A-List, Premiere, and Insider programs. Our Stubs members represented approximately 49% of our U.S. market attendance during the year ended December 31, 2024. Our large database of identified movie-goers also provides us with additional insight into our customers’ movie preferences. This enables us to have an increasingly comprehensive, more personalized and targeted marketing effort.
On January 1, 2025, we introduced a new Stubs tier—AMC Stubs® Premiere GO! (“Premiere GO!”). Premiere GO! membership is earned by existing Insider members by visiting a certain number of times or earning a certain number of points within a calendar year. Premiere GO! allows members to earn additional points and other exclusive benefits.
In our International markets, we currently have loyalty programs in all territories in which we operate. Movie-goers can earn points for spending money at the theatre, and those points can be redeemed for tickets or food and beverage items, depending on the program, at a later date. We currently have approximately 18 million members in our various International loyalty programs.
Our marketing efforts expand beyond our loyalty program. We continue to improve our customer connections through our website and mobile apps. Our mobile applications across the U.S. circuit offer the ability to order food and beverage while ordering tickets ahead of scheduled showtimes.
8
In June 2021, the Company launched AMC Investor Connect (“AIC”), an innovative new communication initiative to engage directly with its sizable retail shareholder base and convert shareholders into AMC consumers. AIC allows our shareholders to self-identify through our website and receive special offers and important communications. As part of AIC, domestic members must sign up for a Stubs account, which includes providing additional personalized data that allows us to more precisely engage with our investor consumers. As of December 31, 2024, there were approximately 1.5 million global members of AIC, which is comprised of both registered and beneficial shareholders.
| 2) | Deliver the best in-person experience while at AMC theatres |
In conjunction with our advances in technology and marketing initiatives, and consistent with our long-term growth strategy, we plan to continue investing in our theatres and enhancing the consumer experience to deliver the best in-person experience and take greater advantage of incremental revenue-generating opportunities, primarily through comfort and convenience innovations, imaginative food and beverage initiatives, and exciting PLF offerings.
Comfort and Convenience. Recliner seating is a key feature of many of our locations. We believe that maximizing comfort and convenience for our customers will be increasingly necessary to maintain and improve our relevance. These locations include plush, electric recliners that allow customers to deploy a leg rest and fully recline at the push of a button. These locations typically warrant increased ticket prices to reflect the enhanced consumer experience.
As of December 31, 2024, in our U.S. markets, we featured recliner seating in 365 U.S. theatres, including Dine-in-Theatres, totaling approximately 3,620 screens and representing 50.4% of total U.S. screens. In our International markets, as of December 31, 2024, we had recliner seating in 86 International theatres, totaling 605 screens and representing 23.2% of total International screens.
Open-source internet ticketing makes AMC’s entire universe of seats in the U.S. (approximately 1 million as of December 31, 2024), for all our show times, as available as possible, on as many websites and mobile applications as possible. Our tickets are currently sold either directly at the box office or through mobile apps, at our own website and mobile app and through other third-party ticketing vendors. For the year ended December 31, 2024, approximately 70% of our tickets were purchased online in the U.S., with approximately 85% of total online tickets being purchased through our own website and mobile apps.
Imaginative Food and Beverage Initiatives. Our deployment initiatives also apply to food and beverage enhancements. We have expanded our menu of enhanced food and beverage products to include meals, healthy snacks, premium beers, wine and mixed drinks, and other gourmet products. Our long-term growth strategy calls for investment across a spectrum of enhanced food and beverage formats, ranging from simple, less capital-intensive food and beverage design improvements to the development of new dine-in theatre options. We have expanded the capabilities of our online and mobile apps to include the ability to pre-order food and beverages when advanced tickets are purchased. Guests then have the items ready upon arrival and available at dedicated pick-up areas or delivered to seat at select theatres.
Our MacGuffins Bar and Lounges (“MacGuffins”) give us an opportunity to offer alcohol to our legal age customers in our U.S. markets. As of December 31, 2024, we offered alcohol in 383 theatres in our U.S. markets and 226 theatres in our International markets.
Expand Movie Themed Merchandise Offerings. We offer our guests the opportunity to purchase collectible concession vessels associated with films released throughout the year. These unique items drive movie-goers to our theatres and increase consumer engagement. We continue to look for opportunities to further expand our collectible concession vessel offerings and other movie themed retail merchandise offerings.
Exciting Premium Large Format and Extra Large Screen Offerings. PLF auditoriums generate our highest customer satisfaction scores, and we believe the investment in PLFs increases the value of the movie-going experience for our guests, ultimately leading to additional ticket revenue. To that end, we are committed to investing in and expanding our offerings of the best sight and sound experiences through a combination of our partnerships with IMAX® and Dolby Cinema™ and the further development of our own PLF offerings.
| ● | IMAX®. IMAX® is one of the world’s leading entertainment technology companies, specializing in motion picture technologies and presentations. |
9
As of December 31, 2024, AMC was the largest IMAX® exhibitor in the U.S., with 184 IMAX® screens and a 56% market share. Each one of our IMAX® local installations is protected by geographic exclusivity, and as of December 31, 2024, our IMAX® screen count was 102% higher than our closest competitor. Additionally, as of December 31, 2024, our per-screen grosses were 34% higher than our closest competition. We also operate 36 IMAX® screens in International markets. As part of our long-term growth strategy, we expect to continue to expand our IMAX® relationship across the U.S. and Europe, further strengthening our position as the largest IMAX® exhibitor in the U.S. and a significant IMAX® exhibitor in Europe.
| ● | Dolby Cinema™. Dolby Cinema™ offers a premium cinema offering for movie-goers that combines state-of-the-art image and sound technologies with inspired theatre design and comfort. Dolby Cinema™ at AMC includes Dolby Vision™ laser projection and object-oriented Dolby Atmos® audio technology, as well as AMC’s plush power reclining seats with seat transducers that vibrate with the action on screen. |
As of December 31, 2024, we operated 167 Dolby Cinema™ at AMC auditoriums in the U.S. and seven Dolby Cinema™ auditoriums in the International markets. We expect to expand the deployment of our innovative Dolby Cinema™ auditoriums in both our U.S. and International markets as part of our long-term growth strategy.
| ● | In-house PLF Brands. We also offer our private label PLF experience at many of our locations, with superior sight and sound technology and enhanced seating. These PLF auditoriums offer an enhanced theatrical experience for movie-goers beyond our current core theatres, at a lower price premium than IMAX® or Dolby Cinema™. Therefore, they may be especially relevant in smaller or more price-sensitive markets. As of December 31, 2024, we operated 60 screens under in-house PLF brand names in the U.S. markets and 82 screens in the International markets. |
| ● | Extra Large (“XL”) Screens. In addition to PLF offerings, we also offer screens that are at least 40-feet wide and include 4K laser projection. |
The following table provides detail with respect to Premium Large Format screens (IMAX®, Dolby Cinema™, in-house), XL screens, premium seating, and our enhanced food and beverage offerings as deployed throughout our circuit on December 31, 2024 and December 31, 2023:
U.S. Markets |
International Markets |
Consolidated |
||||||||||
|
Year Ended |
Year Ended |
Year Ended |
|||||||||
|
December 31, |
December 31, |
December 31, |
|||||||||
Format |
2024 |
|
2023 |
|
2024 |
|
2023 |
|
2024 |
|
2023 |
|
Number of theatres: |
|
|||||||||||
IMAX® |
183 |
183 |
36 |
33 |
219 |
216 |
||||||
Dolby Cinema™ theatres |
|
167 |
|
162 |
7 |
|
7 |
|
174 |
|
169 |
|
In-house PLF |
60 |
57 |
79 |
76 |
139 |
133 |
||||||
Dine-in |
|
48 |
|
49 |
3 |
|
3 |
|
51 |
|
52 |
|
Premium seating |
365 |
362 |
86 |
82 |
451 |
444 |
||||||
XL screens |
— |
— |
60 |
— |
60 |
— |
||||||
Number of screens: |
|
|
|
|||||||||
IMAX® |
184 |
184 |
36 |
33 |
220 |
217 |
||||||
Dolby Cinema™ theatres |
|
167 |
|
162 |
7 |
|
7 |
|
174 |
|
169 |
|
In-house PLF |
60 |
57 |
82 |
79 |
142 |
136 |
||||||
Dine-in |
666 |
675 |
13 |
13 |
679 |
688 |
||||||
Premium seating |
3,620 |
3,588 |
605 |
554 |
4,225 |
4,142 |
||||||
XL screens |
— |
— |
68 |
— |
68 |
— |
||||||
Laser at AMC. We launched Laser at AMC, a broadscale initiative to upgrade the projectors in at least 3,500 auditoriums throughout the U.S., with cutting-edge laser projectors. The Laser at AMC experience delivered by laser projection from Barco, a global leader in laser-powered cinema solutions, provides guaranteed light levels that are at the top end of the 2D DCI specification. This technology improves image contrast, produces more vivid colors, and maximizes brightness, compared to digital projectors with a xenon light source. We are partnering with Barco through their Cinema-as-a-Service program which requires minimal upfront capital investment by AMC. The initial agreement to
10
install 3,500 projectors is expected to be completed by 2026, with 2,125 installations completed as of December 31, 2024.
During 2024, we also started deploying laser projectors across our international markets with 40 projectors installed outside of the US Markets as of December 31, 2024. We expect to continue to increase our laser projector installations internationally in the coming years.
| 3) | Performance-Based Expansion and Strategic Closure of Theatres |
Our long-term growth strategy includes the deployment of our strategic growth initiatives, opening new-build theatres and continued exploration of small acquisitions. By expanding our platform through disciplined new-build theatres and acquisitions, we are able to further deploy our proven strategic initiatives while further diversifying our consumer base, leading to greater appeal for more films. The additional scale achieved through new-build theatres and acquisitions also serves to benefit our business through global procurement savings and increased overhead efficiencies. We believe that expansion offers us additional opportunities to introduce our proven guest-focused strategies to movie-goers and will generate meaningful benefits to guests, employees, studio partners and our shareholders.
The following table sets forth our historical information concerning new builds (including expansions), acquisitions and dispositions (including permanent closures of underperforming theatres and net construction closures) and end-of-period operated theatres and screens through December 31, 2024:
Permanent/Temporary |
|
||||||||||||||||
(Closures)/Openings, |
|
||||||||||||||||
New Builds |
Acquisitions |
net |
Total Theatres |
|
|||||||||||||
|
Number of |
|
Number of |
|
Number of |
|
Number of |
|
Number of |
|
Number of |
|
Number of |
|
Number of |
|
|
Calendar Year |
Theatres |
Screens |
Theatres |
Screens |
Theatres |
Screens |
Theatres |
Screens |
|
||||||||
Beginning balance |
|
|
1,004 |
|
11,041 |
||||||||||||
2020 |
|
8 |
63 |
1 |
14 |
(63) |
(575) |
|
950 |
|
10,543 |
||||||
2021 |
|
10 |
82 |
11 |
140 |
(25) |
(203) |
946 |
10,562 |
||||||||
2022 |
7 |
51 |
15 |
157 |
(28) |
(296) |
940 |
10,474 |
|||||||||
2023 |
— |
— |
6 |
31 |
(48) |
(446) |
898 |
10,059 |
|||||||||
2024 |
1 |
13 |
2 |
9 |
(30) |
(283) |
871 |
9,798 |
|||||||||
|
26 |
|
209 |
35 |
|
351 |
|
(194) |
|
(1,803) |
|||||||
| 4) | Pursue Adjacent Opportunities that Extend the AMC Brand |
We believe there is considerable opportunity to extend and monetize the AMC brand outside of our movie theatre auditoriums. We plan to pursue opportunities that capitalize on our attractive customer base, our leading brand, our 100+ years of food and beverage expertise, and technology capabilities.
As part of that strategy, we have expanded our food and beverage business beyond theatrical exhibition and entered the multi-billion dollar popcorn industry with the launch of AMC Theatres Perfectly Popcorn in the U.S. markets.
| ● | During 2023, we began offering ready-to-eat and microwaveable AMC Theatres Perfectly Popcorn products that are available or will be available for purchase in well-known grocery stores around the country or on-line via Amazon.com. |
| ● | Freshly popped AMC Theatres Perfectly Popcorn is available through food delivery-to-home services. |
| ● | “To Go” packages at our theatres of freshly popped popcorn are available for takeout and/or pickup. |
AMC Theatres Perfectly Popcorn is an opportunity to diversify our business and to create a new food and beverage revenue stream.
During 2024, we rolled out AMC Cinema SweetsTM, our line of premium gourmet candy. AMC Cinema Sweets are available to moviegoers at AMC concession stands throughout the United States.
We made our inaugural foray into theatrical distribution in 2023 when we, along with our sub-distribution partners, served as the theatrical distributor for two theatrical releases: TAYLOR SWIFT | THE ERAS TOUR and RENAISSANCE: A FILM BY BEYONCÉ. During 2024, we distributed USHER: RENDEZVOUS IN PARIS and BILLIE EILISH: HIT ME HARD AND SOFT, an album listening experience. We have the potential to capitalize on new
11
theatrical distribution opportunities in the future which would lead to additional theatrical distribution revenue and increased admissions revenue.
| 5) | Explore Attractive Acquisitions Leveraging Our Existing Capabilities and Core Competencies |
As part of our plans to pursue value-enhancing initiatives that lead to diversification of our business, we will consider attractive and opportunistic acquisitions inside and outside the theatrical exhibition industry that leverage our footprint and capabilities, as well as the core competencies and experiences of our management team.
Our Competitive Strengths
We believe we have the following competitive strengths:
Leading guest engagement through digital marketing and technology platforms. Through our Stubs loyalty programs, we have developed a consumer database of approximately 35 million households, representing approximately 70 million individuals. Our digital marketing and technology platforms allow us to engage with these customers frequently, efficiently and on a very personalized level. We believe personalized data drives increased engagement, resulting in higher attendance.
Leading market share in important, affluent and diverse markets. As of December 31, 2024, across our three biggest metropolitan markets in the United States—New York, Los Angeles and Chicago, representing 17% of the country’s total box office—we held a 44% combined market share. We operated theatres located in the top 25 U.S. markets, holding the #1 or #2 position in 18 of those 25 markets based on box office revenue. As of December 31, 2024, we are also the #1 theatre operator in Italy, Sweden, Norway, and Finland; the #2 operator in the United Kingdom, Ireland, Spain and Portugal, and the #4 operator in Germany. We believe our strong presence in these top markets makes our theatres highly visible and therefore strategically more important to content providers, who rely on the large audiences and marketing momentum provided by major markets to drive opinion-making and deliver a movie’s overall box office results.
We also have a diversified footprint with complementary global geographic and guest demographic profiles. We have theatres in more densely populated major metropolitan markets, where there is also a scarcity of attractive retail real estate opportunities, as well as complementary suburban and rural markets. Guests from different demographic and geographic profiles have different tastes in movies, and we believe by broadening our geographic base, we can help mitigate the impact of film genre volatility on our box office revenues.
Well located and highly productive theatres. Our theatres are generally located in the top retail centers across the U.S. We believe this provides for long-term visibility and higher productivity and is a key element in the success of our enhanced food and beverage and more comfort and convenience initiatives. Our location strategy, combined with our strong major market presence, enable us to deliver industry-leading theatre-level productivity. During the year ended December 31, 2024, 8 of the 10 highest grossing theatres in the U.S. were AMC theatres, according to data provided by Comscore. During the same period, AMC’s U.S. markets average total revenues per theatre was approximately $6.5 million. This per unit productivity is important not only to content providers, but also to developers and landlords, for whom per location and per square foot sales numbers are critical measures.
Our AMC Classic branded theatres are located primarily in smaller, suburban and rural markets, which affects total revenues per theatre. However, in general, theatres located in smaller suburban and rural markets tend to have less competition and a lower cost structure.
In our International markets, many theatres are located in top retail centers in major metropolitan markets with high visibility. We believe that deploying our proven strategic initiatives in these markets will help drive attendance and greatly improve productivity. Other theatres are in larger and mid-sized cities and towns in affluent regions.
Deployment of unique pricing structures to enhance revenue. We have developed a dedicated pricing department and, as a result, we have deployed several different strategic pricing structures that have increased revenue and profitability.
A-List is our monthly subscription-based tier of our Stubs loyalty program. This program offers guests admission to movies at AMC up to three times per week, including multiple movies per day and repeat visits to movies. We also offer Stubs members “Discount Tuesday”, a reduced price for movie attendance on Tuesdays.
12
Sources of Revenue
Box Office Admissions and Film Content. Box office admissions are our largest source of revenue. We predominantly license theatrical films from distributors owned by major film production companies and from independent distributors on a film-by-film and theatre-by-theatre basis. Film exhibition costs are based on a share of admissions revenues and are accrued based on estimates of the final settlement pursuant to our film licenses. These licenses typically state that rental fees are based on the box office performance of each film, though in certain circumstances and less frequently, our rental fees are based on a mutually agreed settlement rate that is fixed. In some European territories, film rental fees are established on a weekly basis and some licenses use a per capita agreement instead of a revenue share, paying a flat amount per ticket.
During the year ended December 31, 2024, films licensed from our seven largest movie studio distributors based on revenues accounted for approximately 84% of our U.S. admissions revenues, which consisted of Disney, Universal, Warner Bros., Sony, Paramount, MGM, and 20th Century Studios. In Europe, approximately 74% of our box office revenue came from films attributed to our five largest movie distributor groups, which consisted of Disney, Warner Bros., Universal, Sony, and Paramount. Our revenues attributable to individual distributors may vary significantly from year to year depending upon the commercial success of each distributor’s films in any given year.
During 2023 we, along with our sub-distribution partners, served as the theatrical distributor for two theatrical releases: TAYLOR SWIFT | THE ERAS TOUR and RENAISSANCE: A FILM BY BEYONCÉ. During 2024, we distributed USHER: RENDEZVOUS IN PARIS and BILLIE EILISH: HIT ME HARD AND SOFT, an album listening experience. The distribution business is a newer source of revenue.
Food and Beverage. Food and beverage sales are our second largest source of revenue after box office admissions. We offer enhanced food and beverage products that include meals, healthy snacks, premium liquor, beer and wine options, and other gourmet products. Our long-term growth strategy calls for investment across a spectrum of enhanced food and beverage formats, ranging from simple, less capital-intensive food and beverage menu improvements to the expansion of our Dine-In-Theatre brand.
We currently operate 48 Dine-In-Theatres in the U.S. and three Dine-In-Theatres in Europe that deliver chef-inspired menus with seat-side or delivery service to luxury recliners with tables. Our recent Dine-In-Theatre concepts are designed to capitalize on the latest food service trend, the fast and casual eating experience.
MacGuffins give us an opportunity to offer alcohol to our legal age customers in our U.S. markets. As of December 31, 2024, we offered alcohol in approximately 383 theatres in our U.S. markets and 226 theatres in our International markets and continue to explore expansion globally.
During 2023, we began offering ready-to-eat and microwaveable AMC Theatres Perfectly Popcorn products that are available for purchase in well-known grocery stores around the country or on-line via Amazon.com. During 2024, we rolled out AMC Cinema SweetsTM, our line of premium gourmet candy. AMC Cinema Sweets are available to moviegoers at AMC concession stands throughout the United States.
Theatrical Exhibition Industry and Competition
U.S. markets. In the U.S., the movie exhibition business is large and mature. We believe it is the quality of the movie-going experience that will define our future success. Whether through enhanced food and beverage options (Food and Beverage Kiosks, Marketplaces, Coca-Cola Freestyle, MacGuffins or Dine-in-Theatres), more comfort and convenience (recliner seating, open-source internet ticketing, reserved seating), engagement and loyalty (AMC Stubs®, mobile apps, social media, or AMC Investor Connect) or sight and sound (digital and laser projection, 3D, Dolby Cinema™ at AMC, IMAX® or other PLF screens), it is the ease of use and the amenities that these innovations bring to customers that we believe will help drive sustained profitability in the years ahead.
Preliminary estimates indicate that North American box office revenues were approximately $8.7 billion for 2024, down approximately 3% compared with 2023.
13
The following table represents information about the U.S./Canada exhibition industry obtained from the National Association of Theatre Owners, with the exception of box office revenues for calendar years 2023, 2022, and 2021 obtained from Comscore. See Management’s Discussion and Analysis of Financial Condition and Results of Operations under Part II, Item 7 of this Form 10-K for information regarding our operating data:
|
Box Office |
|
|
Average |
|
||||
Revenues |
Attendance |
Ticket |
|
||||||
Calendar Year |
(in millions) |
(in millions) |
Price |
|
|||||
2023 |
$ |
9,034 |
833 |
$ |
10.84 |
||||
2022 |
7,454 |
708 |
10.53 |
||||||
2021 |
4,544 |
447 |
10.17 |
||||||
2020 |
2,205 |
240 |
9.18 |
||||||
2019 |
11,400 |
1,244 |
9.16 |
||||||
2018 |
11,880 |
1,304 |
9.11 |
||||||
2017 |
|
11,091 |
1,236 |
8.97 |
|||||
2016 |
|
11,372 |
1,314 |
8.65 |
|||||
2015 |
|
11,120 |
|
1,320 |
|
8.42 |
|||
Based on information obtained from Comscore, we believe that the three largest exhibitors, in terms of U.S./Canada box office revenue (AMC, Regal Entertainment Group, and Cinemark Holdings, Inc.) generated approximately 53% of the box office revenues in 2024.
International markets. Movie-going is a popular leisure activity with high penetration across key geographies in our International markets. Theatre appeal has proven resilient to competition for consumers’ leisure spending and to recessionary periods. The European market lags the U.S. market across a number of factors, including annual spend per customer, number of IMAX® screens, and screens per capita, which causes us to believe that the deployment of our customer initiatives will be successful in these markets. Additionally, our European markets are more densely populated and operate with fewer screens per one million people, making the screens more valuable.
U.S. films generate the majority of the box office in Europe, but movie-goers in specific geographies also welcome locally produced films with local actors and familiar story lines which can mitigate film genre attendance fluctuations.
The following table provides information about the exhibition industry attendance for the International markets where we operate obtained from territory industry trade sources; see Management’s Discussion and Analysis of Financial Condition and Results of Operations under Part II, Item 7 of this Form 10-K for information regarding our operating data:
Calendar Year |
||||||||||
(In millions) |
2024 |
2023 |
2022 |
2021 |
2020 |
|||||
United Kingdom |
126.5 |
124.4 |
117.5 |
74.6 |
44.0 |
|||||
Germany |
89.0 |
96.3 |
78.6 |
42.5 |
37.3 |
|||||
Spain |
71.0 |
75.9 |
59.8 |
41.5 |
28.7 |
|||||
Italy |
74.5 |
75.0 |
47.9 |
26.6 |
30.2 |
|||||
Sweden |
10.4 |
11.8 |
10.4 |
6.1 |
5.4 |
|||||
Ireland |
11.8 |
11.6 |
10.7 |
6.1 |
3.9 |
|||||
Portugal |
11.4 |
11.2 |
9.2 |
5.3 |
3.6 |
|||||
Norway |
8.1 |
9.3 |
8.8 |
5.6 |
4.8 |
|||||
Finland |
6.8 |
7.2 |
5.8 |
3.4 |
3.9 |
|||||
Total |
409.5 |
422.7 |
348.7 |
211.7 |
161.8 |
|||||
Competition. Our theatres are subject to varying degrees of competition in the geographic areas in which they operate. Competition is often intense with respect to attracting patrons, licensing motion pictures and finding new theatre sites. Where real estate is readily available, it is easier to open a theatre near one of our theatres, which may adversely affect operations at our theatre. However, in certain of our densely populated major metropolitan markets, we believe a scarcity of attractive retail real estate opportunities enhances the strategic value of our existing theatres. We also believe the complexity inherent in operating in these major metropolitan markets is a deterrent to other less sophisticated competitors, protecting our market share position.
14
The theatrical exhibition industry faces competition from other forms of out-of-home entertainment, such as concerts, amusement parks and sporting events, and from other distribution channels for filmed entertainment, such as video streaming services, premium video on demand (“PVOD”), cable television, pay-per-view, and home video systems, as well as from all other forms of entertainment.
We believe movie-going is a compelling consumer out-of-home entertainment experience. Movie theatres currently garner a relatively small share of overall consumer entertainment time and spend, and our industry benefits from available capacity to satisfy additional consumer demand.
Seasonality
Our revenues are dependent upon the timing of motion picture releases by distributors. The most marketable motion pictures are usually released during the summer and the year-end holiday seasons. Therefore, our business is seasonal, with higher attendance and revenues generally occurring during the summer months and holiday seasons.
Regulatory Environment
Our theatres in the U.S. must comply with Title III of the Americans with Disabilities Act (“ADA”). Compliance with the ADA requires that public accommodations, including websites and mobile apps for such accommodations, be accessible to individuals with disabilities and that new construction or alterations are made to conform to accessibility guidelines. Non-compliance with the ADA could result in the imposition of injunctive relief, fines, and awards of damages to private litigants and additional capital expenditures to remedy such noncompliance. As an employer covered by the ADA, we must make reasonable accommodations to the limitations of employees and qualified applicants with disabilities, provided that such reasonable accommodations do not pose an undue hardship on the operation of our business. In addition, many of our employees are covered by various government employment regulations, including minimum wage, overtime and working conditions regulations. In Europe, all territories have similar national regulations relating to disabilities.
Our operations also are subject to federal, state and local laws regulating such matters as construction, renovation and operation of theatres, as well as wages and working conditions, citizenship, health and sanitation requirements, consumer and employee privacy rights, and licensing, including alcoholic beverage sales. We believe our theatres are in material compliance with such requirements.
We own and operate theatres and other properties in the United States, United Kingdom, Spain, Italy, Germany, Portugal, Ireland, Sweden, Finland, Norway, and Denmark, which are subject to various federal, state and local laws and regulations. Certain of these laws and regulations, including those relating to environmental protection, may impose joint and several liability on certain statutory classes of persons for the costs of investigation or remediation of contamination, regardless of fault or the legality of original disposal. We believe our theatres are in material compliance with such requirements.
Additionally, there are multiple sustainability and ESG (Environmental, Social, and Governance) disclosure regulations taking effect in the next several years in the United States and Europe, including the California Climate Accountability Package, the Corporate Sustainability Reporting Directive, and numerous city, county, and state regulations covering commercial building energy usage and emissions.
Human Capital Resources
Our People. AMC promotes a healthy culture where people are encouraged to achieve their personal best and work together with integrity and openness to change. AMC associates are core to our commitment to deliver the best theatrical experience in the world. They uphold AMC’s mission of focusing on the guest experience where excellent customer service is complemented with amazing food and beverage, comfort, and premium sight and sound.
As of December 31, 2024, we employed a total of 33,382 associates consisting of 2,915 full-time and 30,467 part-time associates, down from a total of 33,812 associates consisting of 2,881 full-time and 30,931 part-time associates as of December 31, 2023. Among our 33,382 associates, we employed 23,764 in the United States and 9,618 in our International markets.
15
Talent Acquisition, Development and Retention. Critical to our operation is the hiring, development, and retention of qualified associates who support our guest-focused mission. Acquiring the right talent at speed and scale is a core capability that we regularly monitor and manage, given the need to rapidly staff our frontline operations at certain times of the year. Once hired, we train for success, creating experiences and programs that promote performance, growth, and long-term career opportunities. Programs like our Leadership Academy (AMC) and Incredible Leadership (Odeon) are designed to upskill and enhance managerial capability, facilitate quality execution of our business initiatives, drive guest satisfaction, and increase return on investment. Furthermore, our trainings include compulsory modules that meet regulatory requirements, policy enforcement and best practices to adhere to employment laws, practical tactics for safety and security, and compliance with anti-corruption regulations. Our measures to maintain a holistic view of the associate experience support the needs of our associates through engagement opportunities, including recognition programs and events.
Belonging for All. Belonging for All is a core cultural value and key driver to our success. AMC’s commitment to fostering Belonging for All enables us to maintain a global workforce as diverse as the guests we serve and the movies we show on our screens. Through a multi-channel approach, we promote cultural humility and provide continuous learning opportunities that directly contribute to business performance. AMC is guided by six advisory councils, which help shape a workplace where all employees are encouraged to bring their authentic selves to work and contribute to our success. By appointing officers as Executive Sponsors of these councils, we ensure senior leadership and accountability. This approach has enhanced openness, reinforced the value of diversity, and strengthened our business outcomes. Our culture thrives as we embrace diversity and lead with fairness, creating a more inclusive workplace for all.
Additionally, our work has been recognized externally: AMC has received a perfect score for 16 consecutive years on the Human Rights Campaign Foundation’s Corporate Equality Index as one of the Best Places to Work for LGBTQ Equality; 10 consecutive years as one of the Best Places to Work for people with disabilities through the Disability Equality Index; named one of Forbes Best Employers for Diversity from 2018-2022 and Best Employers for Women in 2024, recognized by Newsweek in 2023 as one of America’s Greatest Workplaces for Diversity, America’s Greatest Workplaces for LGBTQ+, America’s Greatest Workplaces for Job Starters, and America’s Greatest Workplaces for Parents & Families, and most recently by Time Magazine’s America’s Best Companies 2024 in the Mid-Size category, Certified Great Place to Work 2025/2025 and as a 50/50 Women on Boards.
Odeon has 9 advisory forums in total across Europe. The forums cover all belonging facets including gender, ethnicity, disability, wellbeing and socio-economic status. Odeon’s Culture and Development Team was named EDI Team of the Year at the Inaugural Inclusion Awards, powered by WiHTL & DiR.
Compensation, Benefits, Safety and Wellness. We offer market competitive salaries and wages, generally targeting market median, to attract and retain qualified talent. Our compensation programs are designed to drive engagement and support business objectives through pay-for-performance and incentive opportunities that reward the achievement of operational and financial goals. As part of our ongoing efforts to monitor and maintain pay equity, we partner with advisory companies to conduct statistical pay analysis using industry best practices to ensure pay programs are administered equitably. We also use the services of independent compensation consulting firms to advise on matters including market competitiveness and program design.
In addition, we prioritize and invest in our associate’s health and welfare. Our “LiveWell” philosophy is based on a whole person approach to physical, fiscal, and emotional wellness tailored to the diverse needs of our global workforce in each country we operate. Examples include global Employee Assistance Programs, Headspace Mindfulness application, Cuckoo application, and Mental Health First Aiders training. Comprehensive health and welfare benefits for eligible associates are supplemented with specific programs to manage or improve common health conditions, a variety of voluntary benefits to satisfy individual needs, and paid time off.
Our commitment to the safety and health of our associates continues to be a top priority as demonstrated by our ongoing professional training and awareness campaigns. All Theatre Support Center and Theatre Leadership associates complete in-person and online courses focused on professionalism, safety, and security that meet or exceed regulatory requirements and best practices as determined by the Equal Employment Opportunities Commission (“EEOC”), Payment Card Industry (“PCI”), Securities and Exchange Commission (“SEC”), and Sarbanes-Oxley Act (“SOX”).
16
Available Information
We make available free of charge on our website (www.amctheatres.com) under “Investor Relations” / Financial Performance”/ “SEC Filings,” annual reports on Form 10-K, quarterly reports on Form 10-Q, current reports on Form 8-K, proxy materials on Schedule 14A and amendments to those reports as soon as reasonably practicable after we electronically file or furnish such materials with the Securities and Exchange Commission. The contents of our website are not incorporated into this report. The Securities and Exchange Commission maintains a website (www.sec.gov) that contains reports, proxy and information statements and other information about the Company.
Information about our Executive Officers
The following table sets forth certain information regarding our executive officers and key employees as of February 25, 2025:
Name |
|
Age |
|
Position(s) Held |
Adam M. Aron |
70 |
Chairman of the Board, Chief Executive Officer and President |
||
Sean D. Goodman |
59 |
Executive Vice President, International Operations, Chief Financial Officer and Treasurer |
||
Daniel Ellis |
56 |
Executive Vice President, Chief Operations and Development Officer |
||
Nikkole Denson-Randolph |
53 |
Senior Vice President, U.S. Chief Content Officer |
||
Ellen Copaken |
48 |
Senior Vice President, Marketing |
||
Kevin M. Connor* |
62 |
Senior Vice President, General Counsel and Secretary |
||
Chris A. Cox |
59 |
Senior Vice President, Chief Accounting Officer |
||
Carla C. Chavarria |
59 |
Senior Vice President, Chief Human Resources Officer |
*Kevin M. Connor will be leaving the Company as of March 13, 2025.
All our current executive officers hold their offices at the pleasure of our board of directors, subject to rights under their respective employment agreements in some cases. There are no family relationships between or among any executive officers.
Mr. Adam Aron has served as Chief Executive Officer, President and a director of the Company since January 2016, and as Chairman of the Board since July 2021. From February 2015 to December 2015, Mr. Aron was Chief Executive Officer of Starwood Hotels and Resorts Worldwide, Inc. and served on its board of directors from 2006 to 2015. Since 2006, Mr. Aron also has served as Chairman and Chief Executive Officer of World Leisure Partners, Inc., which he founded and which serves as a personal consultancy for matters related to travel and tourism, high-end real estate development, and professional sports. Mr. Aron served as Chief Executive Officer and Co-Owner of the Philadelphia 76ers from 2011 to 2013, and remained an investor in the team through early 2023. From 2006 to 2015, Mr. Aron served as Senior Operating Partner of Apollo Management L.P., a leading private equity investor. During the past ten years, Mr. Aron has previously served on the board of directors of Norwegian Cruise Line Holdings, Ltd., Centricus Acquisitions Corp, Prestige Cruise Holdings Inc., and HBSE (which is a private company that owns the NHL’s New Jersey Devils and the NBA’s Philadelphia 76ers). Mr. Aron received a Master’s of Business Administration degree with distinction from The Harvard Business School and a Bachelor of Arts degree cum laude from Harvard College. Mr. Aron brings to the Board significant business and executive leadership experience, including valuable insight into consumer services. In a variety of industries, he has more than 30 years of experience as a Chief Executive Officer, more than 35 years of experience as a corporate director, and more than 45 years of consumer-engagement experience.
Mr. Sean D. Goodman is AMC’s Executive Vice President, Chief Financial Officer and Treasurer. Mr. Goodman’s areas of responsibility at AMC include international operations, information technology, and procurement. Mr. Goodman has served on the Board of Directors of Hycroft Mining, Inc. as AMC’s representative since April 2022. Prior to joining AMC in December 2019, Mr. Goodman was the Chief Financial Officer of Fortune 500 retailer Asbury Automotive Group, Inc.. Earlier in his career, Mr. Goodman held Chief Financial Officer roles at Unifi, Inc. and Landis+Gyr, AG. In addition, Mr. Goodman served in strategy and finance leadership roles at Fortune 20 retailer The Home Depot, Inc. Mr. Goodman began his career as an investment banker with Morgan Stanley, Inc. and in various consulting and accounting positions with Deloitte LLP. Mr. Goodman has a Master’s of Business Administration degree from The Harvard Business School and a Bachelor of Business Science Degree (with honors) from the University of Cape Town in South Africa. Mr. Goodman is a certified public accountant.
17
Mr. Daniel Ellis has served as the Executive Vice President, Chief Operations and Development Officer since March 2022. From March 2020 to March 2022, he served as Senior Vice President Development & International. From December 21, 2016 to March 2020, he served as Senior Vice President, Domestic Development. From August 2011 until December 2016, Mr. Ellis was Senior Vice President, General Counsel and Secretary of Carmike Cinemas, Inc. From 1999 until 2011, Mr. Ellis served in several roles with Lodgian, Inc., including as President, Chief Executive Officer, and a member of the Board of Directors from 2009 through 2010 and Senior Vice-President, General Counsel and Secretary from 2002 through 2009. Prior to joining Lodgian, Mr. Ellis was engaged in private law practice and also served as an Assistant District Attorney for the State of Georgia. Mr. Ellis holds a Bachelor of Business Administration from Georgia Southern University, a Master’s of Business Administration from Mercer University, and a Juris Doctorate degree from the University of Mississippi.
Ms. Nikkole Denson-Randolph has served as AMC's Senior Vice President, U.S. Chief Content Officer since February 2025, overseeing AMC’s U.S. film programming, content acquisition, and movie strategy initiatives, along with AMC’s studio and creative community relationships. Prior to her current position, Ms. Denson-Randolph served as AMC’s Senior Vice President of Content Strategy & Inclusive Programming from 2020 to 2025, Vice President of Content Strategy & Inclusive Programming from 2018 to 2020, and Vice President, Alternative & Special Content from 2009 until 2018. Before joining AMC, Ms. Denson-Randolph served as the Director of Business Development for Starbucks Coffee Company’s entertainment group from 2004 to 2009. Ms. Denson-Randolph also previously served as President of Magic Johnson Entertainment and Vice President of Magic Johnson Enterprises. She earned her Bachelor of Arts from the University of California at Davis. In 1995, she obtained a Doctor of Jurisprudence from The University of San Francisco and has been a member of the California State Bar since 1996.
Ms. Ellen Copaken has served as Senior Vice President, Marketing of AMC since August 2023. Between February 2022 and August 2023, Ms. Copaken served as Vice President, Growth Strategy and led all aspects of AMC’s Perfectly Popcorn home popcorn product launch. Prior to joining AMC, Ms. Copaken served as Partner at global innovation consulting firm, Sterling Rice Group, where she led client relationships and growth strategy engagements in foodservice, retail, consumer package goods and hospitality industries. Previously, she worked in marketing leadership roles for Frito-Lay, PepsiCo and Hostess Brands in general management, innovation and brand management. During her time in the consumer-packaged goods industry, she launched dozens of new food and beverage products in grocery, retail and restaurant/foodservice. Ms. Copaken has a Bachelor of Arts from University of Pennsylvania and a Master’s of Business Administration from The Wharton School.
Mr. Kevin M. Connor has served as Senior Vice President, General Counsel and Secretary of AMC since April 2003. It has been announced that he will leave the Company on March 13, 2025. Prior to April 2003, Mr. Connor served as Senior Vice President, Legal beginning November 2002. Prior thereto, Mr. Connor was in private practice in Kansas City, Missouri as a partner with the firm Seigfreid Bingham, P.C. from October 1995. Mr. Connor holds a Bachelor of Arts degree in English and History from Vanderbilt University, a Juris Doctorate degree from the University of Kansas School of Law and LLM in Taxation from the University of Missouri-Kansas City.
Mr. Chris A. Cox has served as Senior Vice President, Chief Accounting Officer of AMC since June 2010. Prior thereto Mr. Cox served as Vice President and Chief Accounting Officer since May 2002. Prior to May 2002, Mr. Cox had served as Vice President and Controller since November 2000. Previously, Mr. Cox had served as Director of Corporate Accounting for the Dial Corporation from December 1999 until November 2000. Prior to Dial Corporation, Mr. Cox held various positions at PwC LLP. Mr. Cox holds a Bachelor of Business Administration in Accounting and Finance degree from the University of Iowa.
Ms. Carla C. Chavarria has served as Senior Vice President, Chief Human Resources Officer of AMC since January 2019 and Senior Vice President, Human Resources of AMC since January 2014. Ms. Chavarria served as Vice President, Human Resources Services from September 2006 to January 2014. Prior thereto, Ms. Chavarria served as Vice President, Recruitment and Development from April 2005 to September 2006. Ms. Chavarria’s prior experience includes human resources manager and director of employment practices. Ms. Chavarria holds a B.S. from The Pennsylvania State University.
Item 1A. Risk Factors.
The following is a summary list of risk factors:
18
Financial Risks
| ● | absent more normalized levels of attendance and revenues, our ability to obtain additional liquidity, which if not realized or is insufficient, likely would result in us seeking an in-court or out-of-court restructuring of our liabilities, and in the event of such future liquidation or bankruptcy proceeding, holders of our Common Stock and other securities would likely suffer a total loss of their investment; |
| ● | our substantial level of indebtedness and our current liquidity constraints could adversely affect our financial condition and our ability to service our indebtedness, to pre-pay debt, and to refinance debt and to do so with comparable interest rates or other favorable terms, and our ability to take advantage of certain business opportunities, which could negatively impact the ability of investors to recover their investment in our Common Stock; |
| ● | risks relating to impairment losses, including with respect to goodwill and other intangibles, and theatre and other closure charges; |
| ● | limitations on the availability of capital or poor financial results may prevent us from deploying strategic initiatives; and |
| ● | we are currently not paying dividends and in the future may not generate sufficient cash flows or have sufficient restricted payment capacity under the indentures governing our debt securities to pay dividends on our Common Stock. |
Operational Risks
| ● | risks relating to motion picture production and theatrical performance, including increases in alternative film delivery methods, including streaming services or other forms of entertainment; |
| ● | intense competition in the geographic areas in which we operate among exhibitors or from other forms of entertainment; |
| ● | our lack of control over distributors of films; |
| ● | shrinking exclusive theatrical release windows or release of movies to theatrical exhibition and streaming platforms on the same date, and the production and theatrical release of fewer movies as a consequence of labor stoppages, increased cost of production, decreased consumer demand, or changes in strategic focus of studios; |
| ● | failures, unavailability or security breaches of our information systems; |
| ● | dependence on key personnel for current and future performance and our ability to attract and retain senior executives and other key personnel, including in connection with any future acquisitions; |
| ● | supply chain disruptions, labor shortages, and inflation may negatively impact our operating results; |
| ● | our ability to achieve expected synergies, benefits and performance from our strategic theatre acquisitions and strategic initiatives; |
| ● | the availability and/or cost of energy in Europe may negatively impact our operating results; |
| ● | optimizing our theatre circuit through new construction and the transformation of our existing theatres may be subject to delay and unanticipated costs; |
| ● | the risk of severe weather events or other events caused by climate change disrupting or limiting operations; and |
| ● | incorporating AI technologies into some of our operations, which may present operational and reputational risks. |
Regulatory Risks
| ● | general and international economic, political, regulatory, social and financial market conditions, including potential economic recession, inflation, and other risks that may negatively impact the discretionary income of moviegoers and our operating revenues and attendance levels; |
| ● | increased costs in order to comply or resulting from a failure to comply with governmental regulation, including the GDPR and all other current and pending privacy and data regulations in the jurisdictions where we have operations; |
| ● | changes in tax rates, adoption of new tax legislation, and disagreements with tax authorities; |
19
| ● | legal regimes governing our international business operations could require insolvency proceedings; |
| ● | review by antitrust authorities in connection with acquisition opportunities; and |
| ● | the potential for political, social, or economic unrest, trade disputes, terrorism, hostilities, cyber-attacks or war, including the conflict between Russia and Ukraine and other international conflicts. |
Risks Related to our Shares
| ● | there has been significant recent dilution and there may continue to be additional future dilution of our Common Stock, which could adversely affect the market price of shares of our Common Stock; |
| ● | the market prices and trading volumes of our shares of Common Stock have experienced, and may continue to experience, extreme volatility, which could cause purchasers of our Common Stock to incur substantial losses; |
| ● | the market price of our Common Stock and our business may be materially adversely affected by the Noteholder Action and related claims; |
| ● | the risk of a “short squeeze” due to a sudden increase in demand for shares of our Common Stock that largely exceeds supply and/or focused investor trading in anticipation of a potential short squeeze has led to, may be currently leading to, and could again lead to, extreme price volatility in shares of our Common Stock; |
| ● | there is no guarantee that our retail stockholders will continue to support AMC in the future, and negative sentiment among AMC’s retail stockholder base in the future could have a material adverse impact on the market price of the Common Stock and investor’s investment therein; |
| ● | information available in public media that is published by third parties, including blogs, articles, online forums, message boards and social and other media may include statements not attributable to the Company and may not be reliable or accurate; |
| ● | future offerings of debt, which would be senior to our Common Stock upon liquidation, and/or other preferred equity securities, which may be senior to our Common Stock for purposes of distributions or upon liquidation, could adversely affect the market price of our Common Stock; |
| ● | anti-takeover protections in our certificate of incorporation and our bylaws may discourage or prevent a takeover of our Company, even if an acquisition would be beneficial to our stockholders; |
| ● | an issuance of preferred stock, including the Series A Convertible Participating Preferred Stock, could dilute the voting power of the common stockholders and adversely affect the market value of our Common Stock; and |
| ● | increases in market interest rates may cause potential investors to seek higher returns and therefore reduce demand for our Common Stock, which could result in a decline in the market price of our Common Stock. |
Financial Risks
In the absence of significant increases in revenues and attendance from current levels, or obtaining significant additional sources of liquidity, an investment in our Common Stock is highly speculative; holders of our Common Stock could suffer a total loss of their investment.
To remain viable beyond the next twelve months, the Company is expected to require additional sources of liquidity and/or significant increases in revenues and attendance levels, see Liquidity and Capital Resources—For the Year Ended December 31, 2024 Compared to the Year Ended December 31, 2023 included in Part II, Item 7 of this Form 10-K for further information regarding revenue and attendance assumptions. The required amounts of additional liquidity may be material. Although the Company believes that cash flow from operations will be sufficient to meet its material cash requirements over the next twelve months, it is actively continuing to explore additional sources of liquidity. The Company is unable to determine at this time whether any additional sources of liquidity will be available to it or if available, individually or taken together, will be sufficient to address its potential liquidity needs. There is significant uncertainty as to whether these potential sources of liquidity will be realized or that they will be sufficient to generate the material amounts of additional liquidity that may be required until the Company is able to achieve improved levels of attendance and revenues. Any individual source of liquidity that the Company is pursuing may not be sufficient to address all the Company’s future liquidity requirements, and even if all of the potential sources of liquidity that the Company is pursuing are available, they may not be sufficient to address the Company’s liquidity requirements. Further, any relief provided by lenders, governmental agencies, and business
20
partners may not be adequate and may include onerous terms, scheduled film releases may fail to drive increased revenues and attendance, scheduled releases may be postponed or moved to the home video market, or the attendance levels of, and revenues generated by, our theatres may improve at a level that will not support our substantial amount of indebtedness, rent liabilities or other obligations. Due to these factors, if the Company is unable to obtain the necessary additional sources of liquidity, an investment in our Common Stock is highly speculative.
Significant impacts on our business caused by changes in the film exhibition industry during the course of and after the COVID-19 pandemic include, and are likely to continue to include, among others: (1) decreased attendance at our theatres, including due to changes in consumer behavior in favor of viewing feature-length movies at home on directly to video streaming or PVOD platforms or spending on alternative forms of entertainment, (2) our inability to generate significant cash flow from operations if our theatres continue to operate at significantly lower than historical levels, which could lead to a need to raise additional capital to bolster our liquidity and (3) our inability to service our existing and future indebtedness or other liabilities.
Work stoppages by the Writers Guild of America and Screen Actors Guild–American Federation of Television and Radio Artists during 2023 also had an impact upon the production pipeline for theatrical releases by most studios. The new collective bargaining agreements with these labor unions may lead to increased costs to create content, which could cause studios to demand greater fees for the exhibition of their motion pictures, or further reduce the amount of future theatrical releases.
In the event the Company’s revenues do not increase to at least pre-COVID-19 levels, we would seek to negotiate with creditors changes to our balance sheet liabilities and continue to take steps to reach agreements with our landlords to reduce or abate our rent obligations. Ultimately, if revenues do not improve and we are unsuccessful in restructuring our liabilities, we would face the risk of a future liquidation or bankruptcy proceeding, in which case holders of the Company’s Common Stock would likely suffer a total loss of their investment.
Our substantial level of indebtedness and liquidity constraints could adversely affect our financial condition and our ability to service our indebtedness, which could negatively impact an investor’s ability to recover their investments in the Common Stock.
We have a substantial amount of indebtedness, which requires significant interest payments. As of December 31, 2024, the carrying value of our corporate borrowings and finance lease obligations were $4,075.1 million ($4,134.5 million aggregate principal amount) and $49.3 million, respectively. As of December 31, 2024, we also had approximately $4.2 billion of discounted rental payments under operating leases (with a weighted average remaining lease term of 8.1 years).
Our substantial level of indebtedness and the current constraints on our liquidity could have important consequences, including the following:
| ● | we must use a substantial portion of our cash flow from operations to pay interest and principal on our indebtedness, which reduces or will reduce funds available to us for other purposes such as working capital, capital expenditures, other general corporate purposes and potential acquisitions; |
| ● | our ability to refinance such indebtedness or to obtain additional financing for working capital, capital expenditures, acquisitions or general corporate purposes may be impaired; |
| ● | we are exposed to fluctuations in interest rates because our term loans have variable rates of interest; |
| ● | our leverage may be greater than that of some of our competitors, which may put us at a competitive disadvantage and reduce our flexibility in responding to current and changing industry and financial market conditions; |
| ● | there are significant constraints on our ability to incur additional debt; and |
| ● | we may be more vulnerable to economic downturn and adverse developments in our business. |
We and our subsidiaries may be able to incur additional indebtedness in the future, subject to the restrictions and compliance obligations contained in the agreements governing our indebtedness. To the extent new indebtedness is added to our debt levels, including as a result of satisfying interest payment obligations on certain of our indebtedness with payments-in-kind, the related risks that we now face could intensify.
21
Our ability to meet our expenses, to remain in compliance with our covenants under our debt instruments and to make future principal and interest payments in respect of our debt depends on, among other factors, our operating performance, competitive developments and financial market conditions, all of which are significantly affected by financial, business, economic and other factors outside of our control. A failure to comply with our covenants or to make required payments under one debt instrument could trigger cross-default provisions under other debt agreements, potentially accelerating the repayment of a significant portion of our outstanding debt. Given current industry and economic conditions, our cash flow may not be sufficient to allow us to pay principal and interest on our debt and meet our other obligations.
To the extent our relationship with lenders is negatively affected by disputes that may arise from time to time, it may be more difficult to seek covenant relief, if needed, or to raise additional funds in the future.
We may incur future impairment charges to goodwill, other intangibles, or long-lived assets and future theatre and other closure charges.
We have a significant amount of goodwill on our balance sheet as a result of acquisitions. As of December 31, 2024, goodwill recorded on our consolidated balance sheet totaled $2,301.1 million. If the market price of our Common Stock declines, if the fair value of our debt declines, or if other events or circumstances change that would more likely than not reduce the fair value of our reporting units below their respective carrying value, all or a portion of our goodwill may be impaired in future periods.
We review long-lived assets, goodwill, indefinite-lived intangible assets and other intangible assets and theatre assets whenever events or changes in circumstances indicate that the carrying amount of the assets may not be fully recoverable. The review for goodwill compares the fair value for each of our reporting units to their associated carrying value. Factors that could lead to impairment of goodwill and intangible assets include adverse industry or economic trends, reduced estimates of future cash flows, and declines in the market price of our Common Stock or declines in the fair value of our debt. Our valuation methodology for assessing impairment requires management to make judgments and assumptions based on historical experience and projections of future operating performance, including estimating the fair value of our corporate borrowings and finance lease liabilities. We may be required to record future charges to earnings during the period in which an impairment of goodwill or intangible assets is determined to exist. During the years ended December 31, 2024, December 31, 2023, and December 31, 2022, we recorded impairment of long-lived asset charges of $72.3 million, $106.9 million, and $133.1 million, respectively. The assets impaired during year 2024 included 39 theatres in the U.S. markets with 469 screens and 23 theatres in the International markets with 188 screens. We did not record any goodwill non-cash impairment charges during the years ended December 31, 2024, December 31, 2023, and December 31, 2022 as we determined it was not more likely than not that the fair value of our reporting units was below their respective carrying values.
Limitations on the availability of capital and reductions to capital expenditures may delay or prevent deployment of strategic initiatives.
Implementation of our key strategic initiatives, including premium sight and sound, other upgrades to auditoriums, and food and beverage enhancements require significant capital expenditures. Our gross capital expenditures were approximately $245.5 million, $225.6 million, and $202.0 million for the years ended December 31, 2024, December 31, 2023 and December 31, 2022, respectively. We estimate that our cash outflows for capital expenditures, net of landlord contributions, will be approximately $175 million to $225 million for the year ending December 31, 2025 to maintain and enhance operations. A lack of available capital resources due to business performance or other financial commitments could prevent or delay the deployment of innovations in our theatres. We may reduce capital expenditures significantly or seek additional financing or issue additional securities, which may affect the timing and scope of growth strategy. We cannot be certain that we will be able to obtain new financing on favorable terms, or at all. In addition, covenants under our existing indebtedness limit our ability to incur additional indebtedness, and the performance of any additional or improved theatres may not be sufficient to service the related indebtedness that we are permitted to incur.
22
We are currently not paying dividends and in the future may not generate sufficient cash flows or have sufficient restricted payment capacity under our New Term Loan Credit Agreement or the indentures governing our debt securities to pay dividends on our Common Stock.
We are currently not paying a cash dividend. We are only able to pay dividends from our available cash on hand and funds received from our subsidiaries. Our subsidiaries’ ability to make distributions to us will depend on their ability to generate substantial operating cash flow. Our ability to pay dividends to our stockholders in the future is subject to the terms of our New Term Loan Credit Agreement and the indentures governing our indebtedness. Our operating cash flow and ability to comply with restricted payment covenants in our debt instruments will depend on our future performance, which will be subject to prevailing economic conditions and to financial, business and other factors beyond our control. In addition, dividend payments are not mandatory or guaranteed, and our board of directors may determine not to resume the payment of dividends. We may not pay dividends as a result of the following additional factors, among others:
| ● | we are not legally or contractually required to pay dividends; |
| ● | even if we determine to resume paying cash dividends, the actual amount of dividends distributed and the decision to make any distribution is entirely at the discretion of our board of directors and future dividends, if any, will depend on, among other things, our results of operations, cash requirements, financial condition, business opportunities, provisions of applicable law and other factors that our board of directors may deem relevant; |
| ● | the inability to deduct all or significant portions of our interest expense for tax purposes, will ultimately increase the need to generate revenues to support our capital structure; |
| ● | the amount of dividends distributed is and will be subject to contractual restrictions under the restrictive payment covenants contained in the New Term Loan Credit Agreement, the indentures governing our debt securities and the terms of any other outstanding or future indebtedness incurred by us or any of our subsidiaries; and |
| ● | the amount of dividends distributed is subject to state law restrictions. |
Operational Risks
Our business depends on motion picture production and performance and is subject to intense competition, including increases in alternative film delivery methods or other forms of entertainment.
Our ability to operate successfully depends upon the availability, diversity and appeal of motion pictures, our ability to license motion pictures and the performance of such motion pictures in our markets. The most attended films are usually released during the summer and the calendar year-end holidays, making our business seasonal. We primarily license first-run motion pictures, the success of which has increasingly depended on the marketing efforts of the major motion picture studios and the duration of the exclusive theatrical release windows. Poor performance of, or any disruption in the production of these motion pictures (including by reason of a strike or lack of adequate financing), a reduction in, or suspension of, the marketing efforts of the major motion picture studios, the choice by distributors to release fewer feature-length movies theatrically, or the choice to release feature-length movies directly to video streaming or PVOD platforms, either in lieu of or on the same date as a theatrical release, could hurt our business and results of operations. Conversely, the successful performance of these motion pictures, particularly the sustained success of any one motion picture, or an increase in effective marketing efforts of the major motion picture studios and extension of the exclusive theatrical release windows, may generate positive results for our business and operations in a specific fiscal quarter or year that may not necessarily be indicative of, or comparable to, future results of operations. As movie studios rely on a smaller number of higher grossing “tent pole” films there may be increased pressure for higher film licensing fees. Our loyalty program and certain promotional pricing also may affect performance and increase the cost to license motion pictures relative to revenue for admission. In addition, a change in the type and breadth of movies offered by motion picture studios and the theatrical exclusive release window may adversely affect the demographic base of movie-goers.
Motion picture production is highly dependent on labor that is subject to various collective bargaining agreements. Studios are party to collective bargaining agreements with a number of labor unions, and failure to reach timely agreements or renewals of existing agreements, may further affect the production and supply of theatrical motion picture content. Use of artificial intelligence (“AI”) technology in the filmmaking process has been a significant issue in
23
recent negotiations between the film studios that supply the movies we exhibit and the various labor unions involved in the filmmaking process, including the writers and screen actors guilds. If studios and labor unions are unable to agree on the parameters of AI technology utilization in the filmmaking process, it could negatively impact the supply of movies available for exhibition in our theatres. Additionally, audience acceptance of movies made utilizing AI technology is not known.
Our theatres are subject to varying degrees of competition in the geographic areas in which we operate. Competitors may be multi-national circuits, national circuits, regional circuits or smaller independent exhibitors. Competition among theatre exhibition companies is often intense with respect to attracting patrons, terms for licensing of motion pictures and availability and securing and maintaining desirable locations.
We also compete with other film and content delivery methods, including video streaming, network, syndicated cable and satellite television, as well as video-on-demand, pay-per-view services, subscription streaming services, and social media platforms. We also compete for the public’s leisure time and disposable income with other forms of entertainment, including sporting events, video gaming, social media, amusement parks, live music concerts, live theatre, and restaurants. In addition, new technology, including generative AI, is evolving rapidly and our ability to compete could be adversely affected if our competitors gain an advantage by using such technologies. An increase in the popularity of these alternative film delivery methods and other forms of entertainment could reduce attendance at our theatres, limit the prices we can charge for admission and materially adversely affect our business and results of operations.
We rely on distributors of motion pictures, over whom we have no control, for the films that we exhibit, and our business may be adversely affected if our access to motion pictures is limited or delayed.
Our business depends on maintaining good relations with these distributors, as this affects our ability to negotiate commercially favorable licensing terms for first-run films or to obtain licenses at all. With only seven movie studio distributors representing approximately 84% of our U.S. markets’ box office revenues in 2024 and five movie studio distributors representing approximately 74% of our International markets’ box office revenues in 2024, there is a high level of concentration and continued consolidation in the industry. Our business may be adversely affected if our access to motion pictures is limited or delayed because of deterioration in our relationships with one or more distributors or for some other reason. To the extent that we are unable to license a popular film for exhibition in our theatres, our operating results may be adversely affected.
Our results of operations will be impacted by shrinking theatrical exclusive release windows and other practices adopted by movie studies.
Over the last decade, the average theatrical exclusive release window, which represents the time that elapses from the date of a film’s theatrical release to the date a film is available to consumers in-home, has decreased from approximately four months to approximately one-and-one half months. Additionally, certain movie studios have adopted strategies that have eliminated the theatrical exclusive release window completely. These practices have significantly impacted our revenues and are expected to continue to have an adverse impact on our business and results of operations going forward.
We rely on our information systems to conduct our business, and any failure to protect these systems against security breaches or failure of these systems themselves could adversely affect our business, results of operations and liquidity and could result in litigation and penalties. Additionally, if these systems fail or become unavailable for any significant period of time, our business could be harmed.
Potential cybersecurity incidents could interfere with our business and operations. Computer hacking, installation of malware, installation of ransomware, generative AI impersonation, phishing, and spamming attacks against online networking platforms have become more prevalent and more sophisticated. Though it is difficult to determine what, if any, harm may directly result from any specific attack or interruption, such events could also be expensive to remedy, harm our reputation or brands, lead users to lose trust and confidence in our business, and/or result in costly fines, penalties, and costly remediation requirements. We, and others on our behalf, also store “personally identifiable information” (“PII”) with respect to employees, vendors, customers, and others. We and our third-party vendors have been subject to, and will likely continue to be subject to, attempts to gain unauthorized access to our and their information systems. None of these attempts has individually or in the aggregate resulted in a cybersecurity incident with a material impact on our financial condition or results of operations. While we have implemented
24
safeguards to protect the privacy of PII, there is still a risk of a material cybersecurity incident where hackers or others might obtain information, which could result in potentially costly remedial action, as well as potential fines, penalties, lawsuits, and reputational damage. The rapid evolution and increased adoption of AI technologies may also heighten our cybersecurity risks by making cyber-attacks more difficult to detect, contain, and mitigate. Attackers are also increasingly sophisticated and using techniques and tools, including AI, that can circumvent security controls, evade detection and remove forensic evidence. As a result, we may be unable to detect, investigate, remediate or recover from future attacks or incidents, or to avoid a material adverse impact to our systems, information, or business. Additionally, integrating AI into our operations may increase our cybersecurity and data privacy risks.
Furthermore, we rely on our information systems and those of third parties for storing proprietary company information about our products and intellectual property, as well as for processing patron purchases, loyalty program activity, supporting accounting functions and financial statement preparation, paying our employees, and otherwise running our business. The rapid evolution and increased adoption of AI technologies may intensify our and our service providers’ cybersecurity risks. In addition, we may need to enhance our information systems to provide additional capabilities and functionality. The implementation of new information systems and enhancements is frequently disruptive to the underlying business of an enterprise. Any disruptions affecting our ability to accurately report our financial performance on a timely basis could adversely affect our business in a number of respects. If we are unable to successfully implement potential future system enhancements, our financial position, results of operations, and cash flows could be negatively impacted.
We depend on key personnel for our current and future performance.
Our current and future performance depends to a significant degree upon the retention of our senior management team and other key personnel. The loss or unavailability of any member of our senior management team or a key employee could have a material adverse effect on our business, financial condition, and results of operations. We cannot give assurance that we would be able to locate or employ qualified replacements for senior management or key employees on acceptable terms.
Supply chain disruptions, labor shortages, and inflation may negatively impact our operations and operating results.
We rely on a limited number of suppliers for certain products, supplies and services, including a single U.S. vendor for the warehousing and distribution of most of the products and supplies for our U.S. food and beverage operations. Shortages, delays, or interruptions in the availability of food and beverage items and other supplies to our theatres may be caused by commodity availability; public health crises or pandemics, including resulting lockdowns in areas where goods are manufactured; social or economic unrest, terrorism, hostilities, cyber-attacks or war, including the conflict between Russia and Ukraine and the potential impact of financial and economic sanctions on the regional and global economy; labor issues or other operational disruptions; the inability of our suppliers to manage adverse business conditions, obtain credit or remain solvent; adverse weather conditions; natural disasters; governmental regulation; recalls; or other conditions beyond our control. Such shortages, delays or interruptions could adversely affect the availability, quality, and cost of the items we buy and the operations of our business. Supply chain risk could increase our costs and limit the availability of products that are critical to our operations. If we raise prices in response to increased costs or shortages, it may negatively impact our sales. If we temporarily remove popular food and beverage options without comparable alternatives, we may experience a reduction in sales during the time affected by the shortage or thereafter if our guests change their purchasing habits.
The success of our business depends on our ability to recruit and retain staff members for our theatres. Without proper staffing, wait times to buy tickets and food and beverage are extended and operating hours may be reduced. These conditions may result in a poor guest experience, perhaps causing them to not return in the future. These labor shortages have also required us to raise wages to be competitive in the available workforce.
In addition, we are dependent upon natural gas and electricity to operate our theatres. The cost of natural gas and electricity may fluctuate widely due to economic and political conditions, government policy and regulations, trade disputes, war, or other unforeseen circumstances. Substantial future increases in prices, including the availability and/or cost of energy in Europe, for, or shortages of, natural gas and electricity could have a negative effect on our profitability. There can be no assurance that we can cover these potential cost increases through future pricing actions.
In an inflationary environment, such as the current economic environment, depending on the market conditions in each region or country, we may be unable to raise the prices of our movie tickets or food and beverage products
25
enough to keep up with the rate of inflation, which would reduce our profitability, and continued inflationary pressures could impact our business, financial condition, and results of operations.
Optimizing our theatre circuit through new construction and the transformation of our existing theatres may be subject to delay and unanticipated costs.
The availability of attractive site locations for new construction is subject to various factors that are beyond our control. These factors include:
| ● | local conditions, such as scarcity of space or increase in demand for real estate, demographic changes and changes in zoning and tax laws; and |
| ● | competition for site locations from both theatre companies and other businesses. |
We typically require 18 to 24 months in the United States from the time we reach an agreement with a landlord to when a theatre opens. This timeframe may vary in International markets.
In addition, the improvement of our existing theatres through our enhanced food and beverage offerings, recliner seating, and premium sight and sound initiatives is subject to substantial risks, such as difficulty in obtaining permits, landlord approvals and operating licenses (e.g., liquor licenses). We may also experience cost overruns from delays or other unanticipated costs in both new construction and facility improvements. Furthermore, our new sites and transformed locations may not perform to our expectations.
Climate change, adverse weather conditions and natural disasters could adversely affect our theatre operations, sales or financial results.
Climate change and natural disasters may adversely affect our ability to keep movie theatres open and operational in affected regions and consumer ability to travel to our theatres if they are open. Relative to normal weather conditions, extended severe weather as a result of climate change can close theatres for days due to pervasive power outages, flooding, or wildfires. These severe weather events can also result in delays in the construction of new theatres, interruptions to the availability or increases in the cost of utilities, and shortages in the supply, or increases in the costs of concessions and other supplies required for operations. Additionally, the seasonal timing of severe weather patterns tends to mimic the fluctuation of our sales. With our busy season being around the winter holidays and in the summer, the risk is even greater for extended severe winter storms and increased hurricanes and tornadoes in the summer months. Further, natural disasters can impact the production of the films we show at our theatres, potentially causing delays in release schedules.
We are incorporating AI technologies into some of our operations, which may present operational and reputational risks.
We have incorporated and intend to continue to incorporate AI technologies, including generative AI (a subset of AI), into our operations. For example, we currently utilize AI to provide our guests better film recommendations and AI chatbots to improve customer service. We plan to utilize AI to optimize internal software applications, marketing automation, and film booking. As with many innovations, AI presents risks and challenges that could adversely impact our business. AI technologies can create accuracy issues, unintended biases, and discriminatory outcomes, or may create content that appears correct but is inaccurate or flawed. If the recommendations, content, or analyses that AI applications produce are or are alleged to be deficient or inaccurate, we could be subjected to competitive harm, potential legal liability, and brand or reputational harm. The legal and regulatory landscape surrounding AI technologies is rapidly evolving and uncertain, including in the areas of intellectual property, cybersecurity, and privacy and data protection. For example, there is uncertainty around the validity and enforceability of intellectual property rights related to the use, development, and deployment of AI technologies. Compliance with new or changing laws, regulations or industry standards relating to AI may impose significant operational costs and may limit our ability to develop, deploy or use AI technologies. There can be no assurance that the measures we have taken to mitigate the potential risks related to AI, including but not limited to generative AI, will be sufficient. Failure to appropriately respond to this evolving landscape may result in legal liability, regulatory action, or brand and reputational harm.
26
Regulatory Risks
General political, social and economic conditions can reduce our operating revenues and attendance.
Our success depends on general political, social, and economic conditions and the willingness of consumers to spend money at movie theatres. If going to motion pictures becomes less popular or consumers spend less on food and beverage, our operations could be adversely affected. In addition, our operations could be adversely affected if consumers’ discretionary income falls as a result of an economic downturn. Geopolitical events, including the threat of regional war, terrorism or cyber-attacks, or widespread health emergencies, such as pandemics or epidemics, could cause people to avoid our theatres or other public places where large crowds are in attendance. In addition, due to our concentration in certain markets, natural disasters such as hurricanes or earthquakes in those markets could adversely affect our overall results of operations.
We are subject to substantial government regulation, which could entail significant cost.
We are subject to various federal, state and local laws, regulations and administrative practices both domestically and internationally affecting our business, and we must comply with provisions regulating antitrust, customary health and sanitation standards, equal employment, environmental, licensing for the sale of food and, in some theatres, alcoholic beverages, and data protection and privacy laws, including GDPR, and all other current and pending privacy and data regulations in the jurisdictions where we have operations. Our new theatre openings could be delayed or prevented or our existing theatres could be impacted by difficulties or failures in our ability to obtain or maintain required approvals or licenses. Changes in existing laws or implementation of new laws, regulations and practices could have a significant impact on our business. A significant portion of our theatre level employees are part-time workers who are paid at or near the applicable minimum wage in the theatre’s jurisdiction. Increases in the minimum wage and implementation of reforms requiring the provision of additional benefits will increase our labor costs.
We own and operate facilities throughout the United States and various international markets throughout Europe and are subject to the environmental laws and regulations of those jurisdictions, particularly laws governing the cleanup of hazardous materials and the management of properties. We might in the future be required to participate in the cleanup of a property that we own or lease, or at which we have been alleged to have disposed of hazardous materials from one of our facilities. In certain circumstances, we might be solely responsible for any such liability under environmental laws, and such claims could be material. Additionally, there are multiple sustainability and ESG disclosure regulations taking effect in the next several years in the United States and Europe including the California Climate Accountability Package, the Corporate Sustainability Reporting Directive, and numerous city, county, and state regulations covering commercial building energy usage and emissions. Costs and operational impacts are unknown at this time, but noncompliance with these regulations could carry financial, operational and reputational risks.
In the United States, our theatres must comply with Title III of the ADA. Compliance with the ADA requires that public accommodations, including websites and mobile apps for such public accommodations, “reasonably accommodate” individuals with disabilities and that new construction or alterations made to “commercial facilities” conform to accessibility guidelines unless “structurally impracticable” for new construction or technically infeasible for alterations. Non-compliance with the ADA could result in the imposition of injunctive relief, fines, and an award of damages to private litigants or additional capital expenditures to remedy such non-compliance, any of which could have a material adverse effect on our operations and financial condition. In Europe, all territories have similar national regulations relating to disabilities that our theatres operate in accordance with. Noncompliance with these regulations could carry financial, operational and reputation risks.
We are subject to complex taxation, changes in tax rates, adoption of new United States, European Union or international tax legislation and disagreements with tax authorities that could adversely affect our business, financial condition or results of operations.
We are subject to many different forms of taxation in both the United States and in foreign jurisdictions where we operate. Current economic and political conditions make compliance with domestic and international tax and transfer pricing laws and regulations, including in the United States, United Kingdom, and European Union subject to ongoing change. The cost of compliance is high and likely to increase in the future. Any failure on our part to comply with these laws and regulations can result in negative publicity and diversion of management time and effort and could subject us to significant liabilities and other penalties.
27
The legal regimes governing our international business operations could require our international subsidiaries or their directors to pursue insolvency proceedings.
The legal regimes governing certain of our international subsidiaries (including Germany, Spain, Portugal, Norway and Sweden) impose on directors an obligation to pursue insolvency proceedings in certain circumstances. There are various potential triggers including illiquidity, over-indebtedness and inadequate capitalization. If our international subsidiaries were required to (and did) pursue insolvency proceedings, that could in turn trigger events of default under our international senior secured notes and/or have other material adverse effects on our business and financial position, including additional insolvency proceedings.
We may be reviewed by antitrust authorities.
Given our size and market share, pursuit of acquisition opportunities that would increase the number of our theatres in markets where we have a leading market share would likely result in significant review by antitrust regulators in the applicable jurisdictions, and we may be required to dispose of theatres in order to complete such acquisition opportunities. As a result, we may not be able to succeed in acquiring other exhibition companies or we may have to dispose of a significant number of theatres in key markets in order to complete such acquisitions.
We operate in a consolidating industry that is scrutinized from time to time for compliance with antitrust and competition laws, including currently dormant investigations into film clearances and joint ventures among competing exhibitors. If we were found to have violated antitrust laws, it could have a material adverse effect on our operations and financial condition.
Our business is subject to international economic, political and other risks that could negatively affect our business, results of operations and financial condition.
As a result of our international operations, 23.6% of our revenues were derived from countries outside the United States for the year ended December 31, 2024. The success of our international operations is subject to risks that are beyond our control. Accordingly, our business is subject to risks associated with doing business internationally, including:
| ● | difficulties and costs of staffing and managing international operations among diverse geographies, languages and cultures; |
| ● | the impact of regional or country-specific business cycles and economic instability; |
| ● | the potential for political, social, or economic unrest, trade disputes, terrorism, hostilities, cyber-attacks or war, including the conflict between Russia and Ukraine and other international conflicts, and adverse changes in political or economic relations with the United States; |
| ● | fluctuations in foreign currency exchange rates which could lead to fluctuations in our reported results of operations or result in significant decreases in the value of our international investments as denominated in U.S. Dollars; |
| ● | increased foreign interest rates, foreign exchange fees and other bank charges as a result of financing our foreign operations; |
| ● | exposure to anti-corruption laws, including the Foreign Corrupt Practices Act (“FCPA”) and the U.K. Bribery Act (the “Bribery Act”), and export-control regulations and economic sanctions regulations, including those promulgated by the Office of Foreign Assets Control, United States Department of Treasury (“OFAC”); |
| ● | exposure to local economic conditions, labor and employment conditions, and local laws and regulations, including data privacy laws, tariffs, or other trade barriers; |
| ● | difficulty in protecting our brand, reputation and intellectual property; and |
| ● | restrictions on the ability to obtain or retain licenses required for operation. |
If we are unable to manage the complexity of our global operations successfully, it could have a material adverse effect on our business, financial condition and results of operations.
28
Risk Related to our Share Issuances
There has been significant recent dilution and there may continue to be additional future dilution of our Common Stock, which could adversely affect the market price of shares of our Common Stock.
From January 1, 2020 through February 18, 2025, the outstanding shares of our Common Stock have increased by 426,741,792 shares (on a Reverse Stock Split adjusted basis) in a combination of at-the-market sales, forward sales, conversion of Series A Convertible Participating Preferred Stock, shareholder litigation settlement, conversion of Class B common stock, conversion of notes, exchanges of notes, transaction fee payments, and equity grant vesting. On March 14, 2023, the Company held a special meeting of our stockholders and obtained the requisite stockholder approval for the Charter Amendments (as defined herein) and on August 14, 2023, we filed the amendment to our Certificate of Incorporation implementing the Charter Amendments effective as of August 24, 2023. In accordance with the Charter Amendments, we increased the total number of authorized shares of Common Stock from 524,173,073 to 550,000,000 shares of Common Stock and effectuated a reverse stock split at a ratio of one share of Common Stock for every ten shares of Common Stock outstanding (the “Reverse Stock Split”). In accordance with the terms of the Certificate of Designations governing the Series A Convertible Participating Preferred Stock, following the effectiveness of the Charter Amendments all outstanding shares of our Series A Convertible Participating Preferred Stock converted into 99,540,642 shares of Common Stock.
On July 22, 2024, the Company and certain of its subsidiaries consummated a series of refinancing transactions (the “Refinancing Transactions”) with certain lenders under the Company’s existing senior secured term loans maturing 2026 (the “Existing Term Loans”) and certain holders of its 10%/12% Cash/PIK Toggle Second Lien Subordinated Notes due 2026 (the “Second Lien Notes”). As a part of the Refinancing Transactions, and certain subsequent open-market purchases of Existing Term Loans, the Company repurchased and/or exchanged all of its Existing Term Loans for new terms loans maturing in 2029 and repurchased $414.4 million of its Second Lien Notes. In connection with the Refinancing Transactions, Muvico, LLC, a newly formed wholly-owned subsidiary of the Company, issued $414.4 million aggregate principal amount of Exchangeable Notes that are exchangeable into shares of Common Stock.
If the outstanding Exchangeable Notes were converted fully into shares of our Common Stock as of the date hereof, they would be converted into an aggregate of 85,242,067 shares of Common Stock. If the outstanding Exchangeable Notes were converted fully into shares of our Common Stock at maturity, and we were to elect to issue additional Exchangeable Notes as interest paid-in-kind (“PIK Notes”) on such outstanding Exchangeable Notes and PIK Notes to the full extent permitted during the life of the Exchangeable Notes (without regard to any limitations on our authorized share capital or on the conversion therein and giving effect to the changes in the applicable make-whole fee over the period), such Exchangeable Notes (including PIK Notes) would be convertible at maturity into an aggregate of 115,158,375 shares of Common Stock. In addition, the indenture governing the Exchangeable Notes permits the issuance of up to an additional $50.0 million principal amount of Exchangeable Notes. If such Exchangeable Notes were issued (subject to any then limitations on authorized shares), these Exchangeable Notes and any PIK Notes relating thereto would also be convertible into additional shares of our Common Stock.
As of February 18, 2025, there were 431,949,800 shares of Common Stock issued and outstanding.
We have approximately 1,070,547 authorized shares of Common Stock remaining that have not been issued or reserved for issuance in connection with our employee stock based compensation plans or upon conversion of our outstanding Exchangeable Notes (including PIK Notes that were issued on the first interest payment date thereon and anticipated PIK Note issuances through December 15, 2025). As a result, we may in the future seek to obtain the requisite stockholder approval for the authorization of an additional number of authorized and unissued and unreserved shares of Common Stock, which may be used for at-the-market sales, exchanges of notes, private placement transactions, equity grant vesting and other dilutive issuances. Subject to any required stockholder authorization of additional Common Stock, we would expect to issue additional shares of Common Stock to raise cash to bolster our liquidity, to repay, refinance, redeem or exchange indebtedness (including expenses, accrued interest and premium, if any), for working capital, to finance strategic initiatives and future acquisitions, to settle conversion of the Exchangeable Notes, including any PIK Notes, or for other purposes. We may also issue preferred equity securities or securities convertible into, or exchangeable for, or that represent the right to receive, shares of Common Stock or acquire interests in other companies, or other assets by using a combination of cash and shares of Common Stock, or just shares of Common Stock. Additionally, vesting of outstanding awards pursuant to our current and legacy equity compensation programs results in the issuance of new shares of Common Stock, net of any shares withheld to cover tax withholding
29
obligations upon vesting. Any of these events may significantly dilute the ownership interests of current stockholders, reduce our earnings per share or have an adverse effect on the price of our shares of Common Stock.
If we were to seek but not obtain the requisite stockholder approval to increase our authorized shares, this could create substantial risks, which could have an adverse effect on the market price of our Common Stock, including that:
| ● | we will be limited in our ability to issue equity to bolster our liquidity and respond to future challenges, including if revenues and attendance levels do not increase; |
| ● | for future financing, we may be required to issue additional debt, which may be unavailable on favorable terms or at all, and which would exacerbate the challenges created by our high leverage; and |
| ● | we may be unable to issue currency in strategic transactions, including acquisitions, joint ventures or in connection with landlord negotiations, which may prevent us from entering into transactions that could increase shareholder value. |
The market price and trading volume of our shares of Common Stock have experienced, and may continue to experience, extreme volatility, which could cause purchasers of our Common Stock to incur substantial losses.
The market prices and trading volume of our shares of Common Stock have experienced, and may continue to experience, extreme volatility, which could cause purchasers of our Common Stock to incur substantial losses. For example, during 2024 through February 24, 2025, the market price of our Common Stock has fluctuated from an intra-day low of $2.38 per share on April 16, 2024 to an intra-day high on the NYSE of $11.88 on May 14, 2024. The last reported sale price of our Common Stock on the NYSE on February 24, 2025 was $3.36 per share. During 2024 through February 24, 2025, daily trading volume ranged from approximately 3,755,000 to 634,246,600 shares.
We believe that the volatility and our market prices have reflected and may continue to reflect market and trading dynamics unrelated to our underlying business, or macro or industry fundamentals, and we do not know how long these dynamics will last.
Extreme fluctuations in the market price of our Common Stock have been accompanied by reports of strong and atypical retail investor interest, including on social media and online forums. The market volatility and trading patterns we have experienced create several risks for investors, including the following:
| ● | the market price of our Common Stock has experienced and may continue to experience rapid and substantial increases or decreases unrelated to our operating performance or prospects, or macro or industry fundamentals, and substantial increases may be significantly inconsistent with the risks and uncertainties that we continue to face; |
| ● | factors in the public trading market for our Common Stock may include the sentiment of retail investors (including as may be expressed on financial trading and other social media sites and online forums), the direct access by retail investors to broadly available trading platforms, the amount and status of short interest in our securities, access to margin debt, trading in options and other derivatives on our Common Stock and any related hedging and other trading factors; |
| ● | our market capitalization, as implied by various trading prices, currently reflects valuations that diverge from historical valuations, and to the extent these valuations reflect trading dynamics unrelated to our financial performance or prospects, purchasers of our Common Stock could incur substantial losses if there are declines in market prices; |
| ● | to the extent volatility in our Common Stock is caused, or may from time to time be caused, as has widely been reported, by a “short squeeze” in which coordinated trading activity causes a spike in the market price of our Common Stock as traders with a short position make market purchases to avoid or to mitigate potential losses, investors purchase at inflated prices unrelated to our financial performance or prospects, and may thereafter suffer substantial losses as prices decline once the level of short-covering purchases has abated; and |
| ● | if the market price of our Common Stock declines, investors may be unable to resell shares of our Common Stock at or above the price at which their investment was made. Our Common Stock may continue to fluctuate or decline significantly in the future, which may result in substantial losses. |
30
Future increases or decreases in the market price of our Common Stock may not coincide in timing with the disclosure of news or developments by or affecting us. Accordingly, the market price of our shares of Common Stock may fluctuate dramatically, and may decline rapidly, regardless of any developments in our business. Overall, there are various factors, many of which are beyond our control, that could negatively affect the market price of our Common Stock or result in fluctuations in the price or trading volume of our Common Stock, including:
| ● | actual or anticipated variations in our annual or quarterly results of operations, including our earnings estimates and whether we meet market expectations with regard to our earnings; |
| ● | restrictions on our ability to pay dividends or other distributions; |
| ● | publication of research reports by analysts or others about us or the motion picture exhibition industry, which may be unfavorable, inaccurate, inconsistent or not disseminated on a regular basis; |
| ● | changes in market interest rates that may cause purchasers of our shares to demand a different yield; |
| ● | changes in market valuations of similar companies; |
| ● | market reaction to any additional equity, debt or other securities that we may issue in the future, and which may or may not dilute the holdings of our existing stockholders; |
| ● | additions or departures of key personnel; |
| ● | actions by institutional or significant stockholders; |
| ● | short interest in our securities and the market response to such short interest; |
| ● | the dramatic increase or decrease in the number of individual holders of our Common Stock and their participation in social media platforms targeted at speculative investing; |
| ● | speculation in the press or investment community about our company or industry; |
| ● | strategic actions by us or our competitors, such as acquisitions or other investments; |
| ● | legislative, administrative, regulatory or other actions affecting our business or our industry, including positions taken by the Internal Revenue Service (“IRS”); |
| ● | strategic actions taken by motion picture studios such as the shuffling of film release dates; |
| ● | investigations, proceedings, or litigation that involve or affect us; |
| ● | ongoing impacts from the COVID-19 pandemic; |
| ● | the occurrence of any of the other risk factors included or incorporated by reference in this Annual Report on Form 10-K; and |
| ● | general market and economic conditions. |
The market price of our Common Stock and our business may be materially adversely affected by the Noteholder Action and related claims.
The market price of our Common Stock could also be negatively affected by any unfavorable outcome in the Noteholder Action described in Note 11—Commitments and Contingencies of the Notes to the Company’s Consolidated Financial Statements in Part II, Item 8 of this Form 10-K. In addition, the noteholders pursuing the Noteholder Action have directed the trustee under the indenture governing the Existing First Lien Notes (as defined herein) to provide a notice of default thereunder, claiming that breaches alleged in the Noteholder Action as well as other claimed breaches arising under the Refinancing Transactions give rise to defaults and an event of default under the Existing First Lien Notes. Even though the noteholders have not at this time attempted to accelerate the Existing First Lien Notes, and the Company would reject any such attempt as invalid, any such acceleration could in turn result in the acceleration of the Company’s other outstanding debt or have other negative consequences on our ability to operate and finance our business or otherwise. Such an event could thereby have a material adverse effect on our business, financial condition and results of operations and on the market prices of our securities, including our Common Stock. Additional litigation brought by the noteholders, other tactics associated therewith, or any publicity in connection therewith could also negatively affect the market price of our Common Stock.
31
A “short squeeze” due to a sudden increase in demand for shares of our Common Stock that largely exceeds supply and/or focused investor trading in anticipation of a potential short squeeze have led to, and could again lead to, extreme price volatility in shares of our Common Stock.
Investors may purchase shares of our Common Stock to hedge existing exposure or to speculate on the price of our Common Stock. Speculation on the price of our Common Stock may involve long and short exposures. To the extent aggregate short exposure exceeds the number of shares of our Common Stock available for purchase on the open market, investors with short exposure may have to pay a premium to repurchase shares of our Common Stock for delivery to lenders of our Common Stock. Those repurchases may, in turn, dramatically increase the price of shares of our Common Stock until additional shares of our Common Stock are available for trading or borrowing. This is often referred to as a “short squeeze.” A large proportion of our Common Stock has been traded in the past, and may be traded in the future, by short sellers, which may increase the likelihood that our Common Stock will be the target of a short squeeze, and there is widespread speculation that the trading price of our Common Stock has been from time to time the result of a short squeeze. A short squeeze and/or focused investor trading in anticipation of a short squeeze have led to, and could again lead to, volatile price movements in shares of our Common Stock that may be unrelated or disproportionate to our operating performance or prospects and, once investors purchase the shares of our Common Stock necessary to cover their short positions, or if investors no longer believe a short squeeze is viable, the price of our Common Stock may rapidly decline. Investors that purchase shares of our Common Stock during a short squeeze may lose a significant portion of their investment. Investors that purchase in anticipation of a short squeeze that is never realized may also lose a significant portion of their investment. Under the circumstances, we caution you against investing in our Common Stock, unless you are prepared to incur the risk of losing all or a substantial portion of your investment.
Negative sentiment among AMC’s retail stockholder base could have a material adverse impact on the market price of our Common Stock and your investment therein.
Some of our retail investors have referred to themselves as “Apes” on social media and in other forums. Self-proclaimed “Apes” are widely viewed as playing a significant role in the market dynamics that have resulted in substantial increases and volatility in the market prices of our Common Stock and other so-called “meme” stocks. See “Risk Factors—Risk Related to our Share Issuances— The market price and trading volume of our shares of Common Stock have experienced, and may continue to experience, extreme volatility, which could cause purchasers of our Common Stock to incur substantial losses.” While AMC and its management have actively sought to foster positive relationships with its significant retail stockholder base as the owners of AMC, and while AMC’s retail stockholder base has been credited favorably with assisting AMC in raising significant capital in the past, there is no guarantee that AMC will be able to continue to benefit from support from its retail stockholder base in the future. Negative investor sentiment could have a material adverse impact on the market price of our Common Stock.
Information available in public media that is published by third parties, including blogs, articles, online forums, message boards and social and other media may include statements not attributable to the Company and may not be reliable or accurate.
We have received, and may continue to receive, a high degree of media coverage that is published or otherwise disseminated by third parties, including blogs, articles, online forums, message boards and social and other media. This includes coverage that is not attributable to statements made by our directors, officers or employees. You should read carefully, evaluate and rely only on the information contained in this Annual Report on Form 10-K, the definitive Proxy Statement on Schedule 14A filed on April 24, 2024, the prospectus supplement filed December 6, 2024, the accompanying prospectus or any applicable free writing prospectus or incorporated documents filed with the SEC in determining whether to purchase our shares of Common Stock. Information provided by third parties may not be reliable or accurate and could materially impact the trading price of our Common Stock which could cause losses to your investments.
32
Future offerings of debt, which would be senior to our Common Stock upon liquidation, and/or other preferred equity securities, which may be senior to our Common Stock for purposes of distributions or upon liquidation, could adversely affect the market price of our Common Stock.
In the future, we may attempt to increase our capital resources by making additional offerings of debt or preferred equity securities, including convertible or non-convertible senior or subordinated notes, convertible or non-convertible preferred stock, medium-term notes and trust preferred securities, to raise cash or bolster our liquidity, to repay, refinance, redeem or repurchase indebtedness (including expenses, accrued interest and premium, if any), for working capital, to finance strategic initiatives and future acquisitions or for other purposes. Upon liquidation, holders of our debt securities and lenders with respect to other borrowings will receive distributions of our available assets prior to the holders of our Common Stock. In addition, any additional preferred stock we may issue could have a preference on liquidating distributions or a preference on distribution payments that could limit our ability to make a distribution to the holders of our Common Stock. Since our decision to issue securities in any future offering will depend on market conditions and other factors beyond our control, we cannot predict or estimate the amount, timing or nature of our future offerings. Thus, our stockholders bear the risk of our future offerings potentially reducing the market price of our Common Stock.
Anti-takeover protections in our certificate of incorporation and bylaws may discourage or prevent a takeover of our Company, even if an acquisition would be beneficial to our stockholders.
Provisions contained in our certificate of incorporation and bylaws, as amended, as well as provisions of the Delaware General Corporation Law (the “DGCL”) delay or make it more difficult to remove incumbent directors or for a third-party to acquire us, even if a takeover would benefit our stockholders. These provisions include:
| ● | a classified board of directors; |
| ● | the sole power of a majority of the board of directors to fix the number of directors; |
| ● | limitations on the removal of directors; |
| ● | the sole power of the board of directors to fill any vacancy on the board of directors, whether such vacancy occurs as a result of an increase in the number of directors or otherwise; |
| ● | the ability of our board of directors to designate one or more series of preferred stock and issue shares of preferred stock without stockholder approval; and |
| ● | the inability of stockholders to call special meetings. |
Our issuance of shares of preferred stock could delay or prevent a change of control of our company. Our board of directors has the authority to cause us to issue, without any further vote or action by the stockholders, up to 50,000,000 shares of preferred stock, par value $0.01 per share, in one or more series, to designate the number of shares constituting any series, and to fix the rights, preferences, privileges and restrictions thereof, including dividend rights, voting rights, rights and terms of redemption, redemption price or prices and liquidation preferences of such series. The issuance of shares of preferred stock may have the effect of delaying, deferring or preventing a change in control of our company without further action by the stockholders, even where stockholders are offered a premium for their shares. As of February 18, 2025, 50,000,000 shares of preferred stock are authorized and available for issuance.
Our incorporation under Delaware law, the ability of our board of directors to create and issue a new series of preferred stock or a stockholder rights plan and certain other provisions of our amended and restated certificate of incorporation and amended and restated bylaws, as amended, could impede a merger, takeover or other business combination involving our company or the replacement of our management or discourage a potential investor from making a tender offer for our Common Stock, which, under certain circumstances, could reduce the market value of our Common Stock.
An issuance of preferred stock could dilute the voting power of the Common Stockholders and adversely affect the market value of our Common Stock.
The issuance of shares of preferred stock with voting rights may adversely affect the voting power of the holders of our other classes of voting stock either by diluting the voting power of our other classes of voting stock if they vote together as a single class, or by giving the holders of any such preferred stock the right to block an action on which they have a separate class vote even if the action were approved by the holders of our other classes of voting stock.
33
In addition, the issuance of shares of preferred stock with dividend or conversion rights, liquidation preferences or other economic terms favorable to the holders of preferred stock could adversely affect the market price for our Common Stock by making an investment in the Common Stock less attractive. For example, investors may not wish to purchase Common Stock at a price above the conversion price of a series of convertible preferred stock because the holders of the preferred stock would effectively be entitled to purchase Common Stock at the lower conversion price causing economic dilution to the holders of Common Stock.
Increases in market interest rates may cause potential investors to seek higher returns and therefore reduce demand for our Common Stock, which could result in a decline in the market price of our Common Stock.
One of the factors that may influence the price of our Common Stock is the return on our Common Stock (i.e., the amount of distributions or price appreciation as a percentage of the price of our Common Stock) relative to market interest rates. An increase in market interest rates may lead prospective purchasers of our Common Stock to expect a return, which we may be unable or choose not to provide. Further, higher interest rates would likely increase our borrowing costs and potentially decrease the cash available for distribution. Thus, higher market interest rates could cause the market price of our Common Stock to decline.
Item 1B. Unresolved Staff Comments.
None.
Item 1C. Cybersecurity.
Risk Management and Strategy
The Company recognizes the importance of developing, implementing, and maintaining cybersecurity measures to assess, identify, and manage material risks from cybersecurity (including cybersecurity threats associated with the use of third-party service providers), to safeguard our information systems, and to protect the confidentiality, integrity, and availability of the data on
Managing Material Risks & Integrated Overall Risk Management
The Company has strategically integrated cybersecurity risk management into our broader risk management framework. Management has formed cross-functional risk and information security committees (the “Security Committees”) to initiate, develop, review and implement cybersecurity policies, procedures and training to mitigate cybersecurity risks. Our information technology (“IT”) cybersecurity leadership team works closely with our Security Committees and internal audit team to evaluate and address cybersecurity risks in alignment with our business objectives and operational needs.
Using a risk-based prioritization approach, the IT cybersecurity leadership team and the Security Committees focus on securing our high value assets, updating our cybersecurity detection and prevention capabilities to identify new threats, and improving compliance processes to protect the Company’s operations and data. During this process, the following factors, among others, are considered: likelihood and severity of risk, impact on the Company and others if a risk materializes, feasibility and cost of controls, and impact of controls on operations.
The Company has also implemented technical safeguards that are designed to protect our information systems from cybersecurity threats, including firewalls, intrusion prevention and detection systems, anti-malware functionality, access controls, and vulnerability and patch management.
Risk Management Personnel
The Company’s senior IT leadership, comprised of the Chief Information Officers of both AMC and Odeon, and IT cybersecurity teams have the primary responsibility for assessing, monitoring, and managing, our cybersecurity programs. The Company’s senior IT leadership bring over fifty years of combined IT experience to their roles. Each member of the Company’s IT cybersecurity leadership team, comprised of the AMC Director Cybersecurity, the Odeon Group Head of Cyber, Risk and Operations and the AMC SVP & Chief Information Officer, brings 20+ years of IT experience. The Company regularly invests in training on these teams, and key leadership positions hold CISSP certifications. Our senior IT leadership and IT cybersecurity team, with input as appropriate from the Security
34
Committees, oversee our governance programs, tests our compliance with standards, remediate known risks, and direct employee training.
Monitoring Cybersecurity Incidents
The Security Committees are continually informed about the latest developments in cybersecurity, including potential threats and risk management techniques. The Security Committees, and in particular senior IT leadership, IT cybersecurity and internal audit members serving on the Security Committees, implement and oversee processes for the regular monitoring of our information systems. The Company follows the National Institute of Standards and Technology (“NIST”) framework to design and implement security processes, tools and procedures, and regular system audits identify and lead to prompt remediation of potential vulnerabilities. In the event of a cybersecurity incident, senior IT leadership and the Security Committees are equipped with a well-defined incident response plan. This plan includes immediate actions to mitigate the impact, internal and external communication plans, and notification requirements.
Engagement of Consultants for Risk Management Services
Recognizing the complexity and evolving nature of cybersecurity threats, the Company engages with a range of external experts to perform a variety of functions for the Company. These include, but are not limited to, cybermaturity audits, targeted ransomware assessment and table-top exercises, red and purple team attack simulations, internal penetration tests and other internal and external audits. These partnerships enable us to leverage specialized knowledge and insights into our cybersecurity strategies and processes.
Overseeing Third-Party Risk
Because we are aware of the risks associated with
Risks from Cybersecurity Threats
We have
Governance
Board of Directors and Audit Committee Oversight
Our board of directors (the “Board”) understands the critical nature of managing risks associated with cybersecurity threats. The Board has established robust oversight mechanisms to ensure effective governance in managing risks associated with cybersecurity threats.
The audit committee of the Board (the “
Management’s Role Managing Risk
| ● |
current |
| ● | status of ongoing cybersecurity initiatives and strategies; |
| ● | learnings from any cybersecurity events; and |
| ● | compliance with regulatory requirements and industry standards. |
35
In addition to our scheduled meetings, the Audit Committee and senior IT leadership maintain an ongoing dialogue regarding emerging or potential cybersecurity risks. The Company, at the direction of the Audit Committee, conducts periodic reviews of the Company’s cybersecurity posture and the effectiveness of its risk management strategies. These reviews help in identifying areas for improvement and ensuring the alignment of cybersecurity efforts with the overall risk management framework.
Item 2. Properties.
The following table sets forth the general character and ownership classification of our theatre circuit, excluding non-consolidated joint ventures and managed theatres, as of December 31, 2024:
Property Holding Classification |
|
Theatres |
|
Screens |
|
Owned |
|
35 |
|
352 |
|
Leased |
|
771 |
|
9,126 |
|
Total |
|
806 |
|
9,478 |
We lease our corporate headquarters in Leawood, Kansas. We believe our facilities are currently adequate for our operations.
Please refer to Narrative Description of Business under Part I, Item 1 of this Annual Report on Form 10-K for the geographic locations of our theatrical exhibition circuit as of December 31, 2024. See Note 3—Leases in the Notes to the Consolidated Financial Statements under Part II, Item 8 of this Form 10-K.
Item 3. Legal Proceedings.
The information required to be furnished by us under this Part I, Item 3 (Legal Proceedings) is incorporated by reference to the information contained in Note 11—Commitments and Contingencies to the Consolidated Financial Statements included in Part II, Item 8 on this Annual Report on Form 10-K.
Item 4. Mine Safety Disclosures.
Not applicable
36
PART II
Item 5. Market for Registrant’s Common Equity, Related Stockholder Matters and Issuer Purchases of Equity Securities.
Market Information
Our common equity consists of Class A common stock (“Common Stock”). Our Common Stock has traded on the New York Stock Exchange (the “NYSE”) since December 18, 2013 under the symbol “AMC”.
Holders of Shares
On February 18, 2025 approximately 1.7 million shares of our Common Stock were directly registered with our transfer agent by 14,761 shareholders. The balance of our outstanding Common Stock was held in “street name” through bank or brokerage accounts.
Dividend Policy
The payment of future dividends is subject to our Board of Directors’ discretion and dependent on many considerations, including limitations imposed by covenants in the agreements governing our indebtedness, operating results, capital requirements, strategic considerations and other factors.
We will only be able to pay dividends from our available cash on hand and funds received from our subsidiaries. Their ability to make any payments to us will depend upon many factors, including our operating results, cash flows, and the indentures governing our debt securities. The declaration and payment of any future dividends will be at the sole discretion of our Board of Directors after taking into account various factors, including legal requirements, our subsidiaries’ ability to make payments to us, our financial condition, operating results, cash flow from operating activities, available cash and current and anticipated cash needs. See the Liquidity and Capital Resources section of Part II, Item 7 of this Form 10-K for further information regarding the dividend restrictions.
Securities Authorized for Issuance Under Equity Compensation Plans
See Part III, Item 12 of this Annual Report on Form 10-K.
Unregistered Sales of Equity Securities and Use of Proceeds
Sale of Unregistered Securities
Except as reported in Item 3.02 of our Current Reports on Form 8-K filed with the SEC on May 15, 2024, July 22, 2024 (as amended by the Form 8-K filed on July 25, 2024), September 30, 2024, and November 12, 2024, all of which are incorporated by reference into this Annual Report on Form 10-K, there were no sales of unregistered securities during the fiscal year ended December 31, 2024.
Issuer Purchase of Equity Securities
None.
37
Performance Graph
The following stock price performance graph should not be deemed incorporated by reference by any general statement incorporating by reference this Annual Report on Form 10-K into any filing under the Securities Exchange Act of 1934, as amended (the “Exchange Act”) or the Securities Act of 1933, as amended (the “Securities Act”), as amended, except to the extent that we specifically incorporate this information by reference and shall not otherwise be deemed filed under such acts.
The following stock performance graph compares, for the period December 31, 2019 through December 31, 2024, the cumulative total stockholder returns for AMC’s Common Stock, the Standard & Poor’s Corporation Composite 500 Index and a self-determined peer group consisting of Cinemark Holdings, Inc. (CNK) and IMAX Corporation (IMAX). Measurement points are the last trading day for each month ended December 31, 2019 through December 31, 2024. The graph assumes that $100.00 was invested on December 31, 2019 in our Common Stock and in our peer group and in the Standard & Poor’s Corporation Composite 500 Index and assumes reinvestment of any dividends.
The stock price performance below is not necessarily indicative of future stock price performance.
COMPARISON OF 5 YEAR CUMULATIVE TOTAL RETURN*
Among AMC Entertainment Holdings, Inc., the S&P 500 Index, and a Peer Group
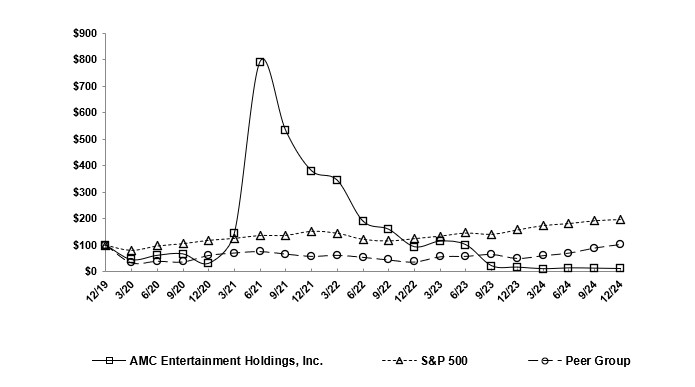
*$100 invested on December 31, 2019 in stock or in index, including reinvestment of dividends. Historical AMC share prices were adjusted by LSEG to reflect the impact of the Special Dividend paid on August 19, 2022 and the reverse stock split on August 24, 2023. Fiscal year ended December 31.
38
|
12/19 |
|
3/20 |
|
6/20 |
|
9/20 |
|
12/20 |
|
AMC Entertainment Holdings, Inc. |
|
100.00 |
|
44.12 |
59.89 |
65.76 |
29.60 |
|||
S&P 500 |
|
100.00 |
|
80.40 |
96.92 |
105.57 |
118.40 |
|||
Peer Group |
100.00 |
33.86 |
39.51 |
36.81 |
60.85 |
|||||
3/21 |
|
6/21 |
|
9/21 |
|
12/21 |
||||
AMC Entertainment Holdings, Inc. |
142.54 |
|
791.31 |
|
531.36 |
|
379.74 |
|||
S&P 500 |
125.71 |
|
136.46 |
|
137.25 |
|
152.39 |
|||
Peer Group |
70.16 |
75.32 |
66.10 |
57.66 |
||||||
|
3/22 |
|
6/22 |
|
9/22 |
|
12/22 |
|||
AMC Entertainment Holdings, Inc. |
|
344.00 |
|
189.17 |
|
158.40 |
|
92.50 |
||
S&P 500 |
|
145.38 |
|
121.97 |
|
116.02 |
|
124.79 |
||
Peer Group |
61.58 |
54.02 |
44.11 |
36.55 |
||||||
3/23 |
6/23 |
|
9/23 |
|
12/23 |
|||||
AMC Entertainment Holdings, Inc. |
113.86 |
100.00 |
20.58 |
15.76 |
||||||
S&P 500 |
134.14 |
145.87 |
141.10 |
157.59 |
||||||
Peer Group |
55.99 |
57.73 |
64.45 |
49.84 |
||||||
3/24 |
|
6/24 |
|
9/24 |
|
12/24 |
||||
AMC Entertainment Holdings, Inc. |
9.58 |
12.83 |
11.72 |
10.25 |
||||||
S&P 500 |
174.23 |
181.69 |
192.39 |
197.02 |
||||||
Peer Group |
60.36 |
69.80 |
88.75 |
101.66 |
39
Item 6. [Reserved].
Not applicable
Item 7. Management’s Discussion and Analysis of Financial Condition and Results of Operations.
The following discussion relates to the consolidated audited financial statements of AMC included elsewhere in this Annual Report on Form 10-K. This discussion contains forward-looking statements. Please see “Forward-Looking Statements” and “Risk Factors” in Part I on this Annual Report on Form 10-K for a discussion of the risks, uncertainties and assumptions relating to these statements. See Note 1—The Company and Significant Accounting Policies in Notes to the Consolidated Financial Statements under Part II, Item 8 of this Form 10-K for information regarding the Company’s significant accounting policies.
Overview
AMC is the world’s largest theatrical exhibition company and an industry leader in innovation and operational excellence. As of December 31, 2024 we operated in 11 countries including the United States and throughout Europe.
Our theatrical exhibition revenues are generated primarily from box office admissions and food and beverage sales. The balance of our revenues is generated from ancillary sources, including online ticketing fees, on-screen advertising, income from gift card and exchange ticket sales, rental of theatre auditoriums, retail popcorn and merchandise sales, fees earned from our customer loyalty programs, and theatrical distribution. As of December 31, 2024, we owned, operated or had interests in 871 theatres and 9,798 screens.
Significant Events—For the Year Ended December 31, 2024
Debt Repurchases and Exchanges. The below table summarizes the various cash debt repurchase transactions, debt for equity exchange transactions, and cash and debt for equity exchange transactions that occurred during the year ended December 31, 2024. The debt for equity transactions were treated as early extinguishments of debt. In accordance with ASC 470-50-40-3, the reacquisition price of the extinguished debt was determined to be the fair value of the Common Stock exchanged. See Note 8—Corporate Borrowings and Finance Lease Liabilities in the Notes to the Consolidated Financial Statements under Part II, Item 8 of this Form 10-K for further information on these transactions.
Shares of |
|||||||||||||||
Aggregate Principal |
Common Stock |
Reacquisition |
(Gain)/Loss on |
Accrued Interest |
|||||||||||
(In millions, except for share data) |
Repurchased/Exchanged |
Exchanged |
Cost |
Extinguishment |
Paid/Exchanged |
||||||||||
Cash debt repurchase transactions: |
|||||||||||||||
5.75% Senior Subordinated Notes due 2025 |
$ |
8.9 |
— |
$ |
8.6 |
$ |
(0.3) |
$ |
0.1 |
||||||
Second Lien Notes due 2026 |
50.0 |
— |
50.5 |
(4.4) |
1.4 |
||||||||||
Total cash debt repurchase transactions |
58.9 |
— |
59.1 |
(4.7) |
1.5 |
||||||||||
Debt for equity exchange transactions: |
|||||||||||||||
5.75% Senior Subordinated Notes due 2025 |
36.7 |
9,017,297 |
39.8 |
3.2 |
0.8 |
||||||||||
Second Lien Notes due 2026 |
224.1 |
35,062,835 |
157.2 |
(93.1) |
8.3 |
||||||||||
Total debt for equity exchange transactions |
260.8 |
44,080,132 |
197.0 |
(89.9) |
9.1 |
||||||||||
Cash and debt for equity exchange transactions: |
|||||||||||||||
5.75% Senior Subordinated Notes due 2025 |
8.6 |
447,829 |
8.4 |
(0.2) |
0.1 |
||||||||||
5.875% Senior Subordinated Notes due 2026 |
9.6 |
432,777 |
8.1 |
(1.3) |
0.2 |
||||||||||
Second Lien Notes due 2026 |
45.0 |
2,693,717 |
45.5 |
(4.0) |
1.2 |
||||||||||
Total cash and debt for equity exchange transactions |
63.2 |
3,574,323 |
62.0 |
(5.5) |
1.5 |
||||||||||
Total debt repurchases and exchanges |
$ |
382.9 |
47,654,455 |
$ |
318.1 |
$ |
(100.1) |
$ |
12.1 |
||||||
Vendor Dispute. On January 26, 2024, we executed an agreement to collect $37.5 million as resolution of a dispute with a vendor. The proceeds, net of legal costs, were recorded to other income during the year ended December 31, 2024. The relationship with the vendor has been restored and remains in good standing.
40
Share Issuances. During the year ended December 31, 2024, we raised gross proceeds of $261.8 million and paid fees to sales agents and incurred other third-party issuance costs of approximately $6.4 million and $1.9 million, respectively, through our at-the-market offerings of approximately 75.5 million shares of our Common Stock. We paid $0.8 million of other third-party issuance costs during the year ended December 31, 2024.
Additionally, we entered into forward transactions to sell 30.0 million shares of our Common Stock. During December 2024, we were paid $0.01 per share for the par value of the forward shares totaling $0.3 million.
In January 2025, we were paid $171.7 million as initial gross cash proceeds associated with the establishment of forward positions for 30 million shares of Common Stock plus at-the-market offerings of 17.1 million shares of Common Stock. Fees paid to sales agents were approximately $0.6 million. We may be entitled to receive additional cash payments pursuant to the forward sales. There is no guarantee that we will receive any additional proceeds. See Note 9—Stockholder’s Deficit and Note 16—Subsequent Events in the Notes to the Consolidated Financial Statements under Part II, Item 8 of this Form 10-K for further information.
Debt Refinancing. During the year ended December 31, 2024, we completed a series of transactions to refinance $1,895.0 million aggregate principal amount of our Existing Term Loans and $518.6 million of our Second Lien Notes. As part of the transactions we issued $2,024.3 million aggregate principal amount of the New Term Loans and $414.4 million aggregate principal of Exchangeable Notes. The repurchases of the Second Lien Notes were accounted for as extinguishments and resulted in a loss on extinguishment of $61.2 million. See the Liquidity and Capital Resources section below and Note 8—Corporate Borrowings and Finance Lease Liabilities in the Notes to the Consolidated Financial Statements under Part II, Item 8 of this Form 10-K for further information on these transactions.
Special Awards. On February 22, 2024, the compensation committee of AMC’s Board of Directors approved modification of the performance goals applicable to all 2023 Tranche Year PSU awards. This was accounted for as a modification to the 2023 Tranche Year PSU awards which lowered the Adjusted EBITDA and free cash flow performance targets such that 200% vesting was achieved for both targets. This modification resulted in the immediate additional vesting of 478,055 2023 Tranche Year PSUs (21,829 cash settled units and 456,226 equity settled units). This was treated as a Type 3 modification (improbable-to-probable) which required the Company to recognize additional stock compensation expense based on the modification date fair values of the incremental PSUs. During the year ended December 31, 2024, the Company recognized $2.1 million of stock compensation expense related to these awards.
Significant Events—For the Year Ended December 31, 2023
AMC Distribution. During 2023 we, along with our sub-distribution partners, served as the theatrical distributor for two theatrical releases: TAYLOR SWIFT | THE ERAS TOUR and RENAISSANCE: A FILM BY BEYONCÉ. The distribution business is a new source of revenue that we have the potential to capitalize on in the future.
Lease Termination. During the year ended December 31, 2023, the Company received a $13.0 million buyout incentive from a landlord which provided the landlord the right to terminate the lease of one theatre. The incentive and termination gain resulted in a $16.7 million reduction to rent expense.
Saudi Cinema Company. On December 30, 2022, we entered into an agreement to sell our 10.0% investment in Saudi Cinema Company LLC for SAR 112.5 million ($30.0 million), subject to certain closing conditions. On January 24, 2023, the Saudi Ministry of Commerce recorded a sale of equity, and we received the proceeds on January 25, 2023. We recorded a gain on the sale of $15.5 million in investment income during the year ended December 31, 2023.
41
Debt Repurchases and Exchanges. The below table summarizes the cash debt repurchase transactions and various debt for equity exchange transactions during the year ended December 31, 2023, including repurchases with a related party. See Note 8—Corporate Borrowings and Finance Lease Liabilities in the Notes to the Consolidated Financial Statements under Part II, Item 8 of this Form 10-K for further information on these transactions.
Shares of |
|||||||||||||||
Aggregate Principal |
Common Stock |
Reacquisition |
(Gain) on |
Accrued Interest |
|||||||||||
(In millions, except for share data) |
Repurchased/Exchanged |
Exchanged |
Cost |
Extinguishment |
Paid/Exchanged |
||||||||||
Cash debt repurchase transactions: |
|||||||||||||||
Related party transactions: |
|||||||||||||||
Second Lien Notes due 2026 |
$ |
75.9 |
$ |
— |
$ |
48.5 |
$ |
(40.9) |
$ |
1.1 |
|||||
5.875% Senior Subordinated Notes due 2026 |
4.1 |
— |
1.7 |
(2.3) |
0.1 |
||||||||||
Total related party transactions |
80.0 |
— |
50.2 |
(43.2) |
1.2 |
||||||||||
Non-related party transactions: |
|||||||||||||||
Second Lien Notes due 2026 |
139.7 |
— |
91.4 |
(71.3) |
4.5 |
||||||||||
Total non-related party transactions |
139.7 |
— |
91.4 |
(71.3) |
4.5 |
||||||||||
Total cash debt repurchase transactions |
$ |
219.7 |
$ |
— |
$ |
141.6 |
$ |
(114.5) |
$ |
5.7 |
|||||
Debt for equity exchange transactions: |
|||||||||||||||
Second Lien Notes due 2026 |
$ |
105.3 |
14,186,651 |
91.7 |
(28.3) |
1.2 |
|||||||||
Total debt repurchases and exchanges |
$ |
325.0 |
14,186,651 |
$ |
233.3 |
$ |
(142.8) |
$ |
6.9 |
||||||
Additional Share Issuances to Antara. On December 22, 2022, we entered into a forward purchase agreement (the “Forward Purchase Agreement”) with Antara Capital LP (“Antara”) pursuant to which we agreed to (i) sell to Antara 10,659,511 AMC Preferred Equity Units for an aggregate purchase price of $75.1 million and (ii) simultaneously purchase from Antara $100.0 million aggregate principal amount of the Company’s 10%/12% Cash/PIK Toggle Second Lien Notes due 2026 in exchange for 9,102,619 AMC Preferred Equity Units. On February 7, 2023, we issued 19,762,130 AMC Preferred Equity Units to Antara in exchange for $75.1 million in cash and $100.0 million aggregate principal amount of our 10%/12% Cash/PIK Toggle Second Lien Notes due 2026. We recorded $193.7 million to stockholders’ deficit as a result of the transaction. We paid $1.4 million of accrued interest in cash upon exchange of the notes.
Share Issuances. During the year ended December 31, 2023, we entered into various equity distribution agreements with sales agents to sell shares of our Common Stock and AMC Preferred Equity Units, from time to time, through “at-the-market” offering programs that have been completed.
During the year ended December 31, 2023, the Company raised gross proceeds of approximately $790.0 million and paid fees to sales agents and incurred other third-party issuance costs of approximately $19.8 million and $9.9 million, respectively, through its at-the-market offering of approximately 88.0 million shares of its Common Stock and 7.1 million of its AMC Preferred Equity Units. The Company paid $12.6 million of other third-party issuance costs during the year ended December 31, 2023. See Note 9—Stockholders’ Deficit for further information regarding the at-the-market offerings.
Special Awards. On February 23, 2023, AMC’s Board of Directors approved special awards in lieu of vesting of the 2022 PSU awards. The special awards were accounted for as a modification to the 2022 PSU awards which lowered the Adjusted EBITDA and free cash flow performance targets such that 200% vesting was achieved for both tranches. This modification resulted in the immediate additional vesting of 238,959 Common Stock 2022 PSUs and 238,959 AMC Preferred Equity Unit 2022 PSUs. This was treated as a Type 3 modification (improbable-to-probable) which requires us to recognize additional stock compensation expense based on the modification date fair values of the Common Stock PSUs and AMC Preferred Equity Units PSUs of $14.9 million and $5.3 million, respectively. During the year ended December 31, 2023, we recognized $20.2 million of additional stock compensation expense related to these awards.
NCM Bankruptcy. On April 11, 2023, National CineMedia, LLC (“NCM”) filed a petition under Chapter 11 of the U.S. Bankruptcy Code in the Southern District of Texas. NCM is the in-theatre advertising provider for the majority of our theatres in the United States. Under the Chapter 11 plan of reorganization, which became effective on August 7, 2023 (the “Plan”), NCM has assumed its agreements with us. As part of the Plan, on August 7, 2023, NCM issued 16,581,829 common units (“NCM Common Units”) that were owed to the Company as part of the annual common unit adjustment. However, under the terms of the Plan and the restructuring of the equity of NCM thereunder, the NCM Common Units were immediately cancelled upon the effective date of the Plan. On August 13, 2023, in
42
response to an appeal by the Company regarding certain terms of the Plan, including modification of the terms of the exhibitor services agreement with other parties that were not similarly granted to the Company and appeal of the court’s order to approve cancellation of the NCM Common Unit issuance, the United States District Court for the Southern District of Texas affirmed the rulings of the bankruptcy court, including confirmation of the Plan. The Company filed an appeal to these rulings with the United States Court of Appeals for the Fifth Circuit and such appeal remains pending. The Company does not expect the NCM bankruptcy to have a material impact on the Company.
Shareholder Litigation. Two putative stockholder class actions were filed in the Delaware Chancery Court that assert a breach of fiduciary duty against certain of our directors and a claim for breach of 8 Del. C. § 242 against those directors and us, arising out of our creation of AMC Preferred Equity Units, the transactions between Antara and us that we announced on December 22, 2022, and the Charter Amendments.
This litigation prevented us from immediately implementing the Charter Amendments. On April 2, 2023, the parties entered into a binding settlement term sheet to settle the litigation and allow implementation of the Charter Amendments. On August 11, 2023, the Delaware Chancery Court approved the settlement and on Monday, August 21, 2023, the Delaware Supreme Court confirmed the ruling of the Chancery Court. Pursuant to the settlement term sheet, record holders of Common Stock at the close of business on August 24, 2023, after giving effect to the Reverse Stock Split, but prior to the conversion of AMC Preferred Equity Units into Common Stock, received a payment of one share of Common Stock for every 7.5 shares of Common Stock owned by the Settlement Payment Recipients. On August 28, 2023, the Company made the Settlement Payment and issued 6,897,018 shares of Common Stock. See Note 11—Commitments and Contingencies in the Notes to the Condensed Consolidated Financial Statements under Part II, Item 8 of this Form 10-K for further information regarding the litigation and settlement. For capitalized terms used herein but not defined see Note 9—Stockholders’ Deficit or Note 11—Commitments and Contingencies in the Notes to the Consolidated Financial Statements under Part II, Item 8 of this Form 10-K.
Significant Events—For the Year Ended December 31, 2022
For a discussion of significant events for the year ended December 31, 2022, see “Part II, Item 7. Management’s Discussion and Analysis of Financial Condition and Results of Operations” of our annual report on Form 10-K for the year ended December 31, 2022, filed with the Securities and Exchange Commission on February 28, 2023, which is incorporated herein by reference.
Critical Accounting Estimates
Our consolidated financial statements are prepared in accordance with U.S. GAAP. In connection with the preparation of our financial statements, we are required to make assumptions and estimates about future events and apply judgments that affect the reported amounts of assets, liabilities, revenue, expenses and the related disclosures. We base our assumptions, estimates, and judgments on historical experience, current trends and other factors that management believes to be relevant at the time our consolidated financial statements are prepared. On a regular basis, we review the accounting policies, assumptions, estimates, and judgments to ensure that our financial statements are presented fairly and in accordance with U.S. GAAP. However, because future events and their effects cannot be determined with certainty, actual results could differ from our assumptions and estimates, and such differences could be material. We have identified several policies as being critical because they require management to make particularly difficult, subjective and complex judgments about matters that are inherently uncertain, and there is a likelihood that materially different amounts would be reported under different conditions or using different assumptions.
All of our significant accounting policies are discussed in Note 1—The Company and Significant Accounting Policies in the Notes to the Consolidated Financial Statements under Part II, Item 8 of this Form 10-K.
Long-lived Assets Impairments. We review long-lived assets whenever events or changes in circumstances indicate that the carrying amount of the assets may not be fully recoverable.
Critical estimates. There are many estimates and significant judgments that are made by management in performing impairment evaluations of long-lived assets, including but not limited to, estimates of future attendance, revenues, operating costs and expenses, capital expenditures, the cost of capital. These estimates determine whether impairments have been incurred and quantify the amount of any related impairment charge.
Assumptions and judgment. Our valuation methodology for assessing impairment requires management to make judgments and assumptions based on historical experience and projections of future cash flows. Our projections assume
43
that operating revenues will gradually improve to the point they exceed pre-COVID-19 levels. This assumption, together with other assumptions, create considerable amount of management judgment with respect to cash flow estimates and appropriate discount rates to be used in determining the fair value of long-lived assets.
Impact if actual results differ from assumptions. Although we believe that our estimates and judgments are reasonable, actual results may differ from these estimates, many of which fall under Level 3 within the fair value measurement hierarchy. Factors that could lead to impairment of long-lived assets include adverse industry or economic trends that would result in declines in the operating performance of our Domestic and International Theatres. Examples of adverse events or circumstances that could change include (i) limited availability of new theatrical releases; (ii) an adverse change in macroeconomic conditions; (iii) increased cost factors that have a negative effect on our earnings and cash flows and higher interest rates; and (iv) negative or overall declining financial performance compared with our actual and projected results of relevant prior periods.
If we are required to record an impairment charge it may substantially reduce the carrying value of our assets and reduce our income in the year in which it is recorded. Given the nature of our business and our recent history, business conditions that are constantly changing, and the competitive business environment in which we operate future material impairments are possible and they may be material.
Our Current Long-lived Asset Impairment Related Estimates and Changes in those Estimates. During the year ended December 31, 2024, we recorded non-cash impairment charges related to our long-lived assets of $51.9 million on 39 theatres in the U.S. markets with 469 screens which were related to property, net and operating lease right-of-use assets, net and $20.4 million on 23 theatres in the International markets with 188 screens which were related to property, net and operating lease right-of-use assets, net. A hypothetical 10% decline in the fair value of the asset groups would have resulted in approximately $6.8 million of additional impairment charges.
During the year ended December 31, 2023, we recorded non-cash impairment charges related to our long-lived assets of $49.2 million on 68 theatres in the U.S. markets with 738 screens which were related to property, net and operating lease right-of-use assets, net and $57.7 million on 57 theatres in the International markets with 488 screens which were related to property, net and operating lease right-of-use assets, net.
During the year ended December 31, 2022, we recorded non-cash impairment charges related to our long-lived assets of $73.4 million on 68 theatres in the U.S. markets with 817 screens which were related to property, net and operating lease right-of-use assets, net and $59.7 million on 53 theatres in the International markets with 456 screens which were related to property, net and operating lease right-of-use assets, net.
At December 31, 2024, related cash flows were discounted at 9.0% for the Domestic Theatres and 10.5% for the International Theatres. At December 31, 2023, related cash flows were discounted at 9.0% for the Domestic Theatres and 11.0% for the International Theatres. At December 31, 2022, related cash flows were discounted at 10.0% for the Domestic Theatres and 12.5% for the International Theatres.
Goodwill. We evaluate the goodwill recorded at our two reporting units (Domestic Theatres and International Theatres) for impairment annually as of the beginning of the fourth fiscal quarter or more frequently as specific events or circumstances dictate. Impairment is the condition that exists when the carrying amount of goodwill exceeds its implied fair value. If the estimated fair value of the reporting unit is less than its carrying value, the difference is recorded as a goodwill impairment charge, not to exceed the total amount of goodwill allocated to that reporting unit. Entities are allowed to perform optional qualitative assessments for both reporting units to determine whether it is more likely than not that goodwill is impaired.
Critical estimates. Calculating the fair value of our Domestic Theatres and International Theatres reporting units by use of the income approach for enterprise valuation methodology which utilizes estimated future discounted cash flows. The income approach provides an estimate of fair value by measuring estimated annual cash flows over a discrete projection period and applying a present value discount rate to the cash flows. The present value of the cash flows is then added to the present value equivalent of the residual value of the business to arrive at an estimated fair value of the reporting unit. The residual value represents the present value of the projected cash flows beyond the discrete projection period. The discount rates are determined using weighted average cost of capital for the risk of achieving the projected cash flows.
44
We have elected to perform the optional qualitative assessment during the years ended December 31, 2024, 2023, and 2022. Inherent in the qualitative assessment are estimates and assumptions about our consideration of events and circumstances that may indicate a potential impairment. Such estimates and assumptions include, but are not limited to, industry and market conditions, expected cost pressures, expected financial performance, and general macroeconomic conditions. Additionally, the estimated fair value of our debt and equity at the consolidated level may be a relevant factor in determining whether it is more likely than not that goodwill is impaired.
Assumptions and judgment. Estimating the impact of the general macroeconomic conditions, potential cost pressures, and future industry and market conditions requires significant judgement. We must make assumptions around how much weight should be given to each event and circumstance in order to make an overall qualitative assessment on whether it is more likely than not that goodwill is impaired. The estimated fair value of our debt is based on observable market based inputs and the estimated fair value of our equity is based on quoted prices in active markets.
Impact if actual results differ from assumptions. If we were required to record an impairment charge to our goodwill it may substantially reduce the carrying value of goodwill on our balance sheet and reduce our income in the year in which it is recorded. Given the nature of our business and our recent history, business conditions that are constantly changing, and the competitive business environment in which we operate future material impairments are possible and they may be material.
Our Current Goodwill Estimates and Changes in those Estimates. Based on our qualitative assessments for the years ended December 31, 2024, December 31, 2023, and December 31, 2022, we do not believe it is more likely than not that goodwill is impaired.
Derivative Liability. We remeasure the derivative liability related to the conversion features in our Exchangeable Notes at fair value each reporting period with changes in fair value recorded in the consolidated statements of operations. We have obtained independent third-party valuation studies to assist us in determining fair value.
Critical estimates. Our valuation studies use the Binomial Lattice approach and are based on significant inputs not observable in the market and thus represent level 3 measurements within the fair value measurement hierarchy. The Binomial Lattice approach consists of simulated Common Stock prices from the valuation date to the maturity of the Exchangeable Notes. The significant inputs used to value the derivative include the initial share price of our Common Stock, the volatility of the share price, time to maturity, risk-free interest rate, credit spread, and the discount yield. The volatility of our Common Stock, the Common Stock price at the end of each reporting period, and the remaining amount of time until maturity of the Exchangeable Notes are key inputs for the estimation of fair value that are expected to change each reporting period.
Assumptions and judgment. Selecting the appropriate method and model to use in the valuation of the derivative liability associated with the Exchangeable Notes conversion feature requires judgment and careful consideration of the common valuation practice for similar instruments. Selection of significant assumptions such as volatility and the credit spread also requires judgment and both inputs exhibit a greater degree of subjectivity than less observable inputs such as the risk-free rate.
Impact if actual results differ from assumptions. If actual results differ from assumptions, the value of the derivative liability could be overstated or understated which could increase or decrease net earnings by a material amount.
Our Current Estimates and Changes in those Estimates. During the year ended December 31, 2024, we recorded other (income) related to a decline in our derivative liability fair value of $(75.8) million. A hypothetical 10% increase in the fair value of the derivative liability would have resulted in a decline of other income of approximately $15.8 million. Similarly, a hypothetical 10% decrease in the fair value of the derivative liability would have resulted in an increase to other income of approximately $15.8 million. We expect there will be future changes in the fair value for our derivative liability and that the related amounts recorded as income or expense may be material. See Note 8—Corporate Borrowings and Finance Lease Liabilities and Note 12—Fair Value Measurements in the Notes to the Consolidated Financial Statements under Part II, Item 8 of this Form 10-K for further information.
45
Operating Results
The following table sets forth our consolidated revenues, operating costs and expenses attributable to our theatrical exhibition operations and segment operating results. Reference is made to Note 13—Segment Reporting in the Notes to the Consolidated Financial Statements under Part II, Item 8 of this Form 10-K for additional information therein:
U.S. Markets |
International Markets |
Consolidated |
|||||||||||||||||||||||||
Year Ended |
Year Ended |
Year Ended |
|||||||||||||||||||||||||
December 31, |
December 31, |
December 31, |
|||||||||||||||||||||||||
(In millions) |
|
2024 |
|
2023 |
|
% Change |
|
2024 |
|
2023 |
|
% Change |
|
2024 |
|
2023 |
|
% Change |
|||||||||
Revenues |
|||||||||||||||||||||||||||
Admissions |
$ |
1,916.7 |
$ |
2,015.7 |
(4.9) |
% |
$ |
643.8 |
$ |
674.8 |
(4.6) |
% |
$ |
2,560.5 |
$ |
2,690.5 |
(4.8) |
% |
|||||||||
Food and beverage |
|
1,301.6 |
|
1,347.3 |
(3.4) |
% |
|
323.3 |
|
322.5 |
0.2 |
% |
|
1,624.9 |
|
1,669.8 |
(2.7) |
% |
|||||||||
Other theatre |
|
325.9 |
|
325.7 |
0.1 |
% |
|
125.9 |
|
126.6 |
(0.6) |
% |
|
451.8 |
|
452.3 |
(0.1) |
% |
|||||||||
Total revenues |
3,544.2 |
3,688.7 |
(3.9) |
% |
1,093.0 |
1,123.9 |
(2.7) |
% |
4,637.2 |
4,812.6 |
(3.6) |
% |
|||||||||||||||
Operating Costs and Expenses |
|||||||||||||||||||||||||||
Film exhibition costs |
988.8 |
1,023.3 |
(3.4) |
% |
250.4 |
267.8 |
(6.5) |
% |
1,239.2 |
1,291.1 |
(4.0) |
% |
|||||||||||||||
Food and beverage costs |
|
225.7 |
|
233.9 |
(3.5) |
% |
|
79.9 |
|
81.4 |
(1.8) |
% |
|
305.6 |
|
315.3 |
(3.1) |
% |
|||||||||
Operating expense, excluding depreciation and amortization below |
|
1,252.1 |
|
1,261.8 |
(0.8) |
% |
|
427.3 |
|
429.7 |
(0.6) |
% |
|
1,679.4 |
|
1,691.5 |
(0.7) |
% |
|||||||||
Rent |
|
649.9 |
|
651.5 |
(0.2) |
% |
|
223.7 |
|
222.0 |
0.8 |
% |
|
873.6 |
|
873.5 |
0.0 |
% |
|||||||||
General and administrative expense: |
|||||||||||||||||||||||||||
Merger, acquisition and other costs |
|
0.1 |
|
1.7 |
(94.1) |
% |
|
— |
|
— |
NA |
% |
|
0.1 |
|
1.7 |
(94.1) |
% |
|||||||||
Other, excluding depreciation and amortization below |
|
150.6 |
|
169.2 |
(11.0) |
% |
|
76.2 |
|
72.7 |
4.8 |
% |
|
226.8 |
|
241.9 |
(6.2) |
% |
|||||||||
Depreciation and amortization |
|
247.5 |
|
286.5 |
(13.6) |
% |
|
72.0 |
|
78.5 |
(8.3) |
% |
|
319.5 |
|
365.0 |
(12.5) |
% |
|||||||||
Impairment of long-lived assets |
|
51.9 |
|
49.2 |
5.5 |
% |
|
20.4 |
|
57.7 |
(64.6) |
% |
|
72.3 |
|
106.9 |
(32.4) |
% |
|||||||||
Operating costs and expenses |
|
3,566.6 |
|
3,677.1 |
(3.0) |
% |
|
1,149.9 |
|
1,209.8 |
(5.0) |
% |
|
4,716.5 |
|
4,886.9 |
(3.5) |
% |
|||||||||
Operating income (loss) |
|
(22.4) |
|
11.6 |
* |
% |
|
(56.9) |
|
(85.9) |
(33.8) |
% |
|
(79.3) |
|
(74.3) |
6.7 |
% |
|||||||||
Other expense (income): |
|||||||||||||||||||||||||||
Other income |
|
(124.4) |
|
(52.8) |
* |
% |
|
(31.8) |
|
(24.0) |
32.5 |
% |
|
(156.2) |
|
(76.8) |
* |
% |
|||||||||
Interest expense: |
|||||||||||||||||||||||||||
Corporate borrowings |
|
341.9 |
|
310.7 |
10.0 |
% |
|
59.9 |
|
58.9 |
1.7 |
% |
|
401.8 |
|
369.6 |
8.7 |
% |
|||||||||
Finance lease obligations |
|
0.1 |
|
0.2 |
(50.0) |
% |
|
5.3 |
|
3.5 |
51.4 |
% |
|
5.4 |
|
3.7 |
45.9 |
% |
|||||||||
Non-cash NCM exhibitor service agreement |
36.5 |
37.9 |
(3.7) |
% |
— |
— |
NA |
% |
36.5 |
37.9 |
(3.7) |
% |
|||||||||||||||
Investment expense (income) |
|
(14.0) |
|
1.6 |
* |
% |
|
(2.3) |
|
(17.1) |
(86.5) |
% |
|
(16.3) |
|
(15.5) |
5.2 |
% |
|||||||||
Total other expense, net |
|
240.1 |
|
297.6 |
(19.3) |
% |
|
31.1 |
|
21.3 |
46.0 |
% |
|
271.2 |
|
318.9 |
(15.0) |
% |
|||||||||
Loss before income taxes |
|
(262.5) |
|
(286.0) |
(8.2) |
% |
|
(88.0) |
|
(107.2) |
(17.9) |
% |
|
(350.5) |
|
(393.2) |
(10.9) |
% |
|||||||||
Income tax provision |
|
— |
|
1.8 |
(100.0) |
% |
|
2.1 |
|
1.6 |
31.3 |
% |
|
2.1 |
|
3.4 |
(38.2) |
% |
|||||||||
Net loss |
$ |
(262.5) |
$ |
(287.8) |
(8.8) |
% |
$ |
(90.1) |
$ |
(108.8) |
(17.2) |
% |
$ |
(352.6) |
$ |
(396.6) |
(11.1) |
% |
|||||||||
*Percentage change in excess of 100%.
U.S. Markets |
International Markets |
Consolidated |
||||||||||||
Year Ended |
Year Ended |
Year Ended |
||||||||||||
December 31, |
December 31, |
December 31, |
||||||||||||
|
2024 |
|
2023 |
|
2024 |
|
2023 |
|
2024 |
|
2023 |
|||
Operating Data: |
||||||||||||||
Screen additions |
— |
— |
13 |
— |
13 |
— |
||||||||
Screen acquisitions |
— |
21 |
9 |
10 |
9 |
31 |
||||||||
Screen dispositions |
185 |
315 |
78 |
146 |
263 |
461 |
||||||||
Construction openings (closures), net |
1 |
15 |
(21) |
— |
(20) |
15 |
||||||||
Average screens(1) |
7,206 |
7,403 |
2,376 |
2,447 |
9,582 |
9,850 |
||||||||
Number of screens operated |
7,185 |
7,369 |
2,613 |
2,690 |
9,798 |
10,059 |
||||||||
Number of theatres operated |
544 |
562 |
327 |
336 |
871 |
898 |
||||||||
Screens per theatre |
13.2 |
13.1 |
8.0 |
8.0 |
11.2 |
11.2 |
||||||||
Attendance (in thousands)(1) |
156,866 |
169,378 |
67,289 |
70,107 |
224,155 |
239,485 |
||||||||
46
(1) |
Includes consolidated theatres only and excludes screens offline due to construction. |
47
Adjusted EBITDA
We present Adjusted EBITDA as a supplemental measure of our performance. We define Adjusted EBITDA as net earnings (loss) plus (i) income tax provision (benefit), (ii) interest expense and (iii) depreciation and amortization, as further adjusted to eliminate the impact of certain items that we do not consider indicative of our ongoing operating performance and to include attributable EBITDA from equity investments in theatre operations in International markets. These further adjustments are itemized below. You are encouraged to evaluate these adjustments and the reasons we consider them appropriate for supplemental analysis. In evaluating Adjusted EBITDA, you should be aware that in the future we may incur expenses that are the same as or similar to some of the adjustments in this presentation. Our presentation of Adjusted EBITDA should not be construed as an inference that our future results will be unaffected by unusual or non-recurring items. The preceding definition of and adjustments made to GAAP measures to determine Adjusted EBITDA are broadly consistent with Adjusted EBITDA as defined in the Company’s debt indentures. During the year ended December 31, 2024, we changed the definition of Adjusted EBITDA to no longer further adjust for “cash distributions from non-consolidated entities” and “other non-cash rent benefit.” All comparative period information for Adjusted EBITDA has been re-cast to conform with the current definition.
The following tables set forth our Adjusted EBITDA by reportable segment and our reconciliation of Adjusted EBITDA:
Year Ended |
||||||
Adjusted EBITDA (In millions) |
|
December 31, 2024 |
|
December 31, 2023 |
||
U.S. markets |
$ |
301.5 |
$ |
391.1 |
||
International markets |
42.4 |
63.2 |
||||
Total Adjusted EBITDA (1) |
$ |
343.9 |
$ |
454.3 |
||
Year Ended |
|||||||||
(In millions) |
December 31, 2024 |
|
December 31, 2023 |
||||||
Net loss |
$ |
(352.6) |
$ |
(396.6) |
|||||
Plus: |
|||||||||
Income tax provision (1) |
|
2.1 |
|
3.4 |
|||||
Interest expense |
|
443.7 |
|
411.2 |
|||||
Depreciation and amortization |
|
319.5 |
|
365.0 |
|||||
Impairment of long-lived assets (2) |
|
72.3 |
|
106.9 |
|||||
Certain operating expense (3) |
|
5.4 |
|
2.5 |
|||||
Equity in earnings of non-consolidated entities (4) |
|
(12.4) |
|
(7.7) |
|||||
Attributable EBITDA (5) |
1.9 |
2.2 |
|||||||
Investment income (6) |
|
(16.3) |
|
(15.5) |
|||||
Other income (7) |
|
(141.8) |
|
(61.3) |
|||||
Merger, acquisition and other costs (8) |
|
0.1 |
|
1.7 |
|||||
Stock-based compensation expense (9) |
|
22.0 |
|
42.5 |
|||||
Adjusted EBITDA |
$ |
343.9 |
$ |
454.3 |
|||||
| (1) | For information regarding the income tax provision (benefit), see Note 10—Income Taxes in the Notes to the Consolidated Financial Statements under Part II, Item 8 of this Form 10-K. |
| (2) | During the year ended December 31, 2024, we recorded non-cash impairment charges related to our long-lived assets of $51.9 million on 39 theatres in the U.S. markets with 469 screens which were related to property, net and operating lease right-of-use assets, net and $20.4 million on 23 theatres in the International markets with 188 screens which were related to property, net and operating lease right-of-use assets, net. |
During the year ended December 31, 2023, we recorded non-cash impairment charges related to our long-lived assets of $49.2 million on 68 theatres in the U.S. markets with 738 screens which were related to property, net and operating lease right-of-use assets, net and $57.7 million on 57 theatres in the International markets with 488 screens which were related to property, net and operating lease right-of-use assets, net.
| (3) | Amounts represent preopening expense related to temporarily closed screens under renovation, theatre and other closure expense for the permanent closure of screens including the related accretion of interest, non-cash deferred digital equipment rent expense, and disposition of assets and other non-operating gains or losses |
48
| included in operating expenses. We have excluded these items as they are non-cash in nature or are non-operating in nature. |
| (4) | Equity in earnings of non-consolidated entities primarily consisted of equity in earnings from AC JV of $10.0 million during the year ended December 31, 2024. Equity in earnings of non-consolidated entities primarily consisted of equity in earnings from AC JV of $4.9 million during the year ended December 31, 2023. |
| (5) | Attributable EBITDA includes the EBITDA from equity investments in theatre operators in certain International markets. See below for a reconciliation of our equity in (earnings) of non-consolidated entities to attributable EBITDA. Because these equity investments are in theatre operators in regions where we hold a significant market share, we believe attributable EBITDA is more indicative of the performance of these equity investments and management uses this measure to monitor and evaluate these equity investments. We also provide services to these theatre operators including information technology systems, certain on-screen advertising services and our gift card and package ticket program. |
Year Ended |
||||||
(In millions) |
December 31, 2024 |
|
December 31, 2023 |
|||
Equity in (earnings) of non-consolidated entities |
$ |
(12.4) |
$ |
(7.7) |
||
Less: |
||||||
Equity in (earnings) of non-consolidated entities excluding International theatre joint ventures |
(11.5) |
(6.6) |
||||
Equity in earnings of International theatre joint ventures |
0.9 |
1.1 |
||||
Income tax provision |
— |
0.1 |
||||
Investment income |
(0.4) |
(0.6) |
||||
Interest expense |
0.1 |
0.2 |
||||
Impairment of long-lived assets |
— |
— |
||||
Depreciation and amortization |
1.3 |
1.4 |
||||
Attributable EBITDA |
$ |
1.9 |
$ |
2.2 |
||
| (6) | Investment expense (income) during the year ended December 31, 2024 includes interest income of $(19.2) million, partially offset by a decline in the estimated fair value of our investment in common shares of Hycroft of $0.4 million and a decline in the estimated fair value of our investment in warrants to purchase common shares of Hycroft of $2.5 million. Investment expense (income) during the year ended December 31, 2023 included a $(15.5) million gain on sale of our investment in Saudi Cinema Company LLC and interest income of $(15.3) million, partially offset by a decline in estimated fair value of our investment in common shares of Hycroft of $6.6 million, a decline in the estimated fair value of our investment in warrants to purchase common shares of Hycroft of $6.0 million, $1.8 million of expense for NCM Common Units, $1.0 million impairment of a cost method investment. |
| (7) | Other expense (income) during the year ended December 31, 2024, primarily consisted of a decrease in the fair value of the derivative liability for the embedded conversion feature in the Exchangeable Notes of $(75.8) million, shareholder litigation recoveries of $(40.2), net gains on debt extinguishments of $(38.9) million, a vendor dispute of $(36.2) million, partially offset by term loan modification third party fees of $42.3 million and foreign currency transaction losses of $7.0 million. |
Other expense (income) for the year ended December 31, 2023, primarily consisted of gains on debt extinguishment of $(142.8) million and foreign currency transaction gains of $(17.8) million, partially offset by non-cash litigation charge of $99.3 million.
| (8) | Merger, acquisition and other costs are excluded as they are non-operating in nature. |
| (9) | Non-cash expense included in general and administrative: other. |
Adjusted EBITDA is a non-GAAP financial measure commonly used in our industry and should not be construed as an alternative to net earnings (loss) as an indicator of operating performance (as determined in accordance with U.S. GAAP). Adjusted EBITDA may not be comparable to similarly titled measures reported by other companies. We have included Adjusted EBITDA because we believe it provides management and investors with additional information to measure our performance and estimate our value.
49
Adjusted EBITDA has important limitations as an analytical tool, and you should not consider it in isolation, or as a substitute for analysis of our results as reported under U.S. GAAP. For example, Adjusted EBITDA:
| ● | does not reflect our capital expenditures, future requirements for capital expenditures or contractual commitments; |
| ● | does not reflect changes in, or cash requirements for, our working capital needs; |
| ● | does not reflect the significant interest expenses, or the cash requirements necessary to service interest or principal payments, on our debt; |
| ● | excludes income tax payments that represent a reduction in cash available to us; and |
| ● | does not reflect any cash requirements for the assets being depreciated and amortized that may have to be replaced in the future. |
During the year ended December 31, 2024, Adjusted EBITDA in the U.S. markets was $301.5 million compared to $391.1 million during the year ended December 31, 2023. The year-over-year decline was primarily driven by a decrease in attendance as a result of the availability and popularity of new film releases compared to the prior year and an increase in film exhibition cost percentage. These declines were partially offset by an increase in average ticket price, an increase in food and beverage sales per patron, and a decline in rent expense.
During the year ended December 31, 2024, Adjusted EBITDA in the International markets was $42.4 million compared to $63.2 million during the year ended December 31, 2023. The year-over-year decline was primarily driven by a decrease in attendance as a result of the popularity of new film releases compared to the prior year, a decline in average ticket price, an increase in general and administrative expense and a decline in government assistance. These declines were partially offset by an increase in food and beverage sales per patron.
During the year ended December 31, 2024, Adjusted EBITDA in the U.S. markets and International markets was $343.9 million compared to $454.3 million during the year ended December 31, 2023, driven by the aforementioned factors impacting Adjusted EBITDA.
Segment Information
Our historical results of operations for the years ended December 31, 2024 and December 31, 2023 reflect the results of operations for our two theatrical exhibition reportable segments, U.S. markets and International markets.
Results of Operations—For the Year Ended December 31, 2024, Compared to the Year Ended December 31, 2023
Consolidated Results of Operations
Revenues. Total revenues decreased $175.4 million, or 3.6%, during the year ended December 31, 2024, compared to the year ended December 31, 2023. Admissions revenues decreased $130.0 million, or 4.8%, during the year ended December 31, 2024, compared to the year ended December 31, 2023, primarily due to a decrease in attendance of 6.4% from 239.5 million patrons to 224.2 million patrons, partially offset by a 1.7% increase in average ticket price. The decrease in attendance was primarily due to the popularity of film product in U.S. markets compared to the prior year. The availability and popularity of film product released during the year ended December 31, 2024, was negatively impacted by labor stoppages during 2023. The increase in average ticket price was primarily due to increased ticket prices for all formats, increases in 3D, IMAX, and other PLF screen volumes as a percentage of attendance, and increases in attendance for alternative content.
Food and beverage revenues decreased $44.9 million, or 2.7%, during the year ended December 31, 2024, compared to the year ended December 31, 2023, primarily due to the decrease in attendance, partially offset by an increase in food and beverage per patron. Food and beverage per patron increased 4.0% from $6.97 to $7.25 due primarily to an increase in average prices and the percentage of guests making transactions, partially offset by more frequent attendance from our AMC Stubs members. See Note 1—The Company and Significant Accounting Policies in the Notes to the Consolidated Financial Statements under Part II, Item 8 of this Form 10-K for a discussion of our accounting policies for our customer loyalty programs.
50
Total other theatre revenues decreased $0.5 million, or 0.1%, during the year ended December 31, 2024, compared to the year ended December 31, 2023 primarily due to decreases in distribution revenues from TAYLOR SWIFT | THE ERAS TOUR and RENAISSANCE: A FILM BY BEYONCÉ in the prior year and lower ticket fee revenues due to the decline in attendance, partially offset by increases in retail food and beverage sales, advertising revenues and higher income from gift cards and package tickets.
Operating costs and expenses. Operating costs and expenses decreased $170.4 million, or 3.5%, during the year ended December 31, 2024, compared to the year ended December 31, 2023. Film exhibition costs decreased $51.9 million, or 4.0%, during the year ended December 31, 2024, compared to the year ended December 31, 2023, primarily due to the decrease in attendance, partially offset by higher film rental terms. As a percentage of admissions revenues, film exhibition costs were 48.4% for the year ended December 31, 2024, compared to 48.0% for the year ended December 31, 2023.
Food and beverage costs decreased $9.7 million, or 3.1%, during the year ended December 31, 2024, compared to the year ended December 31, 2023. The decrease in food and beverage costs was primarily due to lower food and beverage revenues. As a percentage of food and beverage revenues, food and beverage costs were 18.8% for the year ended December 31, 2024, compared to 18.9% for the year ended December 31, 2023.
Operating expense decreased by $12.1 million, or 0.7%, during the year ended December 31, 2024, compared to the year ended December 31, 2023. The decrease in operating expense was primarily due to the decrease in attendance. As a percentage of revenues, operating expense was 36.2% for the year ended December 31, 2024, compared to 35.1% for the year ended December 31, 2023. Rent expense increased $0.1 million, during the year ended December 31, 2024, compared to the year ended December 31, 2023. Rent expense included the early termination of one theatre lease for a benefit of $16.7 million in the prior year, which included an early termination payment from the landlord for $13.0 million.
Merger, acquisition, and other costs. Merger, acquisition, and other costs were $0.1 million during the year ended December 31, 2024, compared to $1.7 million during the year ended December 31, 2023.
Other. Other general and administrative expense decreased $15.1 million, or 6.2%, during the year ended December 31, 2024, compared to the year ended December 31, 2023 due primarily to lower stock-based compensation expense and declines in bonus expense as a result of lower than expected annual performance compared to annual targets in the current year compared to the prior year. We recorded $2.1 million of stock-based compensation expense related to special awards during the year ended December 31, 2024 compared to $20.2 million during the year ended December 31, 2023. The decrease in stock-based compensation expense related to special awards in each year accounted for as modifications to the respective 2023 and 2022 PSU awards which lowered the Adjusted EBITDA and free cash flow performance targets such that 200% vesting was achieved for both tranches in 2023 and 2022. See Note 9—Stockholders’ Deficit in the Notes to the Consolidated Financial Statements under Part II, Item 8 of this Form 10-K for additional information about stock-based compensation expense.
Depreciation and amortization. Depreciation and amortization decreased $45.5 million, or 12.5%, during the year ended December 31, 2024, compared to the year ended December 31, 2023, primarily due to theatre closures and lower depreciation expense on theatres impaired during the year ended December 31, 2023.
Impairment of long-lived assets. During the year ended December 31, 2024, we recognized non-cash impairment losses of $51.9 million on 39 theatres in the U.S. markets with 469 screens (in Alabama, California, Florida, Illinois, Indiana, Massachusetts, Michigan, Minnesota, New Jersey, New York, Pennsylvania, Texas, Virginia, and Washington) and $20.4 million on 23 theatres in the International markets with 188 screens (in Germany, Italy, Spain, and the UK), which were related to property, net and operating lease right-of-use assets, net.
During the year ended December 31, 2023, we recognized non-cash impairment losses of $49.2 million on 68 theatres in the U.S. markets with 738 screens (in Alabama, Colorado, District of Columbia, Florida, Georgia, Iowa, Illinois, Indiana, Kansas, Kentucky, Louisiana, Massachusetts, Maryland, Michigan, Minnesota, Missouri, North Carolina, New York, Pennsylvania, Tennessee, Texas, Utah, Virginia, Washington, Wisconsin and West Virginia) which were related to property, net and operating lease right-of-use assets, net and $57.7 million on 57 theatres in the International markets with 488 screens (in Germany, Ireland, Italy, Portugal, Spain, Sweden, and the UK), which were related to property, net and operating lease right-of-use assets, net.
51
Other income. Other income of $156.2 million during the year ended December 31, 2024 was primarily due to $75.8 million of income related to the decrease in fair value of the Conversion Option (as defined herein) derivative liability, a gain on extinguishment of debt of $40.3 million related to the redemption of $837.7 million aggregate principal amount of the Second Lien Notes, $40.2 million of recoveries related to the Shareholder Litigation (as defined herein), the favorable settlement of a vendor dispute of $36.2 million, $12.4 million of equity in earnings of non-consolidated entities and $3.6 million of other settlement proceeds, partially offset by $42.3 million of third party costs related to the modification of the Existing Term Loans and $7.0 million of foreign currency transaction losses. Other income of $76.8 million during the year ended December 31, 2023 was primarily due to a gain on extinguishment of debt of $140.5 million related to the redemption of $320.9 million aggregate principal amount of the Second Lien Notes, a gain on extinguishment of debt of $2.3 million related to the redemption of $4.1 million aggregate principal amount of our Senior Subordinated Notes due 2026, a receipt of $14.0 million in settlement of the Lao Action (as defined herein), equity in earnings of non-consolidated entities of $7.7 million and $17.8 million in foreign currency transaction gains, partially offset by, $110.2 million of expense related to the settlement of the Shareholder Litigation comprised of $10.9 million of estimated legal fees and contingent insurance recovery costs and $99.3 million of non-cash expense for the estimated fair value as of the date of the final Delaware Supreme Court order of settlement shares issued to holders of Common Stock on August 28, 2023. See Note 1—The Company and Significant Accounting Policies in the Notes to the Consolidated Financial Statements under Part II, Item 8 of this Form 10-K for additional information about the components of other income.
Interest expense. Interest expense increased $32.5 million to $443.7 million for the year ended December 31, 2024 compared to $411.2 million during the year ended December 31, 2023 primarily due to increased interest expense of $45.3 million on the New Term Loans compared to the Existing Term Loans, and interest expense of $18.2 million on the Exchangeable Notes issued on July 22, 2024, partially offset by declines in interest expense of $28.8 million on the Second Lien Notes due to redemptions of principal balances and declines in interest expense related to the revolving credit facility of $2.7 million. See Note 8—Corporate Borrowings and Finance Lease Liabilities in the Notes to the Consolidated Financial Statements under Part II, Item 8 of this Form 10-K for additional information about our indebtedness.
Investment income. Investment income was $16.3 million for the year ended December 31, 2024, compared to investment income of $15.5 million for the year ended December 31, 2023. Investment income in the current year includes interest income of $19.2 million, partially offset by a $0.4 million decrease in estimated fair value of our investment in common shares of Hycroft and a $2.5 million decline in estimated fair value of our investment in warrants to purchase common shares of Hycroft. Investment income in the prior year includes a gain on sale of our 10.0% interest in Saudi Cinema Company LLC of $15.5 million and interest income of $15.3 million, partially offset by a $6.6 million decline in estimated fair value of our investment in common shares of Hycroft, $6.0 million decline in estimated fair value of our investment in warrants to purchase common shares of Hycroft, a $1.0 million impairment charge related to equity interest investments without a readily determinable fair value accounted for under the cost method and $1.8 million of expense for NCM Common Units.
Income tax provision. The income tax provision was $2.1 million and $3.4 million for the years ended December 31, 2024 and December 31, 2023, respectively. See Note 10—Income Taxes in the Notes to the Consolidated Financial Statements under Part II, Item 8 of this Form 10-K for further information.
Net loss. Net loss was $352.6 million and $396.6 million during the years ended December 31, 2024, and December 31, 2023, respectively. Net loss during the year ended December 31, 2024 compared to net loss for the year ended December 31, 2023 was positively impacted by decreases in general and administrative expense, impairment of long-lived assets, depreciation and amortization, increases in other income, increases in investment income and decreases in income tax provision, partially offset by the decrease in attendance as a result of the popularity of new film releases compared to the prior year and increases in interest expense.
Theatrical Exhibition–U.S. Markets
Revenues. Total revenues decreased $144.5 million during the year ended December 31, 2024, compared to the year ended December 31, 2023. Admissions revenues decreased $99.0 million, or 4.9%, during the year ended December 31, 2024, compared to the year ended December 31, 2023, primarily due to a decrease in attendance of 7.4% from 169.4 million patrons to 156.9 million patrons, partially offset by a 2.7% increase in average ticket price. The decrease in attendance was primarily due to the popularity of film product compared to the prior year. The availability and popularity of film product released during the year ended December 31, 2024, was negatively impacted by labor
52
stoppages during 2023. The increase in average ticket price was primarily due to increased ticket prices for all formats, increases in 3D, IMAX, and other PLF screen volumes as a percentage of attendance, and increases in attendance for alternative content, partially offset by decreases in traditional screen volumes as a percentage of attendance.
Food and beverage revenues decreased $45.7 million, or 3.4%, during the year ended December 31, 2024, compared to the year ended December 31, 2023, primarily due to the decrease in attendance, partially offset by an increase in food and beverage per patron. Food and beverage per patron increased 4.4% from $7.95 to $8.30 due primarily to an increase in average prices and the percentage of guests making transactions, partially offset by more frequent attendance from our AMC Stubs members. See Note 1—The Company and Significant Accounting Policies in the Notes to the Consolidated Financial Statements under Part II, Item 8 of this Form 10-K for a discussion of our accounting policies for our customer loyalty programs.
Total other theatre revenues increased $0.2 million, or 0.1%, during the year ended December 31, 2024, compared to the year ended December 31, 2023 primarily due to increases in retail food and beverage sales, advertising revenues and higher income from gift cards and package tickets, partially offset by decreases in distribution revenues from TAYLOR SWIFT | THE ERAS TOUR and RENAISSANCE: A FILM BY BEYONCÉ in the prior year and lower ticket fee revenues due to the decline in attendance.
Operating costs and expenses. Operating costs and expenses decreased $110.5 million, or 3.0%, during the year ended December 31, 2024, compared to the year ended December 31, 2023. Film exhibition costs decreased $34.5 million, or 3.4%, during the year ended December 31, 2024, compared to the year ended December 31, 2023, primarily due to the decrease in attendance, partially offset by higher film rental terms. As a percentage of admissions revenues, film exhibition costs were 51.6% for the year ended December 31, 2024, compared to 50.8% for the year ended December 31, 2023.
Food and beverage costs decreased $8.2 million, or 3.5%, during the year ended December 31, 2024, compared to the year ended December 31, 2023. The decrease in food and beverage costs was primarily due to lower food and beverage revenues. As a percentage of food and beverage revenues, food and beverage costs were 17.3% for the year ended December 31, 2024, compared to 17.4% for the year ended December 31, 2023.
Operating expense decreased by $9.7 million, or 0.8%, during the year ended December 31, 2024, compared to the year ended December 31, 2023. The decrease in operating expense was primarily due to the decrease in attendance. As a percentage of revenues, operating expense was 35.3% for the year ended December 31, 2024, and 34.2% for the year ended December 31, 2023. Rent expense decreased $1.6 million, during the year ended December 31, 2024, compared to the year ended December 31, 2023. Rent expense included the early termination of one theatre lease for a benefit of $16.7 million in the prior year, which included an early termination payment from the landlord for $13.0 million.
Merger, acquisition, and other costs. Merger, acquisition, and other costs were $0.1 million during the year ended December 31, 2024, compared to $1.7 million during the year ended December 31, 2023.
Other. Other general and administrative expense decreased $18.6 million, or 11.0%, during the year ended December 31, 2024, compared to the year ended December 31, 2023, due primarily to lower stock-based compensation expense and declines in bonus expense as a result of lower than expected annual performance compared to annual targets in the current year compared to the prior year. We recorded $1.9 million of stock-based compensation expense related to special awards during the year ended December 31, 2024 compared to $18.1 million during the year ended December 31, 2023. The decrease in stock-based compensation expense related to special awards in each year accounted for as modifications to the respective 2023 and 2022 PSU awards which lowered the Adjusted EBITDA and free cash flow performance targets such that 200% vesting was achieved for both tranches in 2023 and 2022. See Note 9—Stockholders’ Deficit in the Notes to the Consolidated Financial Statements under Part II, Item 8 of this Form 10-K for additional information about stock-based compensation expense.
Depreciation and amortization. Depreciation and amortization decreased $39.0 million, or 13.6%, during the year ended December 31, 2024, compared to the year ended December 31, 2023, primarily due to theatre closures and lower depreciation expense on theatres impaired during the year ended December 31, 2023.
53
Impairment of long-lived assets. During the year ended December 31, 2024, we recognized non-cash impairment losses of $51.9 million on 39 theatres in the U.S. markets with 469 screens (in Alabama, California, Florida, Illinois, Indiana, Massachusetts, Michigan, Minnesota, New Jersey, New York, Pennsylvania, Texas, Virginia, and Washington).
During the year ended December 31, 2023, we recognized non-cash impairment losses of $49.2 million on 68 theatres in the U.S. markets with 738 screens (in Alabama, Colorado, District of Columbia, Florida, Georgia, Iowa, Illinois, Indiana, Kansas, Kentucky, Louisiana, Massachusetts, Maryland, Michigan, Minnesota, Missouri, North Carolina, New York, Pennsylvania, Tennessee, Texas, Utah, Virginia, Washington, Wisconsin and West Virginia) which were related to property, net and operating lease right-of-use assets, net.
Other income. Other income of $124.4 million during the year ended December 31, 2024 was primarily due to $75.8 million of income related to the decrease in fair value of the Conversion Option derivative liability, a gain on extinguishment of debt of $40.3 million related to the redemption of $837.7 million aggregate principal amount of the Second Lien Notes, $40.2 million of recoveries related to the Shareholder Litigation, $10.7 million of equity in earnings of non-consolidated entities and $3.6 million of other settlement proceeds, partially offset by $42.3 million of third party costs related to the modification of the Existing Term Loans. Other income of $52.8 million during the year ended December 31, 2023 was primarily due to a gain on extinguishment of debt of $140.5 million related to the redemption of $320.9 million aggregate principal amount of the Second Lien Notes, a gain on extinguishment of debt of $2.3 million related to the redemption of $4.1 million aggregate principal amount of our Senior Subordinated Notes due 2026, a receipt of $14.0 million in settlement of the Lao Action, equity in earnings of non-consolidated entities of $5.5 million, partially offset by, $110.2 million of expense related to the settlement of the Shareholder Litigation comprised of $10.9 million of estimated legal fees and contingent insurance recovery costs and $99.3 million of non-cash expense for the estimated fair value as of the date of the final Delaware Supreme Court order of settlement shares issued to holders of Common Stock on August 28, 2023. See Note 1—The Company and Significant Accounting Policies in the Notes to the Consolidated Financial Statements under Part II, Item 8 of this Form 10-K for additional information about the components of other expense.
Interest expense. Interest expense increased $29.7 million to $378.5 million for the year ended December 31, 2024, compared to $348.8 million during the year ended December 31, 2023, primarily due to increased interest expense of $45.3 million on the New Term Loans compared to the Existing Term Loans, and interest expense of $18.2 million on the Exchangeable Notes issued on July 22, 2024, partially offset by declines in interest expense of $28.8 million on the Second Lien Notes due to redemptions of principal balances and declines in interest expense related to the revolving credit facility of $2.7 million. See Note 8—Corporate Borrowings and Finance Lease Liabilities in the Notes to the Consolidated Financial Statements under Part II, Item 8 of this Form 10-K for additional information about our indebtedness.
Investment income. Investment income was $14.0 million for the year ended December 31, 2024, compared to investment expense of $1.6 million for the year ended December 31, 2023. Investment income in the current year includes interest income of $16.9 million, partially offset by a $0.4 million decrease in estimated fair value of our investment in common shares of Hycroft and a $2.5 million decline in estimated fair value of our investment in warrants to purchase common shares of Hycroft. Investment expense in the prior year includes interest income of $13.7 million, partially offset by a $6.6 million decline in estimated fair value of our investment in common shares of Hycroft, $6.0 million decline in estimated fair value of our investment in warrants to purchase common shares of Hycroft, a $1.0 million impairment charge related equity interest investments without a readily determinable fair value accounted for under the cost method and $1.8 million of expense for NCM Common Units.
Income tax provision. The income tax provision was $0.0 million and $1.8 million for the years ended December 31, 2024, and December 31, 2023, respectively. See Note 10—Income Taxes in the Notes to the Consolidated Financial Statements under Part II, Item 8 of this Form 10-K for further information.
Net loss. Net loss was $262.5 million and $287.8 million during the years ended December 31, 2024, and December 31, 2023, respectively. Net loss during the year ended December 31, 2024 compared to net loss for the year ended December 31, 2023 was positively impacted by decreases in rent expense, decreases in general and administrative expense, impairment of long-lived assets, depreciation and amortization, increases in other income, increases in investment income and decreases in income tax provision, partially offset by the decrease in attendance as a result of the popularity of new film releases compared to the prior year and increases in interest expense.
54
Theatrical Exhibition–International Markets
Revenues. Total revenues decreased $30.9 million, or 2.7%, during the year ended December 31, 2024, compared to the year ended December 31, 2023. Admissions revenues decreased $31.0 million, or 4.6% during the year ended December 31, 2024, compared to the year ended December 31, 2023, primarily due to a decrease in attendance of 4.0% from 70.1 million patrons to 67.3 million patrons and a 0.6% decrease in average ticket price. The decrease in attendance was primarily due to the popularity of film product compared to the prior year.
Food and beverage revenues increased $0.8 million, or 0.2%, during the year ended December 31, 2024, compared to the year ended December 31, 2023, primarily due to an increase in food and beverage per patron, partially offset by the decrease in attendance. Food and beverage per patron increased 4.3% from $4.60 to $4.80 primarily due to an increase in average prices and the percentage of guests making transactions.
Total other theatre revenues decreased $0.7 million, or 0.6%, during the year ended December 31, 2024, compared to the year ended December 31, 2023.
Operating costs and expenses. Operating costs and expenses decreased $59.9 million, or 5.0%, during the year ended December 31, 2024, compared to the year ended December 31, 2023. Film exhibition costs decreased $17.4 million, or 6.5%, during the year ended December 31, 2024, compared to the year ended December 31, 2023, primarily due to decrease in attendance and lower film rental terms. As a percentage of admissions revenues, film exhibition costs were 38.9% for the year ended December 31, 2024, compared to 39.7% for the year ended December 31, 2023.
Food and beverage costs decreased $1.5 million, or 1.8%, during the year ended December 31, 2024, compared to the year ended December 31, 2023. The decrease in food and beverage costs was primarily due to lower food and beverage costs as a percentage of revenues, partially offset by the increase in food and beverage revenues. As a percentage of food and beverage revenues, food and beverage costs were 24.7% for the year ended December 31, 2024, compared to 25.2% for the year ended December 31, 2023.
Operating expense decreased by $2.4 million, or 0.6%, during the year ended December 31, 2024, compared to the year ended December 31, 2023. The decrease in operating expense was primarily due to lower utilities expense. As a percentage of revenues, operating expense was 39.1% for the year ended December 31, 2024, compared to 38.2% for the year ended December 31, 2023. Rent expense increased $1.7 million, or 0.8%, during the year ended December 31, 2024, compared to the year ended December 31, 2023.
Other. Other general and administrative expense increased $3.5 million, or 4.8%, during the year ended December 31, 2024, compared to the year ended December 31, 2023, primarily due to increases in payroll expenses.
Depreciation and amortization. Depreciation and amortization decreased $6.5 million, or 8.3%, during the year ended December 31, 2024, compared to the year ended December 31, 2023, primarily due to theatre closures and lower depreciation expense on theatres impaired during the year ended December 31, 2023.
Impairment of long-lived assets. During the year ended December 31, 2024, we recognized non-cash impairment losses of $20.4 million on 23 theatres in the International markets with 188 screens (in Germany, Italy, Spain, and the UK), which were related to property, net and operating lease right-of-use assets, net.
During the year ended December 31, 2023, we recognized non-cash impairment losses of $57.7 million on 57 theatres in the International markets with 488 screens (in Germany, Ireland, Italy, Portugal, Spain, Sweden, and the UK), which were related to property, net, and operating lease right-of-use assets, net.
Other income. Other income of $31.8 million during the year ended December 31, 2024 was primarily due the favorable settlement of a vendor dispute of $36.2 million, $1.7 million of equity in earnings of non-consolidated entities and, partially offset by $7.0 million of foreign currency transaction losses. Other income of $24.0 million during the year ended December 31, 2023 was primarily due to $17.8 million in foreign currency transaction gains, $3.8 million of government assistance and $2.2 million of equity in earnings of non-consolidated entities. See Note 1—The Company and Significant Accounting Policies in the Notes to the Consolidated Financial Statements under Part II, Item 8 of this Form 10-K for additional information about the components of other (income) expense.
55
Interest expense. Interest expense increased $2.8 million to $65.2 million for the year ended December 31, 2024, compared to $62.4 million during the year ended December 31, 2023, primarily due to increases in finance lease interest expense. See Note 3—Leases and Note 8—Corporate Borrowings and Finance Lease Liabilities in the Notes to the Consolidated Financial Statements under Part II, Item 8 of this Form 10-K for additional information about our indebtedness and finance leases.
Investment income. Investment income was $2.3 million for the year ended December 31, 2024, compared to investment income of $17.1 million for the year ended December 31, 2023. Investment income in the current year includes $2.3 million of interest income. Investment income in the prior year includes a gain on sale of our 10.0% interest in Saudi Cinema Company LLC of $15.5 million and interest income of $1.6 million.
Income tax provision. The income tax provision was $2.1 million and $1.6 million for the years ended December 31, 2024, and December 31, 2023, respectively. See Note 10—Income Taxes in the Notes to the Consolidated Financial Statements under Part II, Item 8 of this Form 10-K for further information.
Net loss. Net loss was $90.1 million and $108.8 million during the years ended December 31, 2024, and December 31, 2023, respectively. Net loss during the year ended December 31, 2024 compared to net loss for the year ended December 31, 2023 was positively impacted by decreases in impairment of long-lived assets, depreciation and amortization and increases in other income, partially offset by the decrease in attendance as a result of the popularity of new film releases compared to the prior year, decreases in investment income, and increases in rent expense, general and administrative expense, interest expense and income tax provision.
Results of Operations—For the Year Ended December 31, 2023, Compared to the Year Ended December 31, 2022
For a comparison of our results of operations for the year ended December 31, 2023, compared to the year ended December 31, 2022, see “Part II, Item 7. Management’s Discussion and Analysis of Financial Condition and Results of Operations” of our annual report on Form 10-K for the year ended December 31, 2023, filed with the Securities and Exchange Commission on February 28, 2024, which is incorporated herein by reference.
Liquidity and Capital Resources—For the Year Ended December 31, 2024, Compared to the Year Ended December 31, 2023
Our revenues are primarily collected in cash, principally through admissions and food and beverage sales. We have an operating “float” which partially financed our operations and which generally permits us to maintain a smaller amount of working capital capacity. This float existed because admissions revenues are received in cash, while exhibition costs (primarily film rentals) are ordinarily paid to distributors from 20 to 45 days following receipt of admissions revenues. Film distributors generally release the films which they anticipate will be the most successful during the summer and year-end holiday seasons. Consequently, we typically generate higher revenues during such periods and experience higher working capital requirements following such periods.
We had working capital deficits (excluding restricted cash) as of December 31, 2024 and December 31, 2023 of $(846.1) million and $(456.4) million, respectively. As of December 31, 2024 and December 31, 2023, working capital included operating lease liabilities of $524.9 million and $508.8 million, respectively, and deferred revenues of $432.4 million and $421.8 million, respectively.
As of December 31, 2024, we had cash and cash equivalents of approximately $632.3 million compared to $884.3 million as of December 31, 2023.
We took action to lower our future interest expense of our fixed-rate debt through debt buybacks and exchanges for equity. Additionally, we have bolstered our liquidity through various equity issuances. See Note 8—Corporate Borrowings and Finance Lease Liabilities, Note 9—Stockholders’ Deficit, and Note 16—Subsequent Events in the Notes to the Consolidated Financial Statements under Part II, Item 8 of this Form 10-K for further information regarding equity issuances and debt repurchases and exchanges.
We expect, from time to time, to continue to seek to retire or purchase our outstanding debt through cash purchases and/or exchanges for equity or debt, in open-market purchases, privately negotiated transactions or otherwise. Such repurchases or exchanges, if any, will be upon such terms and at such prices as we may determine, and will depend
56
on prevailing market conditions, our liquidity requirements, contractual restrictions and other factors. The amounts involved may be material and, to the extent equity is used, dilutive.
Refinancing Transactions
On July 22, 2024, we completed the Refinancing Transactions with two creditor groups to refinance and extend to 2029 and 2030 the maturities of approximately $1.6 billion of our debt previously maturing in 2026.
During the third quarter of 2024, we completed follow-on open market repurchases of our Existing Term Loans, and in exchange, issued to such selling holders our New Term Loans pursuant to the New Term Loan Credit Agreement of approximately $793.0 million.
As of December 31, 2024, we completed open market purchases of $1,895.0 million aggregate principal amount of our Existing Term Loans and issued $2,024.3 million aggregate principal amount of the New Term Loans. Accordingly, as of such date, we had no remaining aggregate principal amount of Existing Term Loans outstanding and the loan documents relating to the Existing Term Loans were terminated.
See Note 8—Corporate Borrowings and Finance Lease Liabilities in the Notes to the Consolidated Financial Statements under Part II, Item 8 of this Form 10-K for further information.
Liquidity Requirements
We believe our existing cash and cash equivalents, together with cash generated from operations, will be sufficient to fund our operations and satisfy our obligations currently and through the next twelve months. Our current cash burn rates are not sustainable long-term. In order to achieve sustainable net positive cash flows provided by operating activities and long-term profitability, we believe that revenues will need to increase to levels in line with pre-COVID-19 revenues. North America box office grosses were down approximately 23% for the year ended December 31, 2024, compared to the year ended December 31, 2019. Until such time as we are able to achieve sustainable net positive cash flows provided by operating activities, it is difficult to estimate our future cash burn rates and liquidity requirements. Depending on our assumptions regarding the timing and ability to achieve levels of revenue, the estimates of amounts of required liquidity vary significantly.
There can be no assurance that the revenues, attendance levels and other assumptions used to estimate our liquidity requirements and future cash burn rates will be correct, and our ability to be predictive is uncertain due to limited ability to predict studio film release dates, the overall production and theatrical release levels and success of individual titles. Further, there can be no assurances that we will be successful in generating the additional liquidity necessary to meet our obligations beyond twelve months from the issuance of this Annual Report on terms acceptable to us or at all.
Cash Flows from Operating Activities
Net cash used in operating activities, as reflected in the consolidated statements of cash flows, were $50.8 million and $215.2 million during the years ended December 31, 2024 and December 31, 2023, respectively. The decrease in net cash flows used in operating activities was primarily due to a decline in cash used for working capital items due to a 20.2% increase in attendance in the fourth quarter of 2024 compared to the fourth quarter of 2023, which drove accounts payable higher at December 31, 2024 than December 31, 2023, declines in credit card receivables due to the December 31, 2023 year ending on a Sunday compared to a Tuesday for the year ending December 31, 2024 where additional days of weekend revenues were collected in the current year compared to the prior year, declines in cash paid for operating leases, declines in cash paid for interest, and cash receipts for a vendor dispute and shareholder litigation recoveries in the current year, partially offset by the decline in attendance for the year ending December 31, 2024, resulting in less cash provided by operating activities.
Cash Flows from Investing Activities
Net cash used in investing activities, as reflected in the consolidated statements of cash flows, were $242.9 million and $180.1 million during the years ended December 31, 2024 and December 31, 2023, respectively. Cash outflows from investing activities include capital expenditures of $245.5 million and $225.6 million for the years ended December 31, 2024 and December 31, 2023, respectively.
57
During the year ended December 31, 2023, cash flows used in investing activities also included proceeds from the sale of our investment in Saudi Cinema Company LLC of $30.0 million and proceeds from the disposition of long-term assets of $16.5 million, partially offset by outflows for the acquisition of theatre assets of $4.0 million.
We fund the costs of constructing, maintaining and remodeling our theatres through existing cash balances, cash generated from operations, landlord contributions, or capital raised, as necessary. We generally lease our theatres pursuant to long-term, non-cancelable operating leases, which may require the developer who owns the property, to reimburse us for the construction costs. We estimate that our cash outflows for capital expenditures, net of landlord contributions, will be approximately $175 million to $225 million for the year ending December 31, 2025 to maintain and enhance operations.
Cash Flows from Financing Activities
Net cash provided by financing activities, as reflected in the consolidated statements of cash flows, were $68.4 million and $649.3 million, during the years ended December 31, 2024 and December 31, 2023, respectively. Cash flows provided by financing activities during the year ended December 31, 2024, were primarily due to net proceeds from equity issuances of $254.9 million and proceeds from the issuance of New Term Loans of $27.0 million, partially offset by the repurchase of Second Lien Notes of $83.2 million, deferred debt issuance costs of $46.7 million, principal payments under Existing Term Loans of $27.0 million, the repurchase of Senior Subordinated Notes due 2025 of $14.8 million, the repurchase of Senior Subordinated Notes due 2026 of $6.0 million, principal payments under the Senior Subordinated Notes due 2024 of $5.0 million, principal payments under term loan borrowings of $20.1 million, and taxes paid for restricted unit withholdings of $2.2 million. See Note 8—Corporate Borrowings and Finance Lease Liabilities and Note 9—Stockholders’ Deficit in the Notes to the Financial Statements under Part II, Item 8 of this Form 10-K for further information, including a summary of principal payments required and maturities of corporate borrowings as of December 31, 2024.
Cash flows provided by financing activities during the year ended December 31, 2023, were primarily due to net proceeds from equity issuances of $832.7 million, partially offset by the repurchase of Second Lien Notes for $139.9 million, and tax paid for restricted unit withholdings of $14.2 million.
Dividends
The payment of future dividends is subject to our Board of Directors’ discretion, and dependent on many considerations, including limitations imposed by covenants in the agreements governing our indebtedness, operating results, capital requirements, strategic considerations and other factors.
Future Contractual Obligations
Our estimated future obligations as of December 31, 2024 include both current and long-term obligations. Our expected material contractual cash requirements over the next twelve months primarily consist of capital related betterments of $28.9 million, minimum operating lease payments of $911.2 million, finance lease payments of $7.4 million, and corporate borrowings principal and interest payments of $64.2 million and $374.7 million, respectively.
Pension funding. Our U.S., UK, and Sweden defined benefit plans are frozen. We fund our U.S. pension plans such that the plans are in compliance with Employee Retirement Income Security Act (“ERISA”) and the plans are not considered “at risk” as defined by ERISA guidelines. We expect to make $2.4 million of contributions to the defined pension plans during the year ended December 31, 2025.
Obligation for unrecognized tax benefits. As of December 31, 2024, our recorded obligation for unrecognized tax benefits is $5.5 million. There are currently $0.1 million of unrecognized tax benefits which we anticipate will be resolved in the next twelve months. See Note 10—Income Taxes in the Notes to Consolidated Financial Statements under Part II, Item 8 of this Form 10-K for further information.
Minimum operating lease and finance lease payments. We have current and long-term minimum cash requirements for operating lease payments of $911.2 million and $5,264.5 million, respectively. We have current and long-term minimum cash requirements for finance lease payments of $7.4 million and $67.6 million, respectively. The total amounts do not equal the carrying amount due to imputed interest. See Note 3—Leases in the Notes to the Consolidated Financial Statements under Part II, Item 8 of this Form 10-K, for a summary of the estimated future repayment terms for the minimum operating lease and finance lease amounts.
58
Corporate borrowings principal and interest payments. We have current and long-term cash requirements for the payment of principal related to corporate borrowings of $64.2 million and $4,070.3 million, respectively. The total amount does not equal the carrying amount due to unamortized discounts, premiums and deferred charges. Based upon the December 31, 2024 outstanding principal balances and interest rates, we have current and long-term cash interest payment requirements related to our corporate borrowings of $374.7 million and $1,127.4 million, respectively. The cash interest payment requirements for our New Term Loans was estimated at 11.356% based on the interest rate in effect as of December 31, 2024. In 2025, we assume that we will pay interest on the Exchangeable Notes in-kind in the form of additional Exchangeable Notes.
See Note 8—Corporate Borrowings and Finance Lease Liabilities in the Notes to the Consolidated Financial Statements under Part II, Item 8 of this Form 10-K for further information, including a schedule of outstanding principal balances, applicable interest rates, and maturity dates for each individual borrowing and a schedule of required principal payments and maturities of corporate borrowings as of December 31, 2024.
Covenant Compliance
As of December 31, 2024, we believe that we were in full compliance with all agreements, including related covenants, governing our outstanding debt.
Liquidity and Capital Resources—For the Year Ended December 31, 2023, Compared to the Year Ended December 31, 2022
For a comparison of our liquidity and capital resources for the year ended December 31, 2023, compared to the year ended December 31, 2022, see “Part II, Item 7. Management’s Discussion and Analysis of Financial Condition and Results of Operations” of our annual report on Form 10-K for the year ended December 31, 2023, filed with the Securities and Exchange Commission on February 28, 2024, which is incorporated herein by reference.
New Accounting Pronouncements
See Note 1—The Company and Significant Accounting Policies in the Notes to the Consolidated Financial Statements under Part II, Item 8 of this Form 10-K for information regarding recently issued accounting standards.
Formation of Unrestricted Subsidiaries
On July 22, 2024, American-Multi Cinema Inc. (“Multi-Cinema”), a Missouri corporation and a direct subsidiary of Holdings, assigned or transferred the net assets (“Theatre Net Assets”) of 175 theatres and transferred a 100% interest in certain intellectual property assets to its direct subsidiary Centertainment Development, LLC (“Centertainment”), and the Theatre Net Assets were in turn transferred to Centertainment’s direct wholly-owned subsidiary Muvico, LLC (“Muvico”), a newly formed Texas limited liability company. Theatre Net Assets include lease contracts and theatre property, including furniture, fixtures, plant and equipment, and other working capital items associated directly with the theatre locations. At the same time, Muvico licensed the intellectual property back to Multi-Cinema for its continued use in the operation of its retained theatres and entered into a management agreement for Multi-Cinema to operate the theatres transferred to Muvico. Muvico and Centertainment (collectively, the “Muvico Group”) are unrestricted subsidiaries under the indenture governing Holdings’ Existing First Lien Notes.
Unrestricted Subsidiaries’ Financial Information and Operating Metrics
Pursuant to the indenture governing Holdings’ Existing First Lien Notes, the indenture governing Muvico’s Exchangeable Notes, and the New Term Loan Credit Agreement governing Holdings’ and Muvico’s New Term Loans, we are presenting the following financial information and operating metrics for the Muvico Group separately from Holdings and its restricted subsidiaries (the “Restricted Subsidiaries” and collectively with Holdings, the “AMC Group”). AMC Theatres of UK Limited, which is an unrestricted subsidiary under the indenture governing Holdings’ Existing First Lien Notes has been included with the Restricted Subsidiaries for the purposes of the following presentation of financial information and operating metrics (this subsidiary is individually immaterial). The financial information presented for AMC Group and Muvico Group is presented on a standalone basis with discrete identification of the assets, liabilities, revenues and expenses associated with the Theatre Net Assets that were transferred to Muvico. Intercompany transactions between entities within the AMC Group or within the Muvico Group have been eliminated. Certain entities within the AMC Group and within the Muvico Group are parties to intercompany management, licensing, and debt agreements with each other. These transactions are reflected discretely within the columnar
59
presentation below and are properly eliminated upon consolidation. The financial information is also prepared using the historical cost carrying values of Holdings, the top parent entity.
Holdings and Muvico are co-borrowers and joint and severally liable for the New Term Loan borrowings. Pursuant to ASC 405-40 we have allocated fifty percent (50%) of the liabilities, interest expense and cash flows each to Muvico and Holdings, respectively. The basis of this allocation is the amount we expect each party to pay.
Year Ended December 31, 2024 |
||||||||||||
AMCEH & |
||||||||||||
Restricted |
Muvico Group |
|||||||||||
Subsidiaries/AMC |
Unrestricted |
|||||||||||
Group (1) |
Subsidiaries (2) |
Eliminations |
||||||||||
(In millions) |
|
(unaudited) |
(unaudited) |
(unaudited) |
Consolidated |
|||||||
Revenues |
||||||||||||
Admissions |
$ |
2,184.9 |
$ |
375.6 |
$ |
— |
$ |
2,560.5 |
||||
Food and beverage |
1,427.3 |
197.6 |
— |
1,624.9 |
||||||||
Other theatre (4) |
424.4 |
44.5 |
(17.1) |
451.8 |
||||||||
Total revenues |
4,036.6 |
617.7 |
(17.1) |
4,637.2 |
||||||||
Operating costs and expenses |
||||||||||||
Film exhibition costs |
1,043.1 |
196.1 |
— |
1,239.2 |
||||||||
Food and beverage costs |
272.8 |
32.8 |
— |
305.6 |
||||||||
Operating expense, excluding depreciation and amortization below |
1,481.4 |
198.0 |
— |
1,679.4 |
||||||||
Rent |
775.4 |
98.2 |
— |
873.6 |
||||||||
General and administrative: |
||||||||||||
Merger, acquisition and other costs |
0.1 |
— |
— |
0.1 |
||||||||
Other, excluding depreciation and amortization below (4) |
233.9 |
10.0 |
(17.1) |
226.8 |
||||||||
Depreciation and amortization |
285.2 |
34.3 |
— |
319.5 |
||||||||
Impairment of long-lived assets |
67.1 |
5.2 |
— |
72.3 |
||||||||
Operating costs and expenses |
4,159.0 |
574.6 |
(17.1) |
4,716.5 |
||||||||
Operating income (loss) |
(122.4) |
43.1 |
— |
(79.3) |
||||||||
Other expense, net: |
||||||||||||
Other income |
(80.4) |
(75.8) |
— |
(156.2) |
||||||||
Interest expense: |
||||||||||||
Corporate borrowings |
327.9 |
73.9 |
— |
401.8 |
||||||||
Finance lease obligations |
5.4 |
— |
— |
5.4 |
||||||||
Intercompany interest expense |
1.8 |
5.8 |
(7.6) |
— |
||||||||
Non-cash NCM exhibitor services agreement |
36.5 |
— |
— |
36.5 |
||||||||
Intercompany interest expense (income) |
(5.8) |
(1.8) |
7.6 |
— |
||||||||
Investment income |
(11.8) |
(4.5) |
— |
(16.3) |
||||||||
Total other expense (income), net |
273.6 |
(2.4) |
— |
271.2 |
||||||||
Earnings (loss) before income taxes |
(396.0) |
45.5 |
— |
(350.5) |
||||||||
Income tax provision (3) |
2.1 |
— |
— |
2.1 |
||||||||
Net earnings (loss) |
$ |
(398.1) |
$ |
45.5 |
$ |
— |
$ |
(352.6) |
||||
60
Year Ended December 31, 2024 |
|||||||||
AMCEH & |
|||||||||
Restricted |
Muvico Group |
||||||||
Subsidiaries/AMC |
Unrestricted |
||||||||
Group (1) |
Subsidiaries (2) |
||||||||
(unaudited) |
(unaudited) |
Consolidated |
|||||||
Net earnings (loss) |
$ |
(398.1) |
$ |
45.5 |
$ |
(352.6) |
|||
Other comprehensive loss: |
|||||||||
Unrealized foreign currency translation adjustments |
(55.6) |
— |
(55.6) |
||||||
Pension adjustments: |
|||||||||
Net gain arising during the period |
1.8 |
— |
1.8 |
||||||
Other comprehensive loss: |
(53.8) |
— |
(53.8) |
||||||
Total comprehensive loss |
$ |
(451.9) |
$ |
45.5 |
$ |
(406.4) |
|||
| (1) | This column provides the information required to be presented for (i) Holdings and its Restricted Subsidiaries under the indentures governing the Exchangeable Notes and Existing First Lien Notes and (ii) AMC Group under the New Term Loan Credit Agreement. Transactions between Holdings and its restricted subsidiaries have been eliminated. |
| (2) | The amounts presented for Muvico are from its inception on July 22, 2024 through the end of the reporting period. |
| (3) | Muvico is a disregarded entity for federal and state income tax purposes with all tax expense and deferred taxes recorded at the AMC Group level. |
| (4) | Includes intercompany management fee revenues of $10.0 million recorded by AMCEH & Restricted Subsidiaries/AMC Group and intercompany license fee revenues of $7.1 million recorded by Muvico Group Unrestricted Subsidiaries. Corresponding amounts of expense are included in General and Administrative: Other for Muvico Group Unrestricted Subsidiaries and AMCEH & Restricted Subsidiaries/AMC Group. The amounts presented are from Muvico inception on July 22, 2024 through the end of the reporting period. |
Year Ended December 31, 2024 |
|||||||||
AMCEH & |
|||||||||
Restricted |
Muvico Group |
||||||||
Subsidiaries/AMC |
Unrestricted |
||||||||
Group (3) |
Subsidiaries (4) |
Consolidated |
|||||||
Key operating metrics: |
(unaudited) |
(unaudited) |
(unaudited) |
||||||
Average ticket price |
|
$ |
11.17 |
$ |
13.14 |
$ |
11.42 |
||
Attendance (in thousands) (1) |
195,573 |
28,582 |
224,155 |
||||||
Number of screens operated (2) |
|
7,559 |
2,239 |
9,798 |
|||||
Number of theatres operated (2) |
|
698 |
173 |
871 |
|||||
Adjusted EBITDA (5) |
|
$ |
260.3 |
$ |
83.6 |
$ |
343.9 |
||
| (1) | Includes consolidated theatres only and excludes screens offline due to construction. |
| (2) | The screens and theatres of the Muvico Group are operated by Multi-Cinema pursuant to the management agreement. |
| (3) | This column provides the information required to be presented for (i) Holdings and its Restricted Subsidiaries under the indentures governing the Exchangeable Notes and Existing First Lien Notes and (ii) AMC Group under the New Term Loan Credit Agreement. |
| (4) | The amounts presented for Muvico are from its inception on July 22, 2024 through the end of the reporting period. |
61
| (5) | Below is a reconciliation of net earnings (loss) to Adjusted EBITDA for AMCEH & Restricted Subsidiaries/AMC Group and Muvico Group. The reconciling items below have the same definitions and are of the same nature as the reconciling items presented previously in Management’s Discussion and Analysis section of this Form 10-K. |
Year Ended December 31, 2024 |
||||||||||||
AMCEH & |
||||||||||||
Restricted |
Muvico Group |
|||||||||||
Subsidiaries/AMC |
Unrestricted |
|||||||||||
Group (1) |
Subsidiaries (2) |
Eliminations |
||||||||||
(unaudited) |
(unaudited) |
(unaudited) |
Consolidated |
|||||||||
Net earnings (loss) |
$ |
(398.1) |
$ |
45.5 |
$ |
— |
$ |
(352.6) |
||||
Plus: |
||||||||||||
Income tax provision |
|
2.1 |
|
— |
— |
|
2.1 |
|||||
Interest expense (income) |
|
371.6 |
|
79.7 |
(7.6) |
|
443.7 |
|||||
Depreciation and amortization |
|
285.2 |
|
34.3 |
— |
|
319.5 |
|||||
Impairment of long-lived assets |
|
67.1 |
|
5.2 |
— |
|
72.3 |
|||||
Certain operating expense |
|
4.4 |
|
1.0 |
— |
|
5.4 |
|||||
Equity in earnings of non-consolidated entities |
|
(12.4) |
|
— |
— |
|
(12.4) |
|||||
Attributable EBITDA |
1.9 |
— |
— |
1.9 |
||||||||
Investment expense (income) |
|
(17.6) |
|
(6.3) |
7.6 |
|
(16.3) |
|||||
Other income, net |
|
(66.0) |
|
(75.8) |
— |
|
(141.8) |
|||||
General and administrative — unallocated: |
||||||||||||
Merger, acquisition and other costs |
|
0.1 |
|
— |
— |
|
0.1 |
|||||
Stock-based compensation expense |
|
22.0 |
|
— |
— |
|
22.0 |
|||||
Adjusted EBITDA |
$ |
260.3 |
$ |
83.6 |
$ |
— |
$ |
343.9 |
||||
| (1) | This column provides the information required to be presented for (i) Holdings and its Restricted Subsidiaries under the indentures governing the Exchangeable Notes and Existing First Lien Notes and (ii) AMC Group under the New Term Loan Credit Agreement. |
| (2) | The amounts presented for Muvico are from its inception on July 22, 2024 through the end of the reporting period. |
62
As of December 31, 2024 |
||||||||||||
AMCEH & |
||||||||||||
Restricted |
Muvico Group |
|||||||||||
Subsidiaries/AMC |
Unrestricted |
|||||||||||
Group (3) |
Subsidiaries |
Eliminations |
||||||||||
(In millions, except share data) |
(unaudited) |
(unaudited) |
(unaudited) |
Consolidated |
||||||||
ASSETS |
||||||||||||
Current assets: |
||||||||||||
Cash and cash equivalents (1) |
$ |
339.7 |
$ |
292.6 |
$ |
— |
$ |
632.3 |
||||
Restricted cash |
48.5 |
— |
— |
48.5 |
||||||||
Receivables, net |
162.6 |
5.5 |
— |
168.1 |
||||||||
Other current assets |
58.1 |
40.2 |
— |
98.3 |
||||||||
Total current assets |
608.9 |
338.3 |
— |
947.2 |
||||||||
Property, net |
1,070.1 |
372.2 |
— |
1,442.3 |
||||||||
Operating lease right-of-use assets, net |
2,405.4 |
814.7 |
— |
3,220.1 |
||||||||
Intangible assets, net |
39.9 |
104.4 |
— |
144.3 |
||||||||
Goodwill |
2,301.1 |
— |
— |
2,301.1 |
||||||||
Other long-term assets |
191.8 |
0.7 |
— |
192.5 |
||||||||
Intercompany receivables (2) |
— |
1,416.5 |
(1,416.5) |
— |
||||||||
Investment in subsidiary |
619.7 |
— |
(619.7) |
— |
||||||||
Total assets |
$ |
7,236.9 |
$ |
3,046.8 |
$ |
(2,036.2) |
$ |
8,247.5 |
||||
LIABILITIES AND STOCKHOLDERS’ DEFICIT |
||||||||||||
Current liabilities: |
||||||||||||
Accounts payable |
$ |
337.2 |
$ |
41.1 |
$ |
— |
$ |
378.3 |
||||
Accrued expenses and other liabilities |
311.6 |
29.0 |
— |
340.6 |
||||||||
Deferred revenues and income |
430.5 |
1.9 |
— |
432.4 |
||||||||
Current maturities of corporate borrowings |
54.2 |
10.0 |
— |
64.2 |
||||||||
Current maturities of finance lease liabilities |
4.4 |
— |
— |
4.4 |
||||||||
Current maturities of operating lease liabilities |
380.1 |
144.8 |
— |
524.9 |
||||||||
Total current liabilities |
1,518.0 |
226.8 |
— |
1,744.8 |
||||||||
Corporate borrowings |
2,591.8 |
1,419.1 |
— |
4,010.9 |
||||||||
Finance lease liabilities |
44.9 |
— |
— |
44.9 |
||||||||
Operating lease liabilities |
2,849.7 |
777.9 |
— |
3,627.6 |
||||||||
Exhibitor services agreement |
464.0 |
— |
— |
464.0 |
||||||||
Deferred tax liability, net (4) |
33.9 |
— |
— |
33.9 |
||||||||
Intercompany payables (2) |
1,416.5 |
— |
(1,416.5) |
— |
||||||||
Other long-term liabilities |
78.6 |
3.3 |
— |
81.9 |
||||||||
Total liabilities |
8,997.4 |
2,427.1 |
(1,416.5) |
10,008.0 |
||||||||
Commitments and contingencies |
||||||||||||
Stockholders’ deficit: |
||||||||||||
AMC Entertainment Holdings, Inc.'s stockholders' deficit: |
||||||||||||
Preferred stock |
— |
— |
— |
— |
||||||||
Class A common stock |
4.1 |
— |
— |
4.1 |
||||||||
Additional paid-in capital |
6,714.2 |
558.3 |
(558.3) |
6,714.2 |
||||||||
Accumulated other comprehensive loss |
(132.0) |
— |
— |
(132.0) |
||||||||
Accumulated deficit |
(8,346.8) |
61.4 |
(61.4) |
(8,346.8) |
||||||||
Total stockholders' deficit |
(1,760.5) |
619.7 |
(619.7) |
(1,760.5) |
||||||||
Total liabilities and stockholders’ deficit |
$ |
7,236.9 |
$ |
3,046.8 |
$ |
(2,036.2) |
$ |
8,247.5 |
||||
| (1) | The cash held in bank accounts differs from the book balance due to deposits in transit, payments in transit, and certain cash equivalents. |
| (2) | Intercompany receivables (payables) includes intercompany loans, fees receivable/payable pursuant to the management agreement and intellectual property license agreement, the intercompany receivable/payable created by allocating the New Term Loans borrowings between Holdings and Muvico, and other intercompany balances created due to the Refinancing Transactions. |
| (3) | This column provides the information required to be presented for (i) Holdings and its Restricted Subsidiaries under the indentures governing the Exchangeable Notes and Existing First Lien Notes and (ii) AMC Group under the New Term Loan Credit Agreement. |
63
| (4) | Muvico is a disregarded entity for federal and state income tax purposes with all tax expense and deferred taxes recorded at the AMC Group level. |
Year Ended December 31, 2024 |
|||||||||
AMCEH & |
|||||||||
Restricted |
Muvico Group |
||||||||
Subsidiaries/AMC |
Unrestricted |
||||||||
Group (1) |
Subsidiaries (2) |
||||||||
(unaudited) |
(unaudited) |
Consolidated |
|||||||
Net (loss) earnings |
$ |
(398.1) |
$ |
45.5 |
$ |
(352.6) |
|||
Adjustments to reconcile net (loss) earnings to net cash (used in) provided by operating activities: |
|||||||||
Depreciation and amortization |
285.2 |
34.3 |
319.5 |
||||||
Gain on extinguishment of debt |
(38.9) |
— |
(38.9) |
||||||
Gain on derivative liability |
— |
(75.8) |
(75.8) |
||||||
Deferred income taxes |
1.7 |
— |
1.7 |
||||||
Impairment of long-lived assets |
67.1 |
5.2 |
72.3 |
||||||
Unrealized loss on investments in Hycroft |
3.0 |
— |
3.0 |
||||||
Amortization of (premium) discount on corporate borrowings to interest expense |
(22.8) |
5.3 |
(17.5) |
||||||
Amortization of deferred financing costs to interest expense |
7.5 |
0.8 |
8.3 |
||||||
PIK interest expense |
— |
14.7 |
14.7 |
||||||
Non-cash portion of stock-based compensation |
22.0 |
— |
22.0 |
||||||
Equity in earnings from non-consolidated entities, net of distributions |
(1.6) |
— |
(1.6) |
||||||
Landlord contributions |
31.8 |
— |
31.8 |
||||||
Deferred rent |
(100.5) |
(5.6) |
(106.1) |
||||||
Net periodic benefit cost |
1.8 |
— |
1.8 |
||||||
Change in assets and liabilities: |
|||||||||
Receivables |
32.3 |
5.1 |
37.4 |
||||||
Other assets |
6.5 |
(17.2) |
(10.7) |
||||||
Accounts payable |
76.0 |
(15.9) |
60.1 |
||||||
Accrued expenses and other liabilities |
(8.8) |
(5.0) |
(13.8) |
||||||
Intercompany receivables and payables |
(40.2) |
40.2 |
— |
||||||
Other, net |
(5.5) |
(0.9) |
(6.4) |
||||||
Net cash (used in) provided by operating activities |
(81.5) |
30.7 |
(50.8) |
||||||
Cash flows from investing activities: |
|||||||||
Capital expenditures |
(219.4) |
(26.1) |
(245.5) |
||||||
Proceeds from disposition of long-term assets |
0.5 |
— |
0.5 |
||||||
Cash contributed to Muvico Group |
(3.9) |
3.9 |
— |
||||||
Other, net |
2.1 |
— |
2.1 |
||||||
Net cash used in investing activities |
(220.7) |
(22.2) |
(242.9) |
||||||
Cash flows from financing activities: |
|||||||||
Net proceeds from equity issuances |
254.9 |
— |
254.9 |
||||||
Proceeds from issuance of Term Loan due 2029 |
27.0 |
— |
27.0 |
||||||
Scheduled principal payments under Term Loan borrowings |
(15.0) |
(5.1) |
(20.1) |
||||||
Principal payments under Senior Subordinated Notes due 2024 |
(5.0) |
— |
(5.0) |
||||||
Principal payments under finance lease obligations |
(4.6) |
— |
(4.6) |
||||||
Repurchase of Senior Subordinated Notes due 2025 |
(14.8) |
— |
(14.8) |
||||||
Repurchase of Senior Subordinated Notes due 2026 |
(6.0) |
— |
(6.0) |
||||||
Repurchase of Second Lien Notes due 2026 |
(83.2) |
— |
(83.2) |
||||||
Principal payments under Term Loan due 2026 |
(27.0) |
— |
(27.0) |
||||||
Cash used to pay deferred financing costs |
(11.5) |
(35.2) |
(46.7) |
||||||
Debt extinguishment costs |
(3.9) |
— |
(3.9) |
||||||
Taxes paid for restricted unit withholdings |
(2.2) |
— |
(2.2) |
||||||
Proceeds (payments) of intercompany loans |
(313.1) |
313.1 |
— |
||||||
64
Net cash (used in) provided by financing activities |
(204.4) |
272.8 |
68.4 |
||||||
Effect of exchange rate changes on cash and cash equivalents and restricted cash |
(5.3) |
— |
(5.3) |
||||||
Net increase (decrease) in cash and cash equivalents and restricted cash |
(511.9) |
281.3 |
(230.6) |
||||||
Cash and cash equivalents and restricted cash at beginning of period |
900.1 |
11.3 |
911.4 |
||||||
Cash and cash equivalents and restricted cash at end of period |
$ |
388.2 |
$ |
292.6 |
$ |
680.8 |
| (1) | This column provides the information required to be presented for (i) Holdings and its Restricted Subsidiaries under the indentures governing the Exchangeable Notes and Existing First Lien Notes and (ii) AMC Group under the New Term Loan Credit Agreement. |
| (2) | The amounts presented for Muvico are from its inception on July 22, 2024 through the end of the reporting period. |
Item 7A. Quantitative and Qualitative Disclosures about Market Risk.
In the ordinary course of business, our financial results are exposed to fluctuations in interest rates and foreign currency exchange rates. In accordance with applicable guidance, we presented a sensitivity analysis showing the potential impact to net income of changes in interest rates and foreign currency exchange rates. For the years ended December 31, 2024 and December 31, 2023, our analysis utilized a hypothetical 100 basis-point increase or decrease to the average interest rate on our variable rate debt instruments to illustrate the potential impact to interest expense of changes in interest rates and a hypothetical 100 basis-point increase or decrease to market interest rates on our fixed rate debt instruments to illustrate the potential impact to fair value of changes in interest rates.
Similarly, for the same period, our analysis used a uniform and hypothetical 10% increase in foreign currency translation rates to depict the potential impact to net income of changes in foreign currency translation rates. These market risk instruments and the potential impacts to the consolidated statements of operations as presented below.
Market risk on variable-rate financial instruments. As of December 31, 2024, we had an aggregate of $2,014.2 million outstanding principal amount of our New Term Loans which bear interest, at our option, at rates equal to either (i) a base rate plus a margin of between 500 and 600 basis points depending on the total leverage ratio of the Company and its subsidiaries on a consolidated basis (the “Total Leverage Ratio”) or (ii) Term SOFR plus a margin of between 600 and 700 basis points depending on the Total Leverage Ratio.
Prior to the Refinancing Transactions we had outstanding Existing Term Loans under the Credit Agreement dated April 30, 2013 (as amended, restated, amended and restated, supplemented or otherwise modified) which bore interest at a rate per annum equal to, at our option, either (1) a base rate determined by reference to the highest of (a) 0.50% per annum plus the Federal Funds Effective Rate, (b) the prime rate announced by the administrative agent and (c) 1.00% per annum plus Adjusted Term SOFR (as defined below) for a 1-month tenor or (2) Term SOFR plus a credit spread adjustment of 0.11448% per annum, 0.26161% per annum, and 0.42826% per annum for interest periods of one-month, three-months, or six-months or longer, respectively (“Adjusted Term SOFR”) plus (x) in the case of the Existing Term Loans, 2.0% for base rate loans or 3.0% for SOFR loans.
The rate in effect for the outstanding New Term Loans was 11.356% per annum at December 31, 2024, and 8.474% per annum for the Existing Term Loans at December 31, 2023.
Increases in market interest rates would cause interest expense to increase and earnings before income taxes to decrease. The change in interest expense and earnings before income taxes would be dependent upon the weighted average outstanding borrowings during the reporting period following an increase in market interest rates. A 100-basis point change in market interest rates would have increased or decreased interest expense on the New Term Loans by approximately $20.1 million during the year ended December 31, 2024.
65
At December 31, 2023, we had an aggregate principal balance of $1,905.0 million outstanding under the Existing Term Loans. A 100-basis point change in market interest rates would have increased or decreased interest expense on our Existing Term Loans by $19.1 million during the year ended December 31, 2023.
Market risk on fixed-rate financial instruments. Included in corporate borrowings as of December 31, 2024 were principal amounts of $427.6 million of our Exchangeable Notes, $950.0 million of our Existing First Lien Notes, $131.2 million of our Second Lien Notes, $400.0 million of our 12.75% Odeon Senior Secured Notes due 2027 (“Odeon Notes due 2027”), $44.1 million of our 5.75% Senior Subordinated Notes due 2025 (“Senior Subordinated Notes due 2025”), $41.9 million of our 5.875% Senior Subordinated Notes due 2026 (“Senior Subordinated Notes due 2026”), and $125.5 million of our 6.125% Senior Subordinated Notes due 2027 (“Senior Subordinated Notes due 2027”). A 100-basis point change in market interest rates would have caused an increase or (decrease) in the fair value of our fixed rate financial instruments of approximately $65.6 million and $(62.9) million, respectively, during the year ended December 31, 2024.
Included in corporate borrowings as of December 31, 2023 were principal amounts of $950.0 million of our Existing First Lien Notes, $968.9 million of our Second Lien Notes, $400.0 million of our Odeon Notes due 2027, $98.3 million of our Senior Subordinated Notes due 2025, $51.5 million of our Senior Subordinated Notes due 2026, $125.5 million of our Senior Subordinated Notes due 2027, and £4.0 million ($5.1 million) of our Sterling Notes due 2024. A 100-basis point change in market interest rates would have caused an increase or (decrease) in the fair value of our fixed rate financial instruments of approximately $59.7 million and $(57.5) million, respectively, during the year ended December 31, 2023.
Foreign currency exchange rate risk. We are also exposed to market risk arising from changes in foreign currency exchange rates arising from our International markets operations. International markets revenues and operating expenses are transacted in British Pounds, Euros, Swedish Krona and Norwegian Krone. U.S. GAAP requires that our subsidiaries use the currency of the primary economic environment in which they operate as their functional currency. If any international subsidiary operates in a highly inflationary economy, U.S. GAAP requires that the U.S. dollar be used as the functional currency. Currency fluctuations in the countries in which we operate result in us reporting exchange gains (losses) or foreign currency translation adjustments. Based upon the functional currencies in the International markets as of December 31, 2024, holding everything else constant, a hypothetical 10% increase in foreign currency translation rates to depict the potential impact to net loss from changes in foreign exchange rates would increase the aggregate net loss of our International theatres for the year ended December 31, 2024 by approximately $9.0 million. Based upon the functional currencies in the International markets as of December 31, 2023, holding everything else constant, a hypothetical 10% increase in foreign currency translation rates to depict the potential impact to net loss of changes in foreign exchange rates would increase the aggregate net loss of our International theatres for the year ended December 31, 2023 by approximately $10.9 million.
Our foreign currency translation rates increased by approximately 0.7% for the year ended December 31, 2024 compared to the year ended December 31, 2023.
66
Item 8. Financial Statements and Supplementary Data.
MANAGEMENT’S ANNUAL REPORT ON INTERNAL CONTROL OVER FINANCIAL REPORTING
AMC Entertainment Holdings, Inc.
TO THE STOCKHOLDERS OF AMC ENTERTAINMENT HOLDINGS, INC.
Management is responsible for establishing and maintaining adequate internal control over financial reporting for the Company as defined in Rule 13a-15(f) of the Exchange Act. With management’s participation, an evaluation of the effectiveness of internal control over financial reporting was conducted as of December 31, 2024, based on the framework and criteria established in Internal Control—Integrated Framework (2013) issued by the Committee of Sponsoring Organizations of the Treadway Commission. Based on this evaluation, management has concluded that the Company’s internal control over financial reporting was effective as of December 31, 2024. The effectiveness of our internal control over financial reporting has been audited by Ernst & Young LLP, an independent registered public accounting firm, as stated in their attestation report that follows this report.
/s/ Adam M. Aron |
|
Chairman of the Board, Chief Executive Officer and President |
|
/s/ SEAN D. GOODMAN |
|
Executive Vice President, International Operations, Chief Financial Officer and Treasurer |
67
Report of Independent Registered Public Accounting Firm
To the Stockholders and the Board of Directors of AMC Entertainment Holdings, Inc.
Opinion on the Financial Statements
We have audited the accompanying consolidated balance sheets of AMC Entertainment Holdings, Inc. (the Company) as of December 31, 2024 and 2023, the related consolidated statements of operations, comprehensive loss, stockholders’ deficit, and cash flows for each of the three years in the period ended December 31, 2024, and the related notes (collectively referred to as the “consolidated financial statements”). In our opinion, the consolidated financial statements present fairly, in all material respects, the financial position of the Company at December 31, 2024 and 2023, and the results of its operations and its cash flows for each of the three years in the period ended December 31, 2024, in conformity with U.S. generally accepted accounting principles.
We also have audited, in accordance with the standards of the Public Company Accounting Oversight Board (United States) (PCAOB), the Company's internal control over financial reporting as of December 31, 2024, based on criteria established in Internal Control-Integrated Framework issued by the Committee of Sponsoring Organizations of the Treadway Commission (2013 framework) and our report dated February 25, 2025 expressed an unqualified opinion thereon.
Basis for Opinion
These financial statements are the responsibility of the Company's management. Our responsibility is to express an opinion on the Company’s financial statements based on our audits. We are a public accounting firm registered with the PCAOB and are required to be independent with respect to the Company in accordance with the U.S. federal securities laws and the applicable rules and regulations of the Securities and Exchange Commission and the PCAOB.
We conducted our audits in accordance with the standards of the PCAOB. Those standards require that we plan and perform the audit to obtain reasonable assurance about whether the financial statements are free of material misstatement, whether due to error or fraud. Our audits included performing procedures to assess the risks of material misstatement of the financial statements, whether due to error or fraud, and performing procedures that respond to those risks. Such procedures included examining, on a test basis, evidence regarding the amounts and disclosures in the financial statements. Our audits also included evaluating the accounting principles used and significant estimates made by management, as well as evaluating the overall presentation of the financial statements. We believe that our audits provide a reasonable basis for our opinion.
Critical Audit Matters
The critical audit matters communicated below are matters arising from the current period audit of the financial statements that were communicated or required to be communicated to the audit committee and that: (1) relate to accounts or disclosures that are material to the financial statements and (2) involved our especially challenging, subjective or complex judgments. The communication of critical audit matters does not alter in any way our opinion on the consolidated financial statements, taken as a whole, and we are not, by communicating the critical audit matters below, providing separate opinions on the critical audit matters or on the accounts or disclosures to which they relate.
Impairment of long-lived assets |
||
Description of the Matter |
For the year ended December 31, 2024, the Company recorded impairment charges related to long-lived assets of $51.9 million and $20.4 million on theatres in the US and International markets, respectively. As discussed in Note 1 to the consolidated financial statements, the Company evaluates its long-lived assets for impairment whenever events or changes in circumstances indicate that the carrying amount of the asset group may not be fully recoverable. Asset groups are evaluated for impairment on an individual theatre basis, which management believes is the lowest level for which there are identifiable cash flows. The |
68
|
Company estimates the future undiscounted cash flows to be generated by the asset groups and compares those estimates to the carrying value of the related asset groups. If the carrying value exceeds the future undiscounted cash flows, the asset group may be impaired. If the asset is determined to be impaired, the carrying value of the asset group is reduced to fair value as estimated by a discounted cash flow model, with the difference recorded as an impairment charge.
Auditing management’s long-lived asset impairment analysis was highly judgmental due to the estimation required in determining the undiscounted cash flows and related fair values of an impaired asset group. In particular, the cash flows were sensitive to significant assumptions such as admissions revenue expectations, long term growth rates, and discount rates. |
||
How We Addressed the Matter in Our Audit |
We obtained an understanding, evaluated the design and tested the operating effectiveness of controls over the Company’s assessment of the projected undiscounted cash flows to be generated by asset groups, and cash flows used to determine fair value for certain asset groups. This included internal controls over management’s review of the significant assumptions underlying the undiscounted cash flow and fair value determination. We also tested management’s controls to validate that the data used in the analysis was complete and accurate.
To test the significant assumptions described above, we performed audit procedures that included testing the significant assumptions discussed above and the underlying data used by the Company in the analysis. We compared the significant assumptions used by the Company to current industry and economic trends. We performed a sensitivity analysis of the impact of certain assumptions on the estimates and recalculated management’s estimates. We also involved our valuation specialists to assist in our evaluation of the discount rate used in the fair value estimates. |
|
Initial Recognition of Exchangeable Notes and Related Features |
||
Description of the Matter |
In connection with the Company’s completion of a series of refinancing transactions (“Refinancing Transactions”) on July 22, 2024, the Company issued $414.4 million aggregate principal amount of new Exchangeable Notes, which include certain embedded conversion features that are required to be bifurcated from the Exchangeable Notes and measured at fair value at the end of each reporting period. The fair value of the derivative liability associated with the embedded conversion feature was $233.4 million on July 22, 2024.
As discussed in Note 12 to the consolidated financial statements, the Company estimates the fair value of the derivative liability using a Binomial Lattice approach. The inputs used to value the derivative liability include the Company’s common stock price, the volatility of the stock price, time to maturity, risk-free interest rate, credit spread, and the discount yield.
Auditing the Company’s accounting for the embedded conversion features was challenging given the complexity of the underlying accounting framework for analyzing the embedded features and the complexity of the underlying fair value methodology, which includes various assumptions that exhibit a higher degree of subjectivity.
|
|
How We Addressed the Matter in Our Audit |
We obtained an understanding, evaluated the design, and tested the operating effectiveness of controls over the Company’s assessment of the embedded features of the Exchangeable Notes as well as the Company’s controls over the initial valuation of the derivative liability. This included internal controls over management’s review of the significant assumptions of the fair value determination. We also tested management’s controls to validate that the data used in the fair value calculation was complete and accurate.
To test management’s analysis of the embedded features and initial valuation of the bifurcated conversion features described above, we performed audit procedures that included reviewing, with the assistance of professionals in our firm with expertise in this area, the contractual agreements to understand the nature of the embedded features and the Company’s application of the various provisions of ASC 815 that govern the evaluation of whether embedded features |
69
|
require bifurcation. We also leveraged our valuation professionals to assist us in evaluating the appropriateness of the methods and models used by management to estimate the initial fair value of the derivative liability as well as the key assumptions used in the valuation. We also tested the completeness and accuracy of the underlying data used to estimate the fair value of the derivative liability.
|
/s/
We have served as the Company’s auditor since 2020
February 25, 2025
70
Report of Independent Registered Public Accounting Firm
To the Stockholders and the Board of Directors of AMC Entertainment Holdings, Inc.
Opinion on Internal Control Over Financial Reporting
We have audited AMC Entertainment Holdings, Inc.’s internal control over financial reporting as of December 31, 2024, based on criteria established in Internal Control—Integrated Framework issued by the Committee of Sponsoring Organizations of the Treadway Commission (2013 framework) (the COSO criteria). In our opinion, AMC Entertainment Holdings, Inc. (the Company) maintained, in all material respects, effective internal control over financial reporting as of December 31, 2024, based on the COSO criteria.
We also have audited, in accordance with the standards of the Public Company Accounting Oversight Board (United States) (PCAOB), the consolidated balance sheets of the Company as of December 31, 2024 and 2023, the related consolidated statements of operations, comprehensive loss, stockholders’ deficit, and cash flows for each of the three years in the period ended December 31, 2024, and the related notes and our report dated February 25, 2025 expressed an unqualified opinion thereon.
Basis for Opinion
The Company’s management is responsible for maintaining effective internal control over financial reporting and for its assessment of the effectiveness of internal control over financial reporting included in the accompanying Management’s Annual Report on Internal Control over Financial Reporting. Our responsibility is to express an opinion on the Company’s internal control over financial reporting based on our audit. We are a public accounting firm registered with the PCAOB and are required to be independent with respect to the Company in accordance with the U.S. federal securities laws and the applicable rules and regulations of the Securities and Exchange Commission and the PCAOB.
We conducted our audit in accordance with the standards of the PCAOB. Those standards require that we plan and perform the audit to obtain reasonable assurance about whether effective internal control over financial reporting was maintained in all material respects.
Our audit included obtaining an understanding of internal control over financial reporting, assessing the risk that a material weakness exists, testing and evaluating the design and operating effectiveness of internal control based on the assessed risk, and performing such other procedures as we considered necessary in the circumstances. We believe that our audit provides a reasonable basis for our opinion.
Definition and Limitations of Internal Control Over Financial Reporting
A company’s internal control over financial reporting is a process designed to provide reasonable assurance regarding the reliability of financial reporting and the preparation of financial statements for external purposes in accordance with generally accepted accounting principles. A company’s internal control over financial reporting includes those policies and procedures that (1) pertain to the maintenance of records that, in reasonable detail, accurately and fairly reflect the transactions and dispositions of the assets of the company; (2) provide reasonable assurance that transactions are recorded as necessary to permit preparation of financial statements in accordance with generally accepted accounting principles, and that receipts and expenditures of the company are being made only in accordance with authorizations of management and directors of the company; and (3) provide reasonable assurance regarding prevention or timely detection of unauthorized acquisition, use, or disposition of the company’s assets that could have a material effect on the financial statements.
Because of its inherent limitations, internal control over financial reporting may not prevent or detect misstatements. Also, projections of any evaluation of effectiveness to future periods are subject to the risk that controls may become inadequate because of changes in conditions, or that the degree of compliance with the policies or procedures may deteriorate.
/s/ Ernst & Young LLP
Kansas City, Missouri
February 25, 2025
71
AMC ENTERTAINMENT HOLDINGS, INC.
CONSOLIDATED STATEMENTS OF OPERATIONS
Year Ended |
||||||||||
(In millions, except share and per share amounts) |
|
|
December 31, 2024 |
|
December 31, 2023 |
|
December 31, 2022 |
|||
Revenues |
||||||||||
Admissions |
$ |
|
$ |
|
$ |
|
||||
Food and beverage |
|
|
|
|||||||
Other theatre |
|
|
|
|||||||
Total revenues |
|
|
|
|||||||
Operating costs and expenses |
||||||||||
Film exhibition costs |
|
|
|
|||||||
Food and beverage costs |
|
|
|
|||||||
Operating expense, excluding depreciation and amortization below |
|
|
|
|||||||
Rent |
|
|
|
|||||||
General and administrative: |
||||||||||
Merger, acquisition and other costs |
|
|
|
|||||||
Other, excluding depreciation and amortization below |
|
|
|
|||||||
Depreciation and amortization |
|
|
|
|||||||
Impairment of long-lived assets |
|
|
|
|||||||
Operating costs and expenses |
|
|
|
|||||||
Operating loss |
( |
( |
( |
|||||||
Other expense, net: |
||||||||||
Other expense (income) |
( |
( |
|
|||||||
Interest expense: |
||||||||||
Corporate borrowings |
|
|
|
|||||||
Finance lease obligations |
|
|
|
|||||||
Non-cash NCM exhibitor services agreement |
|
|
|
|||||||
Investment expense (income) |
( |
( |
|
|||||||
Total other expense, net |
|
|
|
|||||||
Loss before income taxes |
( |
( |
( |
|||||||
Income tax provision |
|
|
|
|||||||
Net loss |
$ |
( |
$ |
( |
$ |
( |
||||
Net loss per share: |
||||||||||
Basic and diluted |
$ |
( |
$ |
( |
$ |
( |
||||
Weighted average shares outstanding: |
||||||||||
Basic and diluted (in thousands) |
|
|
|
|||||||
See Notes to Consolidated Financial Statements.
72
AMC ENTERTAINMENT HOLDINGS, INC.
CONSOLIDATED STATEMENTS OF COMPREHENSIVE LOSS
Year Ended |
|||||||||
(In millions) |
|
December 31, 2024 |
|
December 31, 2023 |
|
December 31, 2022 |
|||
Net loss |
$ |
( |
$ |
( |
$ |
( |
|||
Other comprehensive loss: |
|||||||||
Unrealized foreign currency gain (loss) translation adjustments |
|
( |
|
|
|
( |
|||
Pension adjustments: |
|||||||||
Net gain (loss) arising during the period |
|
|
|
( |
|
|
|||
Other comprehensive loss |
|
( |
|
( |
|
( |
|||
Total comprehensive loss |
$ |
( |
$ |
( |
$ |
( |
|||
See Notes to Consolidated Financial Statements.
73
AMC ENTERTAINMENT HOLDINGS, INC.
CONSOLIDATED BALANCE SHEETS
(In millions, except share data) |
|
December 31, 2024 |
|
December 31, 2023 |
||
ASSETS |
||||||
Current assets: |
||||||
Cash and cash equivalents |
$ |
|
$ |
|
||
Restricted cash |
|
|
||||
Receivables, net |
|
|
|
|
||
Other current assets |
|
|
|
|
||
Total current assets |
|
|
|
|
||
Property, net |
|
|
|
|
||
Operating lease right-of-use assets, net |
|
|
||||
Intangible assets, net |
|
|
|
|
||
Goodwill |
|
|
|
|
||
Other long-term assets |
|
|
|
|
||
Total assets |
$ |
|
$ |
|
||
LIABILITIES AND STOCKHOLDERS’ DEFICIT |
||||||
Current liabilities: |
||||||
Accounts payable |
$ |
|
$ |
|
||
Accrued expenses and other liabilities |
|
|
|
|
||
Deferred revenues and income |
|
|
|
|
||
Current maturities of corporate borrowings |
|
|
|
|
||
Current maturities of finance lease liabilities |
|
|
||||
Current maturities of operating lease liabilities |
|
|
||||
Total current liabilities |
|
|
|
|
||
Corporate borrowings |
|
|
|
|
||
Finance lease liabilities |
|
|
||||
Operating lease liabilities |
|
|
||||
Exhibitor services agreement |
|
|
|
|
||
Deferred tax liability, net |
|
|
|
|
||
Other long-term liabilities |
|
|
|
|
||
Total liabilities |
|
|
|
|
||
Commitments and contingencies |
||||||
Stockholders’ deficit: |
||||||
AMC Entertainment Holdings, Inc.'s stockholders' deficit: |
||||||
Preferred stock, $ |
||||||
Class A common stock ($ |
|
|
|
|
||
Additional paid-in capital |
|
|
|
|
||
Accumulated other comprehensive loss |
|
( |
|
( |
||
Accumulated deficit |
|
( |
|
( |
||
Total stockholders' deficit |
( |
( |
||||
Total liabilities and stockholders’ deficit |
$ |
|
$ |
|
||
See Notes to Consolidated Financial Statements.
74
AMC ENTERTAINMENT HOLDINGS, INC.
CONSOLIDATED STATEMENTS OF CASH FLOWS
Year Ended |
|||||||||
December 31, |
December 31, |
December 31, |
|||||||
(In millions) |
2024 |
2023 |
2022 |
||||||
Cash flows from operating activities: |
|||||||||
Net loss |
$ |
( |
$ |
( |
$ |
( |
|||
Adjustments to reconcile net loss to net cash used in operating activities: |
|||||||||
Depreciation and amortization |
|
|
|
|
|
||||
(Gain) loss on extinguishment of debt |
|
( |
|
( |
|
||||
Gain on derivative liability |
( |
— |
— |
||||||
Deferred income taxes |
|
|
|
|
|
||||
Impairment of long-lived assets |
|
|
|
|
|
||||
Unrealized loss on investments in Hycroft |
|
|
|
||||||
Amortization of net premium on corporate borrowings to interest expense |
|
( |
|
( |
( |
||||
Amortization of deferred financing costs to interest expense |
|
|
|
||||||
PIK interest expense |
|
— |
— |
||||||
Non-cash portion of stock-based compensation |
|
|
|
|
|
||||
Gain on disposition of Saudi Cinema Company |
— |
( |
— |
||||||
Equity in (earnings) loss from non-consolidated entities, net of distributions |
|
( |
|
( |
|
||||
Landlord contributions |
|
|
|
||||||
Deferred rent |
( |
( |
( |
||||||
Net periodic benefit cost (income) |
|
|
( |
||||||
Non-cash shareholder litigation expense |
— |
|
— |
||||||
Change in assets and liabilities: |
|||||||||
Receivables |
|
|
|
( |
|
||||
Other assets |
|
( |
|
( |
|
||||
Accounts payable |
|
|
|
( |
( |
||||
Accrued expenses and other liabilities |
|
( |
|
( |
( |
||||
Other, net |
|
( |
|
( |
( |
||||
Net cash used in operating activities |
|
( |
|
( |
( |
||||
Cash flows from investing activities: |
|||||||||
Capital expenditures |
|
( |
|
( |
( |
||||
Acquisition of theatre assets |
— |
( |
( |
||||||
Proceeds from disposition of Saudi Cinema Company |
— |
|
— |
||||||
Proceeds from disposition of long-term assets |
|
|
|
|
|
||||
Proceeds from sale of securities |
— |
— |
|
||||||
Investments in non-consolidated entities, net |
|
— |
|
— |
( |
||||
Other, net |
|
|
|
|
( |
||||
Net cash used in investing activities |
|
( |
|
( |
( |
||||
Cash flows from financing activities: |
|||||||||
Net proceeds from equity issuances |
|
|
|
||||||
Proceeds from issuance of First Lien Notes due 2029 |
— |
— |
|
||||||
Proceeds from issuance of Odeon Senior Secured Notes due 2027 |
— |
— |
|
||||||
Proceeds from issuance of Term Loan due 2029 |
|
— |
— |
||||||
Scheduled principal payments under Term Loan borrowings |
( |
( |
|
( |
|||||
Principal payments under First Lien Notes due 2025 |
— |
— |
( |
||||||
Principal payments under First Lien Notes due 2026 |
— |
— |
( |
||||||
Principal payments under First Lien Toggle Notes due 2026 |
— |
— |
( |
||||||
Principal payments under Odeon Term Loan Facility |
— |
— |
( |
||||||
Principal payments under Senior Subordinated Notes due 2024 |
( |
— |
— |
||||||
Principal payments under finance lease obligations |
( |
( |
|
( |
|||||
Premium paid to extinguish First Lien Notes due 2025 |
— |
— |
( |
||||||
Premium paid to extinguish First Lien Notes due 2026 |
— |
— |
( |
||||||
Premium paid to extinguish First Lien Toggle Notes due 2026 |
— |
— |
( |
||||||
75
Premium paid to extinguish Odeon Term Loan Facility |
— |
— |
( |
||||||
Repurchase of Senior Subordinated Notes due 2025 |
( |
— |
— |
||||||
Repurchase of Senior Subordinated Notes due 2026 |
( |
( |
— |
||||||
Repurchase of Senior Subordinated Notes due 2027 |
— |
— |
( |
||||||
Repurchase of Second Lien Notes due 2026 |
( |
( |
( |
||||||
Principal payments under Term Loan due 2026 |
( |
— |
— |
||||||
Cash used to pay deferred financing costs |
( |
( |
|
( |
|||||
Debt extinguishment costs |
( |
— |
— |
||||||
Taxes paid for restricted unit withholdings |
|
( |
|
( |
( |
||||
Cash used to pay dividends |
— |
— |
( |
||||||
Net cash provided by (used in) financing activities |
|
|
|
|
( |
||||
Effect of exchange rate changes on cash and cash equivalents and restricted cash |
|
( |
|
|
( |
||||
Net increase (decrease) in cash and cash equivalents and restricted cash |
|
( |
|
|
( |
||||
Cash and cash equivalents and restricted cash at beginning of period |
|
|
|
|
|
||||
Cash and cash equivalents and restricted cash at end of period |
$ |
|
$ |
|
$ |
|
|||
SUPPLEMENTAL DISCLOSURES OF CASH FLOW INFORMATION: |
|||||||||
Cash paid during the period for: |
|||||||||
Interest |
$ |
|
$ |
|
$ |
|
|||
Income taxes paid, net |
$ |
|
$ |
|
|
||||
Schedule of non-cash activities: |
|||||||||
Investment in NCM |
$ |
— |
$ |
— |
$ |
|
|||
Construction payables at period end |
$ |
|
$ |
|
$ |
|
|||
Other third-party equity issuance costs payable |
$ |
|
$ |
|
$ |
|
|||
Deferred financing costs payable |
$ |
|
$ |
— |
$ |
— |
|||
Extinguishment of Second Lien Notes due 2026 in exchange for share issuance (1) |
$ |
|
$ |
|
$ |
— |
|||
Extinguishment of the 2025 Notes in exchange for share issuance (1) |
$ |
|
$ |
— |
$ |
— |
|||
Extinguishment of the 2026 Notes in exchange for share issuance (1) |
$ |
|
$ |
— |
$ |
— |
|||
Extinguishment of Second Lien Notes due 2026 in exchange for Term Loans due 2029 (1) |
$ |
|
$ |
— |
$ |
— |
|||
Extinguishment of principal amount of the Second Lien Notes due 2026 in exchange for Term Loan due 2029 (1) |
$ |
|
$ |
— |
$ |
— |
|||
Extinguishment of principal amount of the Second Lien Notes due 2026 in exchange for Exchangeable Notes due 2030 (1) |
$ |
|
$ |
— |
$ |
— |
| (1) |
See Notes to Consolidated Financial Statements.
76
AMC ENTERTAINMENT HOLDINGS, INC.
CONSOLIDATED STATEMENTS OF STOCKHOLDERS’ DEFICIT
Preferred Stock |
||||||||||||||||||||||||
Series A Convertible |
Depositary Shares |
Accumulated |
||||||||||||||||||||||
Participating |
of AMC |
Additional |
Other |
Total |
||||||||||||||||||||
Class A Common Stock |
Preferred Stock |
Preferred Equity |
Paid-in |
Comprehensive |
Accumulated |
Stockholders’ |
||||||||||||||||||
(In millions, except share and per share data) |
|
Shares (2) |
|
Amount |
|
Shares (1)(2) |
Units (1)(2) |
|
Amount |
Capital |
Loss |
|
Deficit |
|
Deficit |
|||||||||
Balance December 31, 2021 |
|
$ |
|
|
|
$ |
|
$ |
|
$ |
( |
$ |
( |
$ |
( |
|||||||||
Net loss |
— |
— |
— |
— |
— |
— |
— |
( |
( |
|||||||||||||||
Other comprehensive loss |
— |
— |
— |
— |
— |
— |
( |
— |
( |
|||||||||||||||
Share issuances |
— |
— |
|
|
— |
|
— |
— |
|
|||||||||||||||
Taxes paid for restricted unit withholdings |
— |
— |
— |
— |
— |
( |
— |
— |
( |
|||||||||||||||
Stock-based compensation |
|
— |
|
|
— |
|
— |
— |
|
|||||||||||||||
Balance December 31, 2022 |
|
$ |
|
|
|
$ |
|
$ |
|
$ |
( |
$ |
( |
$ |
( |
|||||||||
Net loss |
— |
— |
— |
— |
— |
— |
— |
( |
( |
|||||||||||||||
Other comprehensive loss |
— |
— |
— |
— |
— |
— |
( |
— |
( |
|||||||||||||||
Share issuances |
|
|
|
|
— |
|
— |
— |
|
|||||||||||||||
Antara Forward Purchase Agreement (3) |
— |
— |
|
|
— |
|
— |
— |
|
|||||||||||||||
AMC Preferred Equity Unit conversion |
|
|
( |
( |
( |
( |
— |
— |
— |
|||||||||||||||
Settlement payment |
|
|
— |
— |
— |
|
— |
— |
|
|||||||||||||||
Debt for equity exchange |
|
|
— |
— |
— |
|
— |
— |
|
|||||||||||||||
Taxes paid for restricted unit withholdings |
— |
— |
— |
— |
— |
( |
— |
— |
( |
|||||||||||||||
Stock-based compensation |
|
— |
|
|
— |
|
— |
— |
|
|||||||||||||||
Balance December 31, 2023 |
|
$ |
|
— |
— |
$ |
— |
$ |
|
$ |
( |
$ |
( |
$ |
( |
|||||||||
Net loss |
— |
— |
— |
— |
— |
— |
— |
( |
( |
|||||||||||||||
Other comprehensive loss |
— |
— |
— |
— |
— |
— |
( |
— |
( |
|||||||||||||||
Share issuances |
|
|
— |
— |
— |
|
— |
— |
|
|||||||||||||||
Forward purchase agreements |
|
|
— |
— |
— |
— |
— |
— |
|
|||||||||||||||
Debt for equity exchange |
|
|
— |
— |
— |
|
— |
— |
|
|||||||||||||||
Taxes paid for restricted unit withholdings |
— |
— |
— |
— |
— |
( |
— |
— |
( |
|||||||||||||||
Stock-based compensation (4) |
|
— |
— |
— |
— |
|
— |
— |
|
|||||||||||||||
Balance December 31, 2024 |
|
$ |
|
— |
— |
$ |
— |
$ |
|
$ |
( |
$ |
( |
$ |
( |
|||||||||
—————————————————
| (1) |
| (2) |
| (3) |
| (4) |
See Notes to Consolidated Financial Statements
77
AMC ENTERTAINMENT HOLDINGS, INC.
NOTES TO CONSOLIDATED FINANCIAL STATEMENTS
Years Ended December 31, 2024, 2023, 2022
NOTE 1—THE COMPANY AND SIGNIFICANT ACCOUNTING POLICIES
AMC Entertainment Holdings, Inc. (“Holdings”), through its direct and indirect subsidiaries, including American Multi-Cinema, Inc. (“Multi-Cinema”) and its subsidiaries, (collectively with Holdings, unless the context otherwise requires, the “Company” or “AMC”), is principally involved in the theatrical exhibition business and owns, operates or has interests in theatres located in the United States and Europe.
Stock Split and Reverse Stock Split. On August 4, 2022, the Company announced that its Board of Directors declared a special dividend of
On August 24, 2023, the Company effectuated a reverse stock split at a ratio of
Accordingly, all references made to share, per share, unit, per unit, or common share amounts in the accompanying consolidated financial statements and applicable disclosures have been retroactively adjusted to reflect both the effects of the special dividend as a stock split and the subsequent reverse stock split. References made to AMC Preferred Equity Units have been retroactively adjusted to reflect the effect of the reverse stock split on their equivalent Common Stock shares.
Liquidity. The Company believes its existing cash and cash equivalents, together with cash generated from operations, will be sufficient to fund its operations and satisfy its obligations currently and through the next twelve months. The Company’s cash burn rates are not sustainable long-term. In order to achieve sustainable net positive cash flows provided by operating activities and long-term profitability, the Company believes that revenues will need to increase to levels at least in line with pre-COVID-19 revenues. North America box office grosses were down approximately
There can be no assurance that the revenues, attendance levels, and other assumptions used to estimate the Company’s liquidity requirements and future cash burn rates will be correct, and the ability to be predictive is uncertain due to limited ability to predict studio film release dates, the overall production and theatrical release levels, and success of individual titles. Further, there can be no assurances that the Company will be successful in generating the additional liquidity necessary to meet the Company’s obligations beyond twelve months from the issuance of these financial statements on terms acceptable to the Company or at all.
The Company expects, from time to time, to continue to seek to retire or purchase its outstanding debt through cash purchases and/or exchanges for equity or debt, in open-market purchases, privately negotiated transactions or otherwise. Such repurchases or exchanges, if any, will be upon such terms and at such prices as it may determine, and will depend on prevailing market conditions, its liquidity requirements, contractual restrictions and other factors. The amounts involved may be material and to the extent equity is used, dilutive. See Note 8—Corporate Borrowings and Finance Lease Liabilities for a summary of debt transactions that occurred during the years ended December 31, 2024, December 31, 2023, and December 31, 2022. Additionally, the Company has bolstered its liquidity through sales of its
78
Common Stock, see Note 9—Stockholders’ Deficit and Note 16—Subsequent Events for further information on these sales.
As of April 19, 2024, and in anticipation of the maturity of the Senior Secured Revolving Credit Facility, the Company voluntarily terminated the commitments under the Senior Secured Revolving Credit Facility in full and paid off any remaining obligations with respect to the Senior Secured Revolving Credit Facility. The financial covenants and related covenant suspension conditions are no longer in effect pursuant to the terms of the Credit Agreement dated as of April 30, 2013 (as amended, restated, amended and restated, supplemented or otherwise modified). The Company currently does not expect to replace the Senior Secured Revolving Credit Facility. The Company has entered into a new letter of credit facility in order to continue to provide letters of credit in the ordinary course of business following the termination of the Senior Secured Revolving Credit Facility.
Use of Estimates. The preparation of financial statements in conformity with U.S. generally accepted accounting principles requires management to make estimates and assumptions that affect the reported amounts of assets and liabilities and disclosure of contingent assets and liabilities at the date of the consolidated financial statements and the reported amounts of revenues and expenses during the reporting period. Actual results could differ from those estimates.
Principles of Consolidation. The consolidated financial statements include the accounts of Holdings and all subsidiaries, as discussed above. All significant intercompany balances and transactions have been eliminated in consolidation. The Company manages its business under
Revenues. The Company recognizes revenue, net of sales tax, when it satisfies a performance obligation by transferring control over a product or service to a customer. Admissions and food and beverage revenues are recorded at a point in time when a film is exhibited to a customer and when a customer takes possession of food and beverage offerings. The Company defers
The Company recognizes income from non-redeemed or partially redeemed gift cards in proportion to the pattern of rights exercised by the customer (“proportional method”) where it applies an estimated non-redemption rate for its gift card sales channels, which range from
The Company recognizes ticket fee revenues based on a gross transaction price. The Company is a principal (as opposed to agent) in the arrangement with third-party internet ticketing companies in regard to the sale of online tickets because the Company controls the online tickets before they are transferred to the customer. The online ticket fee revenues and the third-party commission or service fees are recorded in the line items other theatre revenues and operating expense, respectively, in the consolidated statements of operations.
Film Exhibition Costs. Film exhibition costs are accrued based on the applicable box office receipts and estimates of the final settlement to the film licensors. Film exhibition costs include certain advertising costs. As of December 31, 2024 and December 31, 2023, the Company recorded film payables of $
Food and Beverage Costs. The Company records rebate payments from vendors as a reduction of food and beverage costs when earned.
79
Exhibitor Services Agreement And Common Unit Adjustment Agreement. The Company recognizes advertising revenues, which are included in other theatre revenues in the consolidated statements of operations, when it satisfies a performance obligation by transferring a promised good or service to the customers. The advertising contracts with customers generally consist of a series of distinct periods of service, satisfied over time, to provide rights to advertising services. The Company’s exhibitor services agreement (“ESA”) with National CineMedia, LLC (“NCM”) includes a significant financing component due to the significant length of time between receiving the non-cash consideration and fulfilling the performance obligation. The Company receives the non-cash consideration in the form of common membership units from NCM, in exchange for rights to exclusive access to the Company’s theatre screens and attendees through February 2037. Upon recognition of the significant financing component, the Company records an increase to advertising revenues with a similar offsetting increase in non-cash interest expense, which is recorded to non-cash NCM exhibitor service agreement in the consolidated statements of operations. Pursuant to the calculation requirements for the time value of money, the amortization method reflects the front-end loading of the significant financing component where more interest expense is recognized earlier during the term of the agreement than the back-end recognition of the deferred revenue amortization where more revenue is recognized later in the term of the agreement.
Pursuant to the Company’s Common Unit Adjustment Agreement (the “CUA Agreement”), from time to time common units of NCM held by the Founding Members will be adjusted up or down through a formula (the “CUA”), primarily based on increases or decreases in the number of theatre screens operated and theatre attendance generated by each Founding Member. The CUA is computed annually, except that an earlier CUA will occur for a Founding Member if its acquisition or disposition of theatres, in a single transaction or cumulatively since the most recent CUA, will cause a change of
See Note 2—Revenue Recognition and Note 6—Investments for further information regarding the CUA and ESA.
Customer Loyalty Programs. AMC Stubs® (“Stubs”) is a customer loyalty program in the U.S. markets which allows members to earn rewards, receive discounts and participate in exclusive members-only offerings and services. It features paid tiers called AMC Stubs PremiereTM (“Premiere”) for an annual membership fee and AMC Stubs® A-List (“A-List”) for a monthly membership fee, and a non-paid tier called AMC Stubs® InsiderTM (“Insider”). These programs reward loyal guests for their patronage of AMC Theatres. Rewards earned are redeemable on future purchases at AMC locations.
The portion of the admissions and food and beverage revenues attributed to the rewards is deferred as a reduction of admissions and food and beverage revenues and is allocated between admissions and food and beverage revenues based on expected member redemptions. Upon redemption, deferred rewards are recognized as revenues along with associated cost of goods. The Company estimates point breakage in assigning value to the points at the time of sale based on historical trends. The annual membership fee for Premiere is allocated to the material rights for discounted or free products and services and is initially deferred, net of estimated refunds, and recognized as the rights are redeemed based on estimated utilization, over the one-year membership period in admissions, food and beverage, and other revenues. A portion of the revenues related to a material right are deferred as a virtual rewards performance obligation using the relative standalone selling price method and are recognized as the rights are redeemed or expire.
A-List offers guests admission to movies at AMC up to three times per week including multiple movies per day and repeat visits to movies. Revenue is recognized ratably over the enrollment period.
Advertising Costs. The Company expenses advertising costs as incurred and does not have any direct-response advertising recorded as assets. Advertising costs were $
Cash and Cash Equivalents. All investments purchased with an original maturity of three months or less are classified as cash equivalents. As of December 31, 2024, cash and cash equivalents for the U.S. markets and International markets were $
80
Restricted Cash. Restricted cash includes cash held in the Company's bank accounts as a guarantee for certain landlords and cash collateralized letters of credit relating to the Company’s insurance and utilities programs. The following table provides a reconciliation of cash and cash equivalents and restricted cash reported in the consolidated balance sheet to the total of the amounts in the consolidated statements of cash flows.
Year Ended |
|||||||||
(In millions) |
December 31, 2024 |
December 31, 2023 |
December 31, 2022 |
||||||
Cash and cash equivalents |
$ |
|
$ |
|
$ |
|
|||
Restricted cash |
|
|
|
||||||
Total cash and cash equivalents and restricted cash in the statement of cash flows |
$ |
|
$ |
|
$ |
|
|||
As of December 31, 2024, restricted cash for the U.S. markets and International markets were $
Intangible Assets. Intangible assets are comprised of management contracts, a trademark, and trade names. Amortizable intangible assets are being amortized on a straight-line basis over the estimated remaining useful lives of the assets. The Company evaluates definite-lived intangible assets whenever events or changes in circumstances indicate that the carrying amount of the asset group may not be fully recoverable. Trademark and trade names are considered either definite or indefinite-lived intangible assets. Indefinite-lived intangible assets are not amortized but rather evaluated for impairment annually or more frequently as specific events or circumstances dictate.
The Company first assesses the qualitative factors to determine whether the existence of events and circumstances indicate that it is more likely than not the fair value of an indefinite-lived intangible asset is less than its carrying amount as a basis for determining whether it is necessary to perform the quantitative impairment test. There were
Investments. The Company accounts for its investments in non-consolidated entities using either the cost or equity methods of accounting as appropriate, and has recorded the investments within other long-term assets in its consolidated balance sheets. Equity earnings and losses are recorded when the Company’s ownership interest provides the Company with significant influence. In 2024, the Company reclassified equity earnings and losses to other expense (income), all comparative periods have also been reclassified. The Company follows the guidance in ASC 323-30-35-3, investment in a limited liability company, which prescribes the use of the equity method for investments where the Company has significant influence. The Company classifies gains and losses on sales of investments or impairments accounted for using the cost method in investment expense (income). Gains and losses on cash sales are recorded using the weighted average cost of all interests in the investments. Gains and losses related to non-cash negative common unit adjustments are recorded using the weighted average cost of those units in NCM. See Note 6—Investments for further discussion of the Company’s investments in NCM.
Derivative Liability. The Company remeasures the derivative liability related to the conversion features in its Exchangeable Notes at fair value each reporting period, with changes in fair value recorded in the consolidated statement of operations in other expense (income). The Company has obtained an independent third-party valuation study to assist in determining fair value. The valuation studies use the Binomial Lattice approach and are based on significant inputs not observable in the market and thus represent Level 3 measurements within the fair value measurement hierarchy. The Binomial Lattice approach consists of simulated Common Stock prices from the valuation date to the maturity of the Exchangeable Notes. The inputs used to value the derivative include the initial share price of the Common Stock, the volatility of the share price, time to maturity, risk-free interest rate, credit spread, and the discount yield. The volatility of the Company’s Common Stock, the Common stock price at the end of each reporting period, and the remaining amount of time until maturity of the Exchangeable Notes are key inputs for the estimation of fair value that are expected to change each reporting period. The Company recorded other expense (income) related to derivative liability fair value adjustment of $(
81
Goodwill. The Company’s recorded goodwill was $
In accordance with ASC 350-20-35-30, goodwill of a reporting unit shall be tested for impairment between annual tests by assessing the qualitative factors to determine if an event occurs or changes in circumstances that would warrant an interim ASC 350 impairment analysis. If an impairment analysis is needed, the Company performs a quantitative impairment test for goodwill, which involves estimating the fair value of the reporting unit and comparing that value to its carrying value. If the estimated fair value of the reporting unit is less than its carrying value, the difference is recorded as goodwill impairment charge, not to exceed the total amount of goodwill allocated to that reporting unit.
Qualitative impairment tests. The Company performed a qualitative impairment test to evaluate whether it is more likely than not that the fair value of each reporting unit was less than their respective carrying amount as of its annual assessment date, October 1st. The Company concluded that it was not more likely than not that the fair value of either of the Company’s
Other Long-term Assets. Other long-term assets are comprised principally of investments in partnerships and joint ventures and capitalized computer software, which is amortized over the estimated useful life of the software. Software amortization expense was $
Accounts Payable. Under the Company’s cash management system, checks issued but not presented to banks frequently result in book overdraft balances for accounting purposes and are classified within accounts payable in the balance sheet. The change in book overdrafts is reported as a component of operating cash flows for accounts payable as they do not represent bank overdrafts. The amount of these checks included in accounts payable as of December 31, 2024 and December 31, 2023 was $
Leases. The Company leases theatres and equipment under operating and finance leases. Many of the leases contain options to extend the leases for additional periods. The Company typically does not believe that the exercise of the renewal options is reasonably assured at the inception of the lease agreements and, therefore, considers the initial base term as the lease term. Lease terms vary but generally, the leases provide for fixed and escalating rentals, contingent escalating rentals based on the Consumer Price Index and other indexes not to exceed certain specified amounts and variable rentals based on a percentage of revenues. The Company often receives contributions from landlords for renovations at existing locations. The Company records the amounts received from landlords as an adjustment to the right-of-use asset and amortizes the balance as a reduction to rent expense over the base term of the lease agreement.
Operating lease right-of-use assets and lease liabilities were recorded at commencement date based on the present value of minimum lease payments over the remaining lease term. The minimum lease payments include base rent and other fixed payments, including fixed maintenance costs. The present value of the lease payments is calculated using the incremental borrowing rate for operating leases, which was determined using a portfolio approach based on the rate of interest that the Company would have to pay to borrow an amount equal to the lease payments on a collateralized basis over a similar term. Operating lease expense is recorded on a straight-line basis over the lease term.
The Company elected the practical expedient to not separate lease and non-lease components and also elected the short-term practical expedient for all leases that qualify. As a result, the Company will not recognize right-of-use assets or liabilities for short-term leases that qualify for the short-term practical expedient, but instead will recognize the lease payments as lease cost on a straight-line basis over the lease term. The Company’s lease agreements do not contain residual value guarantees. Short-term leases and sublease arrangements are immaterial. Equipment leases primarily consist of food and beverage and digital equipment.
82
Impairment of Long-lived Assets. The Company reviews long-lived assets, including definite-lived intangibles and theatre assets (including operating lease right-of-use assets) whenever events or changes in circumstances indicate that the carrying amount of the asset group may not be fully recoverable. The Company identifies impairments related to internal use software when management determines that the remaining carrying value of the software will not be realized through future use. The Company evaluates events or circumstances, including competition in the markets where it operates, that would indicate the carrying value of the asset groups may not be fully recoverable. If an event or circumstance is identified indicating carrying value may not be recoverable, the sum of future undiscounted cash flows is compared to the carrying value. If the carrying value exceeds the future undiscounted cash flows, the asset group may be impaired. If the asset group is determined to be impaired, the carrying value of the asset group is reduced to fair value as estimated by a discounted cash flow model, with the difference recorded as an impairment charge. Asset groups are evaluated for impairment on an individual theatre basis, which management believes is the lowest level for which there are identifiable cash flows. The Company evaluates theatres using historical and projected data of theatre level cash flow as its primary indicator of potential impairment and considers the seasonality of its business when making these evaluations. The fair value of assets is determined as either the expected selling price less selling costs (where appropriate) or the present value of the estimated future cash flows, adjusted as necessary for market participant factors.
There is considerable management judgment necessary to determine the estimated future cash flows and fair values of the Company’s theatres and other long-lived assets, and, accordingly, actual results could vary significantly from such estimates, which fall under Level 3 within the fair value measurement hierarchy, see Note 12—Fair Value Measurements.
The following table summarizes the Company’s impairments for the years ended December 31, 2024, December 31, 2023, and December 31, 2022:
Year Ended |
|||||||||
(In millions) |
|
December 31, 2024 |
|
December 31, 2023 |
|
December 31, 2022 |
|||
$ |
|
$ |
|
$ |
|
||||
Impairment of other assets recorded in investment expense (income) |
— |
|
— |
||||||
Total impairment loss |
$ |
|
$ |
|
$ |
|
|||
During the year ended December 31, 2024, the Company recorded non-cash impairment of long-lived assets of $
During the year ended December 31, 2023, the Company recorded non-cash impairment of long-lived assets of $
During the year ended December 31, 2022, the Company recorded non-cash impairment of long-lived assets of $
Foreign Currency Translation. Operations outside the United States are generally measured using the local currency as the functional currency. Assets and liabilities are translated at the rates of exchange at the balance sheet date. Income and expense items are translated at average rates of exchange. The resulting translation adjustments are included in foreign currency translation adjustment, a separate component of accumulated other comprehensive income (loss). Gains and losses from foreign currency transactions are included in net earnings (loss), except those intercompany transactions of a long-term investment nature. If the Company substantially liquidates its investment in a foreign entity, any gain or loss on currency translation or transaction balance recorded in accumulated other comprehensive loss is recorded as part of a gain or loss on disposition.
83
Employee Benefit Plans. The Company sponsors frozen non-contributory qualified and non-qualified defined benefit pension plans in the U.S. and frozen defined benefit pension plans in the UK and Sweden. The Company also sponsors various defined contribution plans.
The following table sets forth the plans’ benefit obligations and plan assets included in the consolidated balance sheets:
U.S. Pension Benefits |
International Pension Benefits |
|||||||||||
Year Ended |
Year Ended |
|||||||||||
(In millions) |
|
December 31, 2024 |
|
December 31, 2023 |
|
December 31, 2024 |
|
December 31, 2023 |
||||
Aggregated projected benefit obligation at end of period (1) |
$ |
( |
$ |
( |
$ |
( |
$ |
( |
||||
Aggregated fair value of plan assets at end of period |
|
|
|
|
|
|
|
|
||||
Net (liability) asset for benefit cost - funded status |
$ |
( |
$ |
( |
$ |
|
$ |
|
||||
| (1) |
As of December 31, 2024 and December 31, 2023, U.S. aggregated accumulated benefit obligations were $ |
The Company expects to contribute $
The weighted-average assumptions used to determine benefit obligations are as follows:
U.S. Pension Benefits |
International Pension Benefits |
|||||||
December 31, 2024 |
December 31, 2023 |
December 31, 2024 |
December 31, 2023 |
|||||
Discount rate |
|
|||||||
Rate of compensation increase |
|
N/A |
N/A |
|||||
The weighted-average assumptions used to determine net periodic benefit cost are as follows:
U.S. Pension Benefits |
International Pension Benefits |
|||||||||||
Year Ended |
Year Ended |
|||||||||||
December 31, |
December 31, |
December 31, |
December 31, |
December 31, |
December 31, |
|||||||
|
2024 |
|
2023 |
|
2022 |
|
2024 |
|
2023 |
|
2022 |
|
Discount rate |
|
|||||||||||
Weighted average expected long-term return on plan assets |
|
|||||||||||
Rate of compensation increase |
|
N/A |
N/A |
N/A |
||||||||
Pension actuarial gains and losses are recorded in stockholders’ deficit as a component of accumulated other comprehensive loss. For further information, see Note 14—Accumulated Other Comprehensive Loss for pension amounts and activity recorded in accumulated other comprehensive loss.
For the years ended December 31, 2024, December 31, 2023, and December 31, 2022, net periodic benefit costs (credits) were $
84
The following table provides the benefits expected to be paid in each of the next five years, and in the aggregate for the five years thereafter:
(In millions) |
U.S. Pension Benefits |
International Pension Benefits |
||||
2025 |
$ |
|
$ |
|
||
2026 |
|
|
|
|||
2027 |
|
|
|
|||
2028 |
|
|
|
|||
2029 |
|
|
|
|||
Years 2030 - 2034 |
|
|
|
|||
The Company’s investment objectives for its U.S. defined benefit pension plan investments are: (1) to preserve the value of its principal; (2) to maximize a real long-term return with respect to the plan assets consistent with minimizing risk; (3) to achieve and maintain adequate asset coverage for accrued benefits under the plan; and (4) to maintain sufficient liquidity for payment of the plan obligations and expenses. The Company uses a diversified allocation of equity, debt, commodity and real estate exposures that are customized to the plan’s cash flow benefit needs. A weighted average targeted allocation percentage is assigned to each asset class as follows: equity securities of
Investments in the pension plan assets are measured at fair value on a recurring basis. As of December 31, 2024, for the U.S. investment portfolio,
In June 2023, the High Court in the UK issued a ruling in respect of Virgin Media Limited v NTL Pension Trustees II Limited, that decided certain amendments were invalid for contracted-out salary-related defined benefit pension plans in the period from April 6, 1997 until April 6, 2016, if these amendments were not accompanied by actuarial confirmations (section 37 certificates). An appeal on this decision was heard in June 2024 and The Court of Appeal ruled in July 2024 and upheld the original High Court judgment, removing uncertainty around its application. In light of the ruling, the Company initiated an investigation with its pension trustees, of all known amendments to its two UK defined benefit pension plans during the affected period, with a view to determining whether section 37 certificates have been obtained where deemed required. The initial review concluded that across the two plans there are three documents where a section 37 certificate may have been required but the amendment document is silent. While further legal and actuarial analysis is required, including potentially awaiting further case law, given the nature of the amendments in question the Company does not believe the impact, if any, will be material to the projected benefit obligation. As of December 31, 2024, no specific adjustments for this matter have been included in estimating the projected benefit obligation and related net periodic benefit cost of the applicable plans. The Company will continue to monitor and keep the investigation outcomes under review as conclusions develop and/or change as a consequence of any subsequent court decisions, legislation and/or industry action.
The Company sponsors various defined contribution plans which include company match features in the U.S. and Internationally. The expense related to defined contribution plans for the years ended December 31, 2024, December 31, 2023, and December 31, 2022, was $
Income and Operating Taxes. The Company accounts for income taxes in accordance with ASC 740-10. Under ASC 740-10, deferred income tax effects of transactions reported in different periods for financial reporting and income tax return purposes are recorded by the asset and liability method. This method gives consideration to the future tax consequences of deferred income or expense items and recognizes changes in income tax laws in the period of enactment.
85
Holdings and its domestic subsidiaries file a consolidated U.S. federal income tax return and combined income tax returns in certain state jurisdictions. Foreign subsidiaries file income tax returns in foreign jurisdictions. Income taxes are determined based on separate Company computations of income or loss. Tax sharing arrangements are in place and utilized when tax benefits from affiliates in the consolidated group are used to offset what would otherwise be taxable income generated by Holdings or another affiliate.
Casualty Insurance. The Company is self-insured for general liability up to $
Government Assistance. The Company recognizes government assistance when the conditions of the grant have been met and there is reasonable assurance that the assistance will be received. Grants relating to specific costs are treated as a reduction of that cost in the consolidated statement of operations. General grants are recorded within other expense (income). Grants related to the construction of long-lived assets are treated as reductions to the cost of the associated assets.
During the year ended December 31, 2024, the Company recognized government assistance in other income of $
Additionally, the Company recognized $
During the years ended December 31, 2024 and December 31, 2023, the Company was awarded $
86
Other Expense (Income): The following table sets forth the components of other expense (income):
Year Ended |
|||||||||
(In millions) |
|
December 31, 2024 |
|
December 31, 2023 |
|
December 31, 2022 |
|||
Credit income related to contingent lease guarantees |
$ |
— |
$ |
— |
$ |
( |
|||
Governmental assistance – International markets |
( |
( |
( |
||||||
Governmental assistance – U.S. markets |
— |
( |
( |
||||||
Foreign currency transaction (gains) losses |
|
( |
( |
||||||
Non-operating components of net periodic benefit cost (income) |
|
|
( |
||||||
Loss on extinguishment - First Lien Notes due 2025 |
— |
— |
|
||||||
Loss on extinguishment - First Lien Notes due 2026 |
— |
— |
|
||||||
Loss on extinguishment - First Lien Toggle Notes due 2026 |
— |
— |
|
||||||
Gain on extinguishment - Second Lien Notes due 2026 |
( |
( |
( |
||||||
Loss on extinguishment - Senior Subordinated Notes due 2025 |
|
— |
— |
||||||
Gain on extinguishment - Senior Subordinated Notes due 2026 |
( |
( |
— |
||||||
Gain on extinguishment - Senior Subordinated Notes due 2027 |
— |
— |
( |
||||||
Loss on extinguishment - Odeon Term Loan Facility |
— |
— |
|
||||||
Term Loan modification - third party fees |
|
— |
— |
||||||
Derivative liability fair value decrease for embedded conversion feature in the Exchangeable Notes due 2030 |
( |
— |
— |
||||||
Equity in (earnings) loss of non-consolidated entities |
( |
( |
|
||||||
Derivative stockholder settlement |
— |
( |
— |
||||||
Shareholder litigation expense and (recoveries) |
( |
|
— |
||||||
Vendor dispute settlement |
( |
— |
— |
||||||
Other settlement proceeds |
( |
— |
— |
||||||
( |
( |
( |
|||||||
Other expense (income) |
$ |
( |
$ |
( |
$ |
|
|||
Accounting Pronouncements Recently Adopted
Segment Reporting. In November 2023, the FASB issued ASC 2023-07, Segment Reporting (Topic 280) Improvements to Reportable Segment Disclosures (“ASU 2023-07”). The amendments in ASU 2023-07 require annual and interim disclosures about significant segment expenses and other additional information related to the Company’s segments. The Company adopted ASU 2023-07 in the fourth quarter of 2024 and has applied the amendments retrospectively. See Note 13—Segment Reporting for the required disclosure information resulting from ASU 2023-07.
Accounting Pronouncements Issued Not Yet Adopted
Income Tax Disclosures. In December 2023, the FASB issued ASC 2023-09, Income Taxes (Topic 740) Improvements to Income Tax Disclosures (“ASU 2023-09”). The amendments in ASU 2023-09 require entities to disclose on an annual basis (1) specific categories in the rate reconciliation and (2) provide additional information for reconciling items that meet a quantitative threshold. The amendments would also require that entities disclose various information about income taxes paid and (1) income (or loss) from continuing operations before income tax expense (or benefit) disaggregated between domestic and (2) foreign and income tax expense (or benefit) from continuing operations disaggregated by federal (national), state, and foreign. ASU 2023-09 is effective for the Company for the year ended December 31, 2025.
Disaggregation of Income Statement Expenses. In November 2024, the FASB issued ASC 2024-03, Income Statement (Subtopic 220-40)—Reporting Comprehensive Income-Expense Disaggregation Disclosures (“ASU 2024-03”). The amendments in ASU 2024-03 require that public business entities disclose additional information about specific expense categories in the notes to financial statements for interim and annual reporting periods. ASU 2024-03 is effective for the Company for the year ended December 31, 2027.
87
Induced Conversions of Convertible Debt Instruments. In November 2024, the FASB issued ASC 2024-04, Debt—Debt with Conversion and Other Options (Subtopic 470-20) Induced Conversions of Convertible Debt Instruments (“ASU 2024-04”). The amendments in ASU 2024-04 clarify the requirements for determining whether certain settlements of convertible debt instruments should be accounted for as an induced conversion. The amendments are effective for annual reporting periods beginning after December 15, 2025. The Company is evaluating the impact of ASU 2024-04 on its consolidated financial statements.
NOTE 2—REVENUE RECOGNITION
Disaggregation of Revenue. Revenue is disaggregated in the following tables by major revenue types and by timing of revenue recognition:
Year Ended |
|||||||||
(In millions) |
December 31, 2024 |
December 31, 2023 |
December 31, 2022 |
||||||
Major revenue types |
|||||||||
Admissions |
$ |
|
$ |
|
$ |
|
|||
Food and beverage |
|
|
|
||||||
Other theatre: |
|||||||||
Advertising |
|
|
|
||||||
Other theatre |
|
|
|
||||||
Other theatre |
|
|
|
||||||
Total revenues |
$ |
|
$ |
|
$ |
|
|||
Year Ended |
|||||||||
(In millions) |
December 31, 2024 |
December 31, 2023 |
December 31, 2022 |
||||||
Timing of revenue recognition |
|||||||||
Products and services transferred at a point in time |
$ |
|
$ |
|
$ |
|
|||
Products and services transferred over time (1) |
|
|
|
||||||
Total revenues |
$ |
|
$ |
|
$ |
|
|||
| (1) | Amounts primarily include subscription and advertising revenues. |
The following tables provide the balances of receivables, net and deferred revenues and income:
(In millions) |
December 31, 2024 |
December 31, 2023 |
||||
Current assets |
||||||
Receivables related to contracts with customers |
$ |
|
$ |
|
||
Miscellaneous receivables |
|
|
||||
Receivables, net |
$ |
|
$ |
|
||
(In millions) |
December 31, 2024 |
December 31, 2023 |
||||
Current liabilities |
||||||
Deferred revenues related to contracts with customers |
$ |
|
$ |
|
||
Miscellaneous deferred income |
|
|
||||
Deferred revenues and income |
$ |
|
$ |
|
||
88
The significant changes in contract liabilities with customers included in deferred revenues and income are as follows:
Deferred Revenues |
|||
Related to Contracts |
|||
(In millions) |
with Customers |
||
Balance December 31, 2022 |
$ |
|
|
Cash received in advance (1) |
|
||
Customer loyalty rewards accumulated, net of expirations: |
|||
Admission revenues (2) |
|
||
Food and beverage revenues (2) |
|
||
Other theatre revenues (2) |
( |
||
Reclassification to revenue as the result of performance obligations satisfied: |
|||
Admission revenues (3) |
( |
||
Food and beverage revenues (3) |
( |
||
Other theatre revenues (4) |
( |
||
Foreign currency translation adjustment |
( |
||
Balance December 31, 2023 |
$ |
|
|
Cash received in advance (1) |
|
||
Customer loyalty rewards accumulated, net of expirations: |
|||
Admission revenues (2) |
|
||
Food and beverage revenues (2) |
|
||
Other theatre revenues (2) |
( |
||
Reclassification to revenue as the result of performance obligations satisfied: |
|||
Admission revenues (3) |
( |
||
Food and beverage revenues (3) |
( |
||
Other theatre revenues (4) |
( |
||
Foreign currency translation adjustment |
( |
||
Balance December 31, 2024 |
$ |
|
|
| (1) | Includes movie tickets, food and beverage, gift cards, exchange tickets, subscription membership fees, and other loyalty membership fees. |
| (2) | Amount of rewards accumulated, net of expirations, that are attributed to loyalty programs. |
| (3) | Amount of rewards redeemed that are attributed to gift cards, exchange tickets, movie tickets, and loyalty programs. |
| (4) | Amounts relate to income from non-redeemed or partially redeemed gift cards, non-redeemed exchange tickets, subscription membership fees, and loyalty programs membership fees. |
The significant changes to contract liabilities included in the ESA in the consolidated balance sheets are as follows:
Exhibitor Services |
|||
(In millions) |
Agreement (1) |
||
Balance December 31, 2022 |
$ |
|
|
Reclassification, net of adjustments, for portion of the beginning balance to other theatre revenue, as the result of performance obligations satisfied |
( |
||
Balance December 31, 2023 |
|
||
Reclassification of the beginning balance to other theatre revenue, as the result of performance obligations satisfied |
( |
||
Balance December 31, 2024 |
$ |
|
|
| (1) |
Represents the carrying amount of the NCM common units that were previously received under the annual CUA and subsequent adjustments related to the NCM Bankruptcy, as discussed in greater detail below. The deferred revenues are being amortized to other theatre revenues over the remainder of the |
89
NCM Bankruptcy. On April 11, 2023, NCM filed a petition under Chapter 11 of the U.S. Bankruptcy Code in the Southern District of Texas. NCM is the in-theatre advertising provider for the majority of the Company’s theatres in the United States. Under the Chapter 11 plan of reorganization, which became effective on August 7, 2023 (the “Plan”), NCM has assumed its agreements with the Company. As part of the Plan, on August 7, 2023, NCM issued
Transaction Price Allocated to the Remaining Performance Obligations. The following table includes the amount of NCM ESA, included in exhibitor services agreement in the Company’s consolidated balance sheets, that is expected to be recognized as revenues in the future related to performance obligations that are unsatisfied as of December 31, 2024:
(In millions) |
Exhibitor Services Agreement |
||
Year ended 2025 |
$ |
|
|
Year ended 2026 |
|
||
Year ended 2027 |
|
||
Year ended 2028 |
|
||
Year ended 2029 |
|
||
Years ended 2030 through February 2037 |
|
||
Total |
$ |
|
|
Gift Cards and Exchange Tickets. The total amount of non-redeemed gift cards and exchange tickets included in deferred revenues and income as of December 31, 2024 was $
Loyalty Programs. As of December 31, 2024, the amount of deferred revenues allocated to the loyalty programs included in deferred revenues and income was $
The Company applies the practical expedient in ASC 606-10-50-14 and does not disclose information about remaining performance obligations that have original expected durations of one year or less.
90
NOTE 3—LEASES
The following table reflects the lease costs for the years indicated below:
Year Ended |
|||||||||||
December 31, |
December 31, |
December 31, |
|||||||||
(In millions) |
Consolidated Statements of Operations |
2024 |
2023 |
2022 |
|||||||
Operating lease cost |
|||||||||||
Theatre properties |
Rent |
$ |
|
$ |
|
$ |
|
||||
Theatre properties |
Operating expense |
|
|
|
|||||||
Equipment |
Operating expense |
|
|
|
|||||||
Office and other |
General and administrative: other |
|
|
|
|||||||
Finance lease cost |
|||||||||||
Amortization of finance lease assets |
Depreciation and amortization |
|
|
|
|||||||
Interest expense on lease liabilities |
Interest expense |
|
|
|
|||||||
Variable lease cost |
|||||||||||
Theatre properties |
Rent |
|
|
|
|||||||
Theatre properties |
Interest expense |
|
— |
— |
|||||||
Equipment |
Operating expense |
|
|
|
|||||||
Total lease cost |
$ |
|
$ |
|
$ |
|
|||||
The following table represents the weighted-average remaining lease term and discount rate as of December 31, 2024:
Weighted Average |
Weighted Average |
|||||
Remaining |
Discount |
|||||
Lease Term and Discount Rate |
Lease Term (years) |
Rate |
||||
Operating leases |
||||||
Finance leases |
||||||
Cash flow and supplemental information is presented below:
Year Ended |
|||||||||
December 31, |
December 31, |
December 31, |
|||||||
(In millions) |
2024 |
2023 |
2022 |
||||||
Cash paid for amounts included in the measurement of lease liabilities: |
|||||||||
Operating cash flows used in finance leases |
$ |
( |
$ |
( |
$ |
( |
|||
Operating cash flows used in operating leases |
( |
( |
( |
||||||
Financing cash flows used in finance leases |
( |
( |
( |
||||||
Landlord contributions: |
|||||||||
Operating cash flows provided by operating leases |
|
|
|
||||||
Supplemental disclosure of noncash leasing activities: |
|||||||||
Right-of-use assets obtained in exchange for new operating lease liabilities (1) |
|
|
|
||||||
Right-of-use assets obtained in exchange for new finance lease liabilities (1) |
|
— |
— |
||||||
| (1) | Includes lease extensions and option exercises. |
91
Minimum annual payments required under existing operating and finance leases and the net present value thereof as of December 31, 2024 are as follows:
Operating Lease |
Finance Lease |
|||||
(In millions) |
Payments |
Payments |
||||
2025 |
|
|
||||
2026 |
|
|
||||
2027 |
|
|
||||
2028 |
|
|
||||
2029 |
|
|
||||
Thereafter |
|
|
||||
Total lease payments |
|
|
||||
Less imputed interest |
( |
( |
||||
Total operating and finance lease liabilities, respectively |
$ |
|
$ |
|
||
As of December 31, 2024, the Company had signed additional operating lease agreements for
During the year ended December 31, 2023, the Company received a $
92
NOTE 4—PROPERTY
A summary of property is as follows:
(In millions) |
|
December 31, 2024 |
|
December 31, 2023 |
||
Property owned: |
||||||
Land |
$ |
|
$ |
|
||
Buildings and improvements |
|
|
|
|
||
Leasehold improvements |
|
|
|
|
||
Furniture, fixtures and equipment |
|
|
|
|
||
|
|
|
|
|||
Less: accumulated depreciation |
|
|
|
|
||
|
|
|||||
Property leased under finance leases: |
||||||
Building and improvements |
|
|
||||
Less: accumulated depreciation and amortization |
|
|
||||
|
|
|||||
$ |
|
$ |
|
|||
Property is recorded at cost or fair value, in the case of property resulting from acquisitions. The Company uses the straight-line method in computing depreciation and amortization for financial reporting purposes. The estimated useful lives for leasehold improvements and buildings subject to a ground lease reflect the shorter of the expected useful lives of the assets or the base terms of the corresponding lease agreements for these leases for assets placed in service subsequent to the lease inception. The estimated useful lives are as follows:
Buildings and improvements |
|
|
Leasehold improvements |
||
Furniture, fixtures and equipment |
Expenditures for additions (including interest during construction) and betterments are capitalized, and expenditures for maintenance and repairs are charged to expense as incurred. The cost of assets retired or otherwise disposed of and the related accumulated depreciation and amortization are eliminated from the accounts in the year of disposal. Gains or losses resulting from property disposals are included in operating expense in the accompanying consolidated statements of operations.
Depreciation expense was $
93
NOTE 5—GOODWILL AND INTANGIBLE ASSETS
The following table summarizes the changes in goodwill by reporting unit:
U.S. |
International |
Consolidated Goodwill |
|||||||||||||||||||||||||
(In millions) |
Gross Carrying Amount |
Accumulated Impairment Losses |
Net Carrying Amount |
Gross Carrying Amount |
Accumulated Impairment Losses |
Net Carrying Amount |
Gross Carrying Amount |
Accumulated Impairment Losses |
Net Carrying Amount |
||||||||||||||||||
Balance December 31, 2022 |
$ |
|
$ |
( |
$ |
|
$ |
|
$ |
( |
$ |
|
$ |
|
$ |
( |
$ |
|
|||||||||
Currency translation adjustment |
— |
— |
— |
|
( |
|
|
( |
|
||||||||||||||||||
Balance December 31, 2023 |
$ |
|
$ |
( |
$ |
|
$ |
|
$ |
( |
$ |
|
$ |
|
$ |
( |
$ |
|
|||||||||
Currency translation adjustment |
— |
— |
— |
( |
|
( |
( |
|
( |
||||||||||||||||||
Balance December 31, 2024 |
$ |
|
$ |
( |
$ |
|
$ |
|
$ |
( |
$ |
|
$ |
|
$ |
( |
$ |
|
|||||||||
Detail of other intangible assets is presented below:
December 31, 2024 |
December 31, 2023 |
|
|||||||||||||
|
|
Gross |
|
|
Gross |
|
|
||||||||
Remaining |
Carrying |
Accumulated |
Carrying |
Accumulated |
|
||||||||||
(In millions) |
Useful Life |
Amount |
Amortization |
Amount |
Amortization |
|
|||||||||
Amortizable intangible assets: |
|||||||||||||||
Management contracts |
|
$ |
|
$ |
( |
$ |
|
$ |
( |
||||||
Starplex trade name |
|
( |
|
( |
|||||||||||
Total, amortizable |
$ |
|
$ |
( |
$ |
|
$ |
( |
|||||||
Non-amortizing intangible assets: |
|||||||||||||||
AMC trademark |
$ |
|
$ |
|
|||||||||||
Odeon trade names |
|
|
|||||||||||||
Nordic trade names |
|
|
|||||||||||||
Total, unamortizable |
$ |
|
$ |
|
|||||||||||
Amortization expense associated with the intangible assets noted above is as follows:
Year Ended |
||||||||||
(In millions) |
|
December 31, 2024 |
|
December 31, 2023 |
|
December 31, 2022 |
||||
Recorded amortization |
$ |
|
$ |
|
$ |
|
||||
94
NOTE 6—INVESTMENTS
Investments in non-consolidated affiliates and certain other investments accounted for under the equity method generally include all entities in which the Company or its subsidiaries have significant influence, but not more than
Investment in Hycroft
On March 14, 2022, the Company purchased
The Company accounts for the common shares of Hycroft under the equity method and we have elected the fair value option in accordance with ASC 825-10. The Company account for the warrants as derivatives in accordance with ASC 815. Accordingly, the fair value of the investments in Hycroft are remeasured at each subsequent reporting period and unrealized gains and losses are reported in investment expense (income). During the years ended December 31, 2024, December 31, 2023, and December 31, 2022, the Company recorded unrealized losses related to the investment in Hycroft of $
NCM Transactions
In March 2022, the NCM CUA resulted in a positive adjustment of
DCIP Transactions
During the year ended December 31, 2022, DCIP ceased operations and the Company received a liquidation distribution of $
95
Summary Financial Information
Investments in non-consolidated affiliates accounted for under the equity method as of December 31, 2024, include interests in Hycroft, SV Holdco, DCM, AC JV, DCDC,
Condensed financial information of the Company’s non-consolidated equity method investments is shown below with amounts presented under U.S. GAAP:
(In millions) |
|
December 31, 2024 |
December 31, 2023 |
|||
Current assets |
$ |
|
$ |
|
||
Noncurrent assets |
|
|
|
|||
Total assets |
|
|
|
|||
Current liabilities |
|
|
|
|||
Noncurrent liabilities |
|
|
|
|||
Total liabilities |
|
|
|
|||
Stockholders’ deficit |
( |
|
( |
|||
Liabilities and stockholders’ deficit |
|
|
|
|||
The Company’s recorded investment |
|
|
||||
Condensed financial information of the Company’s non-consolidated equity method investments is shown below and amounts are presented under U.S. GAAP for the periods of ownership by the Company:
Year Ended |
|||||||||
December 31, |
December 31, |
December 31, |
|||||||
(In millions) |
|
2024 |
|
2023 |
2022 |
||||
Revenues |
$ |
|
$ |
|
$ |
|
|||
Operating costs and expenses |
|
|
|
||||||
Net loss |
$ |
( |
$ |
( |
$ |
( |
|||
Related Party Transactions
The Company recorded the following related party transactions with equity method investees:
As of |
|
As of |
||||
(In millions) |
December 31, 2024 |
|
December 31, 2023 |
|||
Due from DCM for on-screen advertising revenue |
$ |
|
$ |
|
||
Loan receivable from DCM |
|
|
||||
Due to AC JV for Fathom Events programming |
( |
( |
||||
Loan receivable from Vasteras |
|
|
||||
Due from Capa for on-screen advertising revenue |
|
|
||||
Due to Vasteras |
( |
( |
||||
Due to U.S. theatre partnerships |
( |
( |
||||
Year Ended |
|||||||||||
(In millions) |
Consolidated Statements of Operations |
December 31, 2024 |
December 31, 2023 |
December 31, 2022 |
|||||||
DCM screen advertising revenues |
Other revenues |
$ |
|
$ |
|
$ |
|
||||
DCDC content delivery services |
Operating expense |
|
|
|
|||||||
Gross exhibition cost on AC JV Fathom Events programming |
Film exhibition costs |
|
|
|
|||||||
Screenvision screen advertising revenues |
Other revenues |
|
|
|
|||||||
Capa advertising revenues |
Other revenues |
|
|
|
|||||||
96
NOTE 7—SUPPLEMENTAL BALANCE SHEET INFORMATION
Other assets and liabilities consist of the following:
(In millions) |
|
December 31, 2024 |
|
December 31, 2023 |
||
Other current assets: |
||||||
Income taxes receivable |
$ |
|
$ |
|
||
Prepaids |
|
|
|
|
||
Merchandise inventory |
|
|
|
|
||
Other |
|
|
|
|
||
$ |
|
$ |
|
|||
Other long-term assets: |
||||||
Investments in real estate |
$ |
|
$ |
|
||
Deferred financing costs revolving credit facility |
|
— |
|
|
||
Investments in equity method investees |
|
|
|
|
||
Computer software |
|
|
|
|
||
Investment in common stock |
|
|
|
|
||
Pension asset |
|
|
||||
Investment in Hycroft common stock (1) |
|
|
||||
Investment in Hycroft warrants (1) |
|
|
||||
Other |
|
|
|
|
||
$ |
|
$ |
|
|||
Accrued expenses and other liabilities: |
||||||
Taxes other than income |
$ |
|
$ |
|
||
Interest |
|
|
|
|
||
Payroll and vacation |
|
|
|
|
||
Current portion of casualty claims and premiums |
|
|
|
|
||
Accrued bonus |
|
|
|
|
||
Accrued licensing and variable rent |
|
|
|
|
||
Current portion of pension |
|
|
||||
Group insurance reserve |
|
|
||||
Accrued tax payable |
|
|
||||
Other |
|
|
|
|
||
$ |
|
$ |
|
|||
Other long-term liabilities: |
||||||
Pension |
$ |
|
$ |
|
||
Casualty claims and premiums |
|
|
|
|
||
Contingencies |
|
|
||||
Other |
|
|
|
|
||
$ |
|
$ |
|
|||
| (1) | The equity method investment in Hycroft and related warrants are measured at fair value. See Note 6—Investments and Note 12—Fair Value Measurements for further information regarding the investment in Hycroft. |
97
NOTE 8—CORPORATE BORROWINGS AND FINANCE LEASE LIABILITIES
A summary of the carrying value of corporate borrowings and finance lease liabilities is as follows:
(In millions) |
|
December 31, 2024 |
|
December 31, 2023 |
||
Secured Debt: |
||||||
Credit Agreement-Term Loans due 2029 ( |
$ |
|
$ |
— |
||
|
|
|||||
|
|
|||||
Senior Secured Credit Facility-Term Loan due 2026 ( |
— |
|
||||
|
— |
|||||
Subordinated Debt: |
||||||
|
|
|||||
— |
|
|||||
|
|
|||||
|
|
|||||
|
|
|||||
Total principal amount of corporate borrowings |
$ |
|
$ |
|
||
Finance lease liabilities |
|
|
|
|
||
Paid-in-kind interest for |
|
— |
||||
Deferred financing costs |
( |
( |
||||
Net premium (discount) (1) |
( |
|
||||
Derivative liability - Conversion Option |
|
— |
||||
Total carrying value of corporate borrowings and finance lease liabilities |
$ |
|
$ |
|
||
Less: |
||||||
Current maturities of corporate borrowings |
( |
|
( |
|||
Current maturities of finance lease liabilities |
( |
( |
||||
Total noncurrent carrying value of corporate borrowings and finance lease liabilities |
$ |
|
$ |
|
||
| (1) | The following table provides the net premium (discount) amounts of corporate borrowings: |
December 31, |
December 31, |
|||||
(In millions) |
2024 |
2023 |
||||
$ |
|
$ |
|
|||
Senior Secured Credit Facility-Term Loan due 2026 |
— |
( |
||||
( |
( |
|||||
Credit Agreement-Term Loans due 2029 |
( |
— |
||||
( |
— |
|||||
Net premium (discount) |
$ |
( |
$ |
|
||
98
The following table provides the principal payments required and maturities of corporate borrowings as of December 31, 2024:
Principal |
|||
Amount of |
|||
Corporate |
|||
(In millions) |
|
Borrowings |
|
2025 |
|
||
2026 |
|
|
|
2027 |
|
|
|
2028 |
|
|
|
2029 |
|
|
|
Thereafter |
|
||
Total |
$ |
|
|
Debt Repurchases and Exchanges
The below table summarizes the various cash debt repurchase transactions, debt for equity exchange transactions, and cash and debt for equity exchange transactions that occurred during the year ended December 31, 2024. The debt for equity exchange transactions were treated as early extinguishments of debt. In accordance with ASC 470-50-40-3, the reacquisition price of the extinguished debt was determined to be the fair value of the Common Stock exchanged. The below table does not include the Refinancing Transactions described further below.
Shares of |
|||||||||||||||
Aggregate Principal |
Common Stock |
Reacquisition |
(Gain)/Loss on |
Accrued Interest |
|||||||||||
(In millions, except for share data) |
Repurchased/Exchanged |
Exchanged |
Cost |
Extinguishment |
Paid/Exchanged |
||||||||||
Cash debt repurchase transactions: |
|||||||||||||||
$ |
|
— |
$ |
|
$ |
( |
$ |
|
|||||||
Second Lien Notes due 2026 |
|
— |
|
( |
|
||||||||||
Total cash debt repurchase transactions |
|
— |
|
( |
|
||||||||||
Debt for equity exchange transactions: |
|||||||||||||||
|
|
|
|
|
|||||||||||
Second Lien Notes due 2026 |
|
|
|
( |
|
||||||||||
Total debt for equity exchange transactions |
|
|
|
( |
|
||||||||||
Cash and debt for equity exchange transactions: |
|||||||||||||||
|
|
|
( |
|
|||||||||||
|
|
|
( |
|
|||||||||||
Second Lien Notes due 2026 |
|
|
|
( |
|
||||||||||
Total cash and debt for equity exchange transactions |
|
|
|
( |
|
||||||||||
Total debt repurchases and exchanges |
$ |
|
|
$ |
|
$ |
( |
$ |
|
||||||
99
The below table summarizes the various cash debt repurchase and debt for equity exchange transactions during the year ended December 31, 2023, including related party transactions. These transactions were executed at terms equivalent to an arms-length transaction.
Shares of |
|||||||||||||||
Aggregate Principal |
Common Stock |
Reacquisition |
(Gain) on |
Accrued Interest |
|||||||||||
(In millions, except for share data) |
Repurchased/Exchanged |
Exchanged |
Cost |
Extinguishment |
Paid/Exchanged |
||||||||||
Cash debt repurchase transactions: |
|||||||||||||||
Related party transactions: |
|||||||||||||||
Second Lien Notes due 2026 |
$ |
|
$ |
— |
$ |
|
$ |
( |
$ |
|
|||||
|
— |
|
( |
|
|||||||||||
Total related party transactions |
|
— |
|
( |
|
||||||||||
Non-related party transactions: |
|||||||||||||||
Second Lien Notes due 2026 |
|
— |
|
( |
|
||||||||||
Total non-related party transactions |
|
— |
|
( |
|
||||||||||
Total cash debt repurchase transactions |
$ |
|
$ |
— |
$ |
|
$ |
( |
$ |
|
|||||
Debt for equity exchange transactions: |
|||||||||||||||
Second Lien Notes due 2026 |
$ |
|
|
( |
|
||||||||||
Total debt repurchases and exchanges |
$ |
|
|
$ |
|
$ |
( |
$ |
|
||||||
The below table summarizes the various cash debt repurchase transactions during the year ended December 31, 2022.
Aggregate Principal |
Reacquisition |
(Gain) on |
Accrued Interest |
|||||||||
(In millions, except for share data) |
Repurchased |
Cost |
Extinguishment |
Paid |
||||||||
Second Lien Notes due 2026 |
$ |
|
$ |
|
$ |
( |
$ |
|
||||
|
|
( |
— |
|||||||||
Total debt repurchase transactions |
$ |
|
$ |
|
$ |
( |
$ |
|
||||
Refinancing Transactions
On July 22, 2024 (the “Closing Date”), the Company completed a series of refinancing transactions (the “Refinancing Transactions”) with
In connection with the refinancing on the Closing Date:
| ● |
Holdings and Muvico, LLC, a newly formed indirect wholly-owned subsidiary of Holdings (“Muvico”), entered into that certain credit agreement (the “New Term Loan Credit Agreement”), by and among Holdings and Muvico, each, as a borrower (collectively, the “New Term Loan Borrowers”), the lenders party thereto and Wilmington Savings Fund Society, FSB, as administrative agent and collateral agent (in such capacities, the “New Term Loan Agent”) pursuant to which Holdings and Muvico jointly and severally borrowed $ |
| ● |
The New Term Loans were (i) used as consideration for the open market purchase of $ |
| ● |
Muvico also completed a private offering for cash of $ |
100
| ● |
Muvico used the proceeds from the offering of the Exchangeable Notes to repurchase $ |
In connection with the formation of Muvico, among other things:
| ● |
Holdings and certain of its subsidiaries transferred certain leases, owned real property and related assets and rights in respect of |
| ● | Muvico and Multi-Cinema entered into a management services agreement, pursuant to which Muvico engaged Multi-Cinema to manage and operate the Transferred Theatres and provide certain other management services to Muvico. |
| ● | Muvico and Multi-Cinema entered into an intellectual property license, pursuant to which Muvico granted Multi-Cinema a license to use the Transferred IP. |
Muvico is a direct subsidiary of Centertainment Development, LLC (“Centertainment”). Each of Muvico and Centertainment is an “unrestricted subsidiary” under the Existing First Lien Notes and therefore not subject to various restrictive covenants under the agreements governing such indebtedness.
During the third quarter of 2024, Holdings completed follow-on open market repurchases of the Existing Term Loans, and in exchange, issued to such selling holders the New Term Loans pursuant to the New Term Loan Credit Agreement of approximately $
As of December 31, 2024, Holdings completed open market purchases of $
The debt repurchases and exchanges for the Second Lien Notes were accounted for as extinguishments and resulted in a loss on extinguishment as follows:
(In millions) |
Amount |
||
Fair value of Exchangeable Notes due 2030 |
$ |
|
|
Fair value of Conversion Option |
|
||
Fair value of New Term Loans due 2029 |
|
||
PIK fee paid to Second Lien Lenders |
|
||
Cash fee paid to Second Lien Lenders |
|
||
Second Lien Notes consideration |
|
||
Principal Second Lien Notes |
|
||
Premium Second Lien Notes |
|
||
Carrying value Second Lien Notes |
|
||
Loss on extinguishment of Second Lien Notes |
$ |
|
|
The debt exchanges for the Existing Term Loans were accounted for as modifications and resulted in expense of approximately $
See Note 1—The Company and Significant Accounting Policies for additional information about the components of other expense (income) related to the Refinancing Transactions.
101
Exchangeable Notes
Carrying value (in millions) as of December 31, 2024:
Carrying Value |
Additional |
Carrying Value |
||||||||||
at Issuance on |
Deferred |
(Increase) Decrease to |
as of |
|||||||||
July 22, 2024 |
Charges |
Net Earnings (Loss) |
December 31, 2024 |
|||||||||
Principal balance (1) |
$ |
|
$ |
— |
$ |
|
$ |
|
||||
Discount |
( |
— |
|
( |
||||||||
Debt issuance costs |
( |
( |
|
( |
||||||||
Accrued paid-in-kind interest |
— |
— |
|
|
||||||||
Derivative liability |
|
— |
( |
|
||||||||
Carrying value |
$ |
|
$ |
( |
$ |
( |
$ |
|
||||
| (1) | The change in principal balance is due to paid-in-kind interest. |
On July 22, 2024, Muvico issued $
At the time prior to the close of business on the second Trading Day (as defined in the Exchangeable Notes Indenture) immediately preceding the final maturity date of the Exchangeable Notes, each holder of the Exchangeable Notes shall have the right, at its option, to surrender for exchange all or a portion of its Exchangeable Notes at the Exchange Rate (as defined in the Exchangeable Notes Indenture) for Common Stock. The Exchange Rate is initially set at
At any time prior to the close of business on the second Trading Day immediately preceding the final maturity date of the Exchangeable Notes, Muvico will also have the right, at its election, to redeem all (but not less than all) of the outstanding Exchangeable Notes at a price equal to the aggregate principal amount of the Exchangeable Notes, plus accrued and unpaid interest thereon to, but excluding, the date of such redemption if the Daily VWAP (as defined in the Exchangeable Notes Indenture) per share of Common Stock exceeds
In the event that holders of Exchangeable Notes voluntarily elect to exchange their Exchangeable Notes, such holders will also be entitled to a make-whole premium (the “Exchange Adjustment Consideration”) equal to (i) prior to the third anniversary of the Issue Date,
102
If certain corporate events that constitute a Fundamental Change (as defined in the Exchangeable Notes Indenture) occur, then holders will have the right to require Muvico to repurchase their Exchangeable Notes at a cash repurchase price equal to
Muvico will also be required to mandatorily redeem all of the issued and outstanding Exchangeable Notes at a purchase price equal to
The Exchangeable Notes Indenture contains covenants that limit the Centertainment Group Parties’ (as defined below) ability to, among other things: (i) incur additional indebtedness or guarantee indebtedness; (ii) create liens; (iii) declare or pay dividends, redeem stock or make other distributions to stockholders; (iv) make investments; (v) enter into transactions with its affiliates; (vi) consolidate, merge, sell or otherwise dispose of all or substantially all of their respective assets; and (vii) impair the security interest in the collateral. These covenants are subject to a number of limitations and exceptions. The Exchangeable Notes Indenture also incorporates the other restrictive covenants contained in the New Term Loan Credit Agreement. The Exchangeable Notes Indenture also provides for events of default, which, if any of them occur, would permit or require the principal, premium, if any, interest and any other monetary obligations on all the then outstanding Exchangeable Notes to be due and payable immediately.
The Company analyzed the conversion option and Exchange Adjustment Consideration as one single conversion option (the “Conversion Option”). The Company bifurcated the Conversion Option from the principal balance of the Exchangeable Notes as a derivative liability. The Company bifurcated the Conversion Option as: (i) the economic characteristics of a conversion option embedded in a debt instrument are not clearly and closely related to the economic characteristics and risks of a debt host contract, as stated in ASC 815-15-25-51; (ii) the host debt instrument is not remeasured at fair value but rather, the Exchangeable Notes are measured at amortized cost; and (iii) the Conversion Option does not qualify for derivative scope exception under ASC 815-10-15-74(a). The Conversion Option also includes a make-whole adjustment, the Exchange Adjustment Consideration. The Exchange Adjustment Consideration (i.e., make-whole payment) does not meet the criteria for indexation under ASC 815-40-15-7C because the design of the feature does not meet the time-value scope exception and as a result is accounted for as a derivative. The initial estimated fair value of the Exchangeable Notes of $
New Term Loans due 2029. As of December 31, 2024, we had an aggregate principal balance of $
The New Term Loans mature on January 4, 2029 (or, if at least $
103
The New Term Loans bear interest, at the option of the New Term Loan Borrowers, at rates equal to either (i) a base rate plus a margin of between
The New Term Loans are guaranteed, subject to limited exceptions, by Centertainment and the future subsidiaries of Centertainment and Muvico (collectively with Muvico, the “Centertainment Group Parties”) and the Existing Guarantors, and are secured by liens on substantially all of the tangible and intangible assets owned by the Company, in each case, subject to limited exceptions set forth in the New Term Loan Credit Agreement.
The New Term Loan Credit Agreement contains covenants that limit the Company’s ability to, among other things: (i) incur additional indebtedness or guarantee indebtedness; (ii) create liens; (iii) declare or pay dividends, redeem stock or make other distributions to stockholders; (iv) make investments; (v) enter into transactions with its affiliates; (vi) consolidate, merge, sell or otherwise dispose of all or substantially all of their respective assets; and (vii) maintain cash in the accounts of the Company (other than the Centertainment Group Parties). These covenants are subject to a number of limitations and exceptions. The New Term Loan Credit Agreement also provides for events of default, which, if any of them occur, would permit or require the principal, premium, if any, interest and any other monetary obligations on all the then outstanding New Term Loans to become immediately due and payable.
Unamortized discounts and deferred charges related to the Existing Term Loans of $
Senior Secured Credit Facilities. Holdings entered into a certain Credit Agreement, dated as of April 30, 2013 (the “Credit Agreement”). The Credit Agreement (as amended, restated, amended and restated, supplemented or otherwise modified) provided senior secured financing of $
On June 23, 2023, Holdings and Wilmington Savings Fund Society, FSB, as administrative agent, entered into the thirteenth amendment to the Credit Agreement (the “Thirteenth Amendment”), pursuant to which LIBOR, the benchmark rate upon which certain loans, commitments and/or other extensions of credit under the Credit Agreement incur interest, fees or other amounts, was replaced with Term SOFR, a benchmark rate reported by the CME Group Benchmark Administration Limited that is based on the secured overnight financing rate. Term SOFR under the Credit Agreement is subject to a credit spread adjustment equal to
The Company elected to apply the optional expedients allowed under ASC 848 regarding the discontinuation of LIBOR and reference rate reform. Pursuant to ASC 848, the Thirteenth Amendment was determined to be an insubstantial modification.
The Existing Term Loans bore interest at a rate per annum equal to, at Holdings’ option, either (1) a base rate determined by reference to the highest of (a)
104
On the Closing Date, the Company and Wilmington Savings Fund Society, FSB, as administrative agent, entered into the fourteenth amendment to the Credit Agreement (the “Fourteenth Amendment”), pursuant to which the administrative agent and lenders constituting the Required Lenders (as defined therein) permitted the Refinancing Transactions.
The Company’s obligations under the Senior Secured Credit Facilities were completely repaid following the completion of the Refinancing Transactions.
First Lien Notes due 2029. On February 14, 2022, Holdings issued $
The First Lien Notes due 2029 bear cash interest at a rate of
The First Lien Notes due 2029 are guaranteed by the Existing Guarantors and are secured by liens on substantially all of the tangible and intangible assets owned by Holdings and the Existing Guarantors, subject to certain thresholds, exceptions and permitted liens.
The indenture governing the First Lien Notes due 2029 contains covenants that restrict the ability of the Company to, among other things: (i) incur additional indebtedness, including additional senior indebtedness; (ii) pay dividends on or make other distributions in respect of its capital stock; (iii) purchase or redeem capital stock or pre-pay subordinated debt or other junior securities; (iv) create liens ranking pari passu in right of payment with or subordinated in right of payment to First Lien Notes due 2029; (v) enter into certain transactions with its affiliates; and (vi) merge or consolidate with other companies or transfer all or substantially all of their respective assets. These covenants are subject to a number of important limitations and exceptions. The indenture governing the First Lien Notes due 2029 also provides for events of default, which, if any occur, would permit or require the principal, interest and any other monetary obligations on all the then outstanding First Lien Notes due 2029 to be due and payable immediately.
Odeon Senior Secured Notes due 2027. On October 20, 2022, Odeon Finco PLC, a direct subsidiary of Odeon Cinemas Group Limited (“OCGL”) and an indirect subsidiary of Holdings, issued $
105
among other things: (i) incur additional indebtedness or guarantee indebtedness; (ii) create liens; (iii) declare or pay dividends, redeem stock or make other distributions to stockholders; (iv) make investments; (v) enter into transactions with affiliates; (vi) consolidate, merge, sell or otherwise dispose of all or substantially all of their respective assets; and (vii) impair the security interest in the collateral. These covenants are subject to several important limitations and exceptions. The indenture governing the Odeon Notes due 2027 also provides for events of default, which, if any occur, would permit or require principal, interest and any other monetary obligations on all the then outstanding Odeon Notes due 2027 to be due and payable immediately. The Company used the $
Prior to November 1, 2024, up to
Second Lien Notes due 2026. In connection with the Exchange Offers on July 31, 2020, Holdings issued $
In connection with the Exchange Offers and the First Lien Notes due 2026, Holdings issued shares of Common Stock to certain holders of subordinated notes as consideration for their commitment to backstop the issuance of $
The Second Lien Notes bear cash interest at a rate of
106
The Second Lien Notes were redeemable at Holdings’ option prior to June 15, 2023, at a redemption price equal to
Prior to the Refinancing Transactions, with the consent of the holders of two-thirds of the outstanding Second Lien Notes, Holdings, the Existing Guarantors and the Trustee and Notes Collateral Agent entered into a supplemental indenture (the “Supplemental Indenture”) to the Second Lien Notes Indenture. Among other things, the Supplemental Indenture (i) eliminated substantially all of the restrictive covenants, certain events of default and the related provisions contained in the Second Lien Notes Indenture and (ii) released the existing subsidiary guarantees of, and the liens on the collateral securing the obligations of Holdings under, the Second Lien Notes Indenture. The Supplemental Indenture did not modify any subordination provision or the maturity or economic terms of the Second Lien Notes.
Senior Subordinated Debt Exchange Offers
On July 31, 2020, Holdings consummated private offers to exchange (the “Exchange Offers”) any and all of its outstanding
The Company performed an assessment on a lender-by-lender basis to identify certain lenders that met the criteria for a troubled debt restructuring (“TDR”) under ASC 470-60, Troubled Debt Restructurings by Debtors (“ASC 470-60”) as the Company was experiencing financial difficulties and the lenders granted a concession. The portion of the loans that did not meet the assessment of TDR under ASC 470-60 were treated as modifications. The Company accounted for the exchange of approximately $
Senior Subordinated Notes due 2024. On November 8, 2016, Holdings issued £
On March 17, 2017, Holdings issued £
On July 31, 2020, as part of the Exchange Offers, the Company reduced the aggregate principal amount of Sterling Notes due 2024 by approximately $
On November 15, 2024, the maturity date, Holdings repaid the remaining £
107
Senior Subordinated Notes due 2025. On June 5, 2015, Holdings issued $
On June 5, 2015, in connection with the issuance of the Senior Subordinated Notes due 2025, Holdings entered into a registration rights agreement. Subject to the terms of the registration rights agreement, Holdings filed a registration statement with the SEC on June 19, 2015 pursuant to the Securities Act relating to an offer to exchange the original Senior Subordinated Notes due 2025 for exchange Senior Subordinated Notes due 2025; the registration statement was declared effective on June 29, 2015, and Holdings commenced the exchange offer. The exchange notes have terms substantially identical to the original notes except that the exchange notes do not contain terms with respect to transfer restrictions and registration rights and additional interest payable for the failure to consummate the exchange offer. All of the original notes were exchanged as of July 27, 2015.
On July 31, 2020, as part of the Exchange Offers, the Company reduced the aggregate principal amount of the Senior Subordinated Notes due 2025 by approximately $
Senior Subordinated Notes due 2026. On November 8, 2016, Holdings issued $
On November 8, 2016, in connection with the issuance of the Senior Subordinated Notes due 2026, Holdings entered into a registration rights agreement. Subject to the terms of the registration rights agreement, Holdings filed a registration statement with the SEC on April 19, 2017 pursuant to the Securities Act relating to an offer to exchange the original Senior Subordinated Notes due 2026 for exchange Senior Subordinated Notes due 2026; the registration statement was declared effective on June 7, 2017, and Holdings commenced the exchange offer. The exchange notes have terms substantially identical to the original notes except that the exchange notes do not contain terms with respect to transfer restrictions and registration rights and additional interest payable for the failure to consummate the exchange offer. All of the original notes were exchanged as of July 12, 2017.
On July 31, 2020, as part of the Exchange Offers, the Company reduced the aggregate principal amount of the Senior Subordinated Notes due 2026 by approximately $
Senior Subordinated Notes due 2027. On March 17, 2017, Holdings issued $
On March 17, 2017, in connection with the issuance of the Senior Subordinated Notes due 2027, Holdings entered into a registration rights agreement. Subject to the terms of the registration rights agreement, Holdings filed a registration statement with the SEC on April 19, 2017 pursuant to the Securities Act relating to an offer to exchange the original Senior Subordinated Notes due 2027 for exchange Senior Subordinated Notes due 2027; the registration
108
statement was declared effective on June 7, 2017, and Holdings commenced the exchange offer. The exchange notes have terms substantially identical to the original notes except that the exchange notes do not contain terms with respect to transfer restrictions and registration rights and additional interest payable for the failure to consummate the exchange offer. All of the original notes were exchanged as of July 12, 2017.
On July 31, 2020, as part of the Exchange Offers, the Company reduced the aggregate principal amount of the Senior Subordinated Notes due 2027 by approximately $
First Lien Notes Due 2025. On April 24, 2020, Holdings issued $
First Lien Notes due 2026. The First Lien Notes due 2026 bore interest at a rate of
First Lien Toggle Notes due 2026. The First Lien Toggle Notes due 2026 bore cash interest at a rate of
Odeon Term Loan Facility. On February 15, 2021, OCGL, a wholly-owned subsidiary of Holdings, entered into a new £
Covenant Compliance
As of December 31, 2024, the Company believes that it was in full compliance with all agreements, including related covenants, governing its outstanding debt.
109
NOTE 9—STOCKHOLDERS’ DEFICIT
Share Rights and Privileges
Common Stock
Holders of the Company’s Common Stock are entitled to
AMC Preferred Equity Units
Each AMC Preferred Equity Unit was a depositary share and represented an interest in a share of Series A Convertible Participating Preferred Stock evidenced by a depositary receipt pursuant to a deposit agreement. Each AMC Preferred Equity Unit was designed to have the same economic and voting rights as a share Common Stock.
Preferred Stock
The Company has
Shareholder Litigation
This litigation prevented the Company from immediately implementing the Charter Amendments. On April 2, 2023, the parties entered into a binding settlement term sheet to settle the litigation and allow implementation of the Charter Amendments. On August 11, 2023, the Delaware Chancery Court approved the settlement and on August 21, 2023, the Delaware Supreme Court confirmed the ruling of the Chancery Court. Pursuant to the settlement term sheet, record holders of Common Stock at the close of business on August 24, 2023, after giving effect to the Reverse Stock Split, but prior to the conversion of AMC Preferred Equity Units into Common Stock (“Settlement Payment Recipients”), received a payment of share of Common Stock for every 7.5 shares of Common Stock owned by such Settlement Payment Recipients (the “Settlement Payment”). On August 28, 2023, the Company made the settlement payment and issued
Charter Amendments and AMC Preferred Equity Unit Conversion
On August 14, 2023, the Company filed an amendment to its Certificate of Incorporation to effectuate the Charter Amendments as of August 24, 2023. The Charter Amendments permitted the conversion of all of the Company’s outstanding AMC Preferred Equity Units into shares of Common Stock (the “Conversion”). On August 25, 2023,
AMC’s Board of Directors approved equitable adjustments to all outstanding awards under the 2013 Equity Incentive Plan subsequent to the effectiveness of the Charter Amendments. The outstanding awards were proportionally adjusted consistent with the ratio used for the Reverse Stock Split and all awards previously convertible into AMC Preferred Equity Units are now convertible into Common Stock.
110
Stock Split and Reverse Stock Split
On August 4, 2022, the Company announced that its Board of Directors declared a special dividend of
On August 24, 2023, the Company effectuated a reverse stock split at a ratio of share of Common Stock for every ten shares of Common Stock. As a result of the reverse stock split, each share of Series A Convertible Participating Preferred Stock became convertible into ten shares of Common Stock, and by extension each AMC Preferred Equity Unit became equivalent to -tenth (1/10th) of a share of Common Stock. The reverse stock split did not impact the number of AMC Preferred Equity Units outstanding. The Company concluded that this change in conversion ratio is analogous to a reverse stock split of the AMC Preferred Equity Units even though the reverse stock split did not have an effect on the number of AMC Preferred Equity Units outstanding.
Accordingly, all references made to share, per share, unit, per unit, or common share amounts in the accompanying consolidated financial statements and applicable disclosures have been retroactively adjusted to reflect both the effects of the special dividend as a stock split and the subsequent reverse stock split. References made to AMC Preferred Equity Units have been retroactively adjusted to reflect the effect of the reverse stock split on their equivalent Common Stock shares.
Share Issuances
On December 6, 2024, the Company entered into a sales and registration agreement (the “Sales and Registration Agreement”) with Goldman Sachs & Co. LLC, from time to time acting in its capacity as (1) sales agent (in such capacity, the “Sales Agent”) or (2) the Forward Seller of any and all Hedging Shares offered by the Forward Counterparty under one or more Forwards (in each case, as defined below) relating to an aggregate of up to
In accordance with the terms of the Sales and Registration Agreement, the Company may issue and sell shares of Common Stock covered by the prospectus supplement at any time and from time to time through the Sales Agent. The Sales Agent may act as agent on the Company’s behalf or purchase shares of Common Stock from the Company as principal for its own account.
The Company also entered into a master confirmation (the “Master Confirmation”) with Goldman Sachs International (in its capacity as buyer under any Forward (as hereinafter defined), the “Forward Counterparty”) pursuant to which the Company entered into forward transactions (each a “Forward”), under which the Company agreed to sell the number of shares of Common Stock specified in such Forward (subject to adjustment as set forth therein) to the Forward Counterparty. In respect of each Forward, to enable the Forward Counterparty to establish a hedge position with respect to such Forward, the Company effectively pledged up to the maximum number of shares of Common Stock deliverable under such Forward (the “Hedging Shares”), and to establish a hedge position under such Forward, the Forward Counterparty rehypothecated and sold such maximum number of shares through Goldman Sachs & Co. LLC acting as the statutory underwriter (in such capacity, the “Forward Seller”) in an offering under a prospectus supplement and accompanying prospectus over a period of time agreed between the Company and the Forward Counterparty for such Forward (an “Initial Hedging Period”), all subject to the terms of the Sales and Registration Agreement.
On each trading day during the respective Initial Hedging Periods for each Forward, the Company instructed the Forward Counterparty on a day-by-day basis to sell a specified number of its shares, the total of each such trading day’s sales representing a component of such Forward (each a “Component”). The volume weighted average price per share for sales executed by the Forward Seller during the Initial Hedging Period for each Component (the “Reference Price”) was used to determine the floor price (“Forward Floor Price”) and cap price (“Forward Cap Price”) for such Component.
The Forward Floor Price is intended to mitigate the downside risk of any potential decline in the share price below the Forward Floor Price during the valuation period, which extends approximately six months after the outside date to the Initial Hedging Period agreed between the Company and the Forward Counterparty. The Forward Cap Price limits the potential upside benefit to the extent the share price were to exceed the Forward Cap Price during the valuation period.
111
The Company is entitled to a prepayment (a “Prepayment”), calculated on a Component basis for each Forward, in an amount equal to the product of (i) the number of shares sold by the Forward Seller during the Initial Hedging Period for such Forward, (ii) the Forward Floor Price and (iii) the relevant prepayment percentage agreed for such Forward. The Company received a Prepayment in respect of each Forward approximately three weeks after the completion of the Initial Hedging Period of the latest Forward.
Each Forward is subject to a subsequent valuation period (the “Valuation Period”) that starts to run shortly after the outside date to the Initial Hedging Period agreed between the Company and the Forward Counterparty and ends on the final settlement date (the “Final Settlement Date”), subject to any acceleration of the scheduled maturity date of all or portion(s) of such Forward at the election of the Forward Counterparty. This Valuation Period determines the final settlement of the Forward Counterparty’s purchase price through a true-up payment from the Forward Counterparty to the Company if the total amount due under any such Forward exceeds the Prepayment (the “True-Up Payment”).
The Forward Counterparty will make the True-Up Payment to the Company on a Component-by-Component basis. Each such payment in respect of each Component is equal to a modified forward price (the “Modified Forward Price”) multiplied by the specified number of shares for such Component. The Modified Forward Price is determined as follows:
| (i) | If the Settlement Price (defined as the arithmetic average volume weighted average price over the Valuation Period) is less than or equal to the Forward Floor Price, zero; |
| (ii) | If the Settlement Price is greater than the Forward Floor Price but less than or equal to the Forward Cap Price, such Settlement Price minus the Forward Floor Price; and |
| (iii) | If the Settlement Price is greater than the Forward Cap Price, the Forward Cap Price minus the Forward Floor Price. |
The Company may elect to receive the True-Up Payment in cash or shares of Common Stock. Additionally, the Forward Counterparty is required to pay the Company any remaining Prepayment amount on the Final Settlement Date.
Pursuant to the agreements described above, the Company entered into Forwards to sell
The Company evaluated the Forwards under ASC 815—Derivatives and Hedging and concluded that the transactions consist of a subscription receivable accounted for under ASC 505-10-45-2 reflecting the Company’s right to receive the Prepayment and deliver shares to the Forward Counterparty. Accordingly, pursuant to Regulation S-X 5-02.29, the Company recorded the Prepayment as an increase to additional paid in capital with an equal and offsetting subscription receivable as a decrease to additional paid in capital. The subscription receivable is considered a debt-like host and the Company’s right to receive additional cash consideration up to the Forward Cap Price based on the movement of the share price during the Valuation Period is an embedded feature that meets the definition of a derivative. Because the True-Up Payment can be received in cash or shares of Common Stock at the Company’s election and the value mechanics within the instrument are all indexed to the Company’s own Common Stock, the embedded feature meets the equity classification scope exception in ASC 815-40 and is not accounted for outside of equity. As the proceeds from the Forwards are received, the subscription receivable will be reduced which will result in an increase in total additional paid in capital. During January 2025, the Company recorded an increase to additional paid in capital of $
During the years ended December 31, 2024, December 31, 2023 and December 31, 2022, the Company entered into various equity distribution agreements with sales agents to sell shares of the Company’s Common Stock and AMC Preferred Equity Units, from time to time, through “at-the-market” offering programs. Subject to the terms and conditions of the equity distribution agreements, the sales agents used reasonable efforts consistent with their normal
112
trading and sales practices, applicable law and regulations, and the rules of the NYSE to sell the Common Stock and AMC Preferred Equity Units from time to time based upon the Company’s instructions for the sales, including any price, time or size limits specified by the Company.
The below table summarizes the activity of the various “at-the-market” offerings for the years ending December 31, 2024, December 31, 2023 and December 31, 2022.
Common Stock |
AMC Preferred Equity Units |
|||||||||
December 31, |
December 31, |
|||||||||
(In millions) |
2024 |
2023 |
2022 |
2024 |
2023 |
2022 |
||||
Shares or units issued |
|
|
- |
- |
|
|
||||
Gross proceeds |
$ |
|
|
- |
$ |
- |
|
|
||
Sales agent fees paid |
|
|
- |
- |
|
|
||||
Other third-party issuance costs incurred |
|
|
- |
- |
|
|
||||
Other third-party issuance costs paid |
|
|
- |
- |
|
|
||||
The Company has used and intends to use the net proceeds from the sale of Common Stock and AMC Preferred Equity Units pursuant to the equity distribution agreements to repay, refinance, redeem or repurchase the Company’s existing indebtedness (including expenses, accrued interest and premium, if any), capital expenditures and otherwise for general corporate purposes.
Antara Transactions
On December 22, 2022, the Company entered into the Forward Purchase Agreement with Antara pursuant to which the Company agreed to (i) sell Antara
Immediately prior to entry into the Forward Purchase Agreement, Antara purchased
Stock-Based Compensation
Equity Incentive Plans
On June 5, 2024, the Company’s shareholders approved a new equity incentive plan (“2024 EIP”). The 2024 EIP has
The 2013 equity incentive plan, as amended (“2013 EIP”), provided for grants of non-qualified stock options, incentive stock options, stock appreciation rights, restricted stock awards, restricted stock units (“RSUs”), performance stock units (“PSUs”), stock awards, and cash performance awards. The 2013 EIP expired on December 17, 2023 and was replaced by the 2024 EIP. Awards granted under the 2013 EIP will continue to vest over their remaining requisite service periods, the latest of which ends in January 2026.
113
The following table presents the stock-based compensation expense recorded within general and administrative: other:
Year Ended |
|||||||||
December 31, |
December 31, |
December 31, |
|||||||
(In millions) |
2024 |
2023 |
2022 |
||||||
Equity classified awards: |
|||||||||
Special awards expense |
$ |
|
$ |
|
$ |
— |
|||
Board of director stock award expense |
|
|
|
||||||
Restricted stock unit expense |
|
|
|
||||||
Performance stock unit expense |
|
|
|
||||||
Total equity classified awards: |
|
|
|
||||||
Liability classified awards: |
|||||||||
Restricted and performance stock unit expense |
|
|
— |
||||||
Total liability classified awards: |
|
|
— |
||||||
Total stock-based compensation expense |
$ |
|
$ |
|
$ |
|
|||
As of December 31, 2024, the estimated remaining unrecognized compensation cost related to stock-based compensation arrangements was approximately $
Plan Amendment due to Stock Split
The 2013 EIP contemplated equitable adjustments for certain transactions such as a stock split. On August 19, 2022, the Compensation Committee approved an adjustment to the 2013 EIP to entitle each participant
Awards Granted
The Company’s Board of Directors approved awards of stock, RSUs, and PSUs to certain of the Company’s employees and directors under the Company’s equity incentive plans. Each RSU or PSU is convertible into
Each RSU and PSU held by a participant as of a dividend record date is entitled to a dividend equivalent equal to the amount paid in respect to
The Company’s Board of Directors also granted awards to certain non-section 16 officers that are expected to be settled in cash. Upon vesting grantees will receive an amount of cash equal to the closing price of Common Stock multiplied by the number of underlying cash-based RSUs and PSUs awarded. These awards have been classified as liabilities and are include within accrued expenses and other liabilities in the consolidated balance sheets. The vesting requirements and vesting periods are identical to the equity classified awards described below. The Company recognizes expense related to these awards based on the fair value of the Common Stock shares, giving effect to the portion of services rendered during the requisite services period. As of December 31, 2024, there were
114
The awards granted under the Company’s equity incentive plans generally had the following features:
| ● | Board of Director Stock Awards: The Company granted fully vested shares of Common Stock and AMC Preferred Equity Units to the independent members of its Board of Directors during the years ended December 31, 2024, Decembers 31, 2023, and December 31, 2022 as follows: |
Year Ended |
||||||
December 31, 2024 |
December 31, 2023 |
December 31, 2022 |
||||
Common Stock |
|
|
|
|||
AMC Preferred Equity Units |
— |
|
|
|||
| ● |
Restricted Stock Unit Awards: The Company granted RSU awards of |
| ● | Performance Stock Unit Awards: |
2024 PSU Awards. During 2024,
The Compensation Committee establishes the annual performance targets at the beginning of each year. Therefore, the grant date (and fair value measurement date) for each Tranche Year is the date at the beginning of each year when a mutual understanding of the key terms and conditions are reached per ASC 718, Compensation - Stock Compensation.
The 2024 PSU award grant date fair value for the 2024 Tranche Year award of
At December 31, 2024, the 2024 Tranche Year performance targets for both the annual Adjusted EBITDA and free cash flow were attained at
2023 PSU Awards. During 2023,
2022 PSU Awards. During 2022,
115
to
2021 PSU Awards. During 2021,
2020 PSU Awards: During the year ended December 31, 2020, PSU awards of
Special Awards
On February 22, 2024, the compensation committee of AMC’s Board of Directors (“Compensation Committee”) approved modification of the performance goals applicable to all 2023 Tranche Year PSU awards. This was accounted for as a modification to the 2023 Tranche Year PSU awards which lowered the Adjusted EBITDA and free cash flow performance targets such that
On February 23, 2023, the Compensation Committee approved special awards in lieu of vesting of the 2022 Tranche Year PSU awards. The special awards were accounted for as modification to the 2022 Tranche Year PSU awards which lowered the Adjusted EBITDA and free cash flow performance targets such that
116
The following table represents the nonvested RSU and PSU activity for the years ended December 31, 2024, December 31, 2023 and December 31, 2022:
|
|
||||
Weighted |
|||||
Average |
|||||
Common Stock |
Grant Date |
||||
RSUs and PSUs (3) |
Fair Value |
||||
Beginning balance at January 1, 2022 |
|
$ |
|
||
Granted |
|
|
|||
Vested |
( |
|
|||
Forfeited |
( |
|
|||
Cancelled (1) |
( |
|
|||
Nonvested at January 1, 2023 |
|
|
|||
Granted |
|
|
|||
Granted - Special Award |
|
|
|||
Vested |
( |
|
|||
Vested - Special Award |
( |
|
|||
Forfeited |
( |
|
|||
Cancelled (1) |
( |
|
|||
Cancelled - Special Award (1) |
( |
|
|||
Nonvested at January 1, 2024 |
|
|
|||
Granted (2) |
|
|
|||
Granted - Special Award |
|
|
|||
Vested |
( |
|
|||
Vested - Special Award |
( |
|
|||
Forfeited (2) |
( |
|
|||
Cancelled (1) |
( |
|
|||
Cancelled - Special Award (1) |
( |
|
|||
Nonvested at December 31, 2024 |
|
|
|||
Tranche Years 2025 and 2026 awarded under the 2024 PSU award and Tranche Year 2025 awarded under the 2023 PSU award with grant date fair values to be determined in year 2025 and 2026, respectively |
|
||||
Total Nonvested at December 31, 2024 |
|
||||
| (1) | Represents vested RSUs and PSUs surrendered in lieu of taxes and cancelled awards returned. |
| (2) |
The number of PSU shares granted and forfeited under the Tranche Year 2023 is based on attainment of performance targets at |
| (3) | Includes AMC Preferred Equity Unit RSUs and PSUs that were subsequently converted to Common Stock RSUs and PSUs as a result of the Charter Amendments. |
117
NOTE 10—INCOME TAXES
Current income tax expense represents the amounts expected to be reported on the Company’s income tax returns, and deferred tax expense or benefit represents the change in net deferred tax assets and liabilities. Deferred tax assets and liabilities are determined based on the difference between the financial statement and tax bases of assets and liabilities as measured by the enacted tax rates that will be in effect when these differences reverse. Valuation allowances are recorded as appropriate to reduce deferred tax assets to the amount considered likely to be realized.
The Company evaluates its deferred tax assets each period to determine if a valuation allowance is required based on whether it is “more likely than not” that some portion of the deferred tax assets would not be realized. The ultimate realization of these deferred tax assets is dependent upon the generation of sufficient taxable income during future periods on a federal, state and foreign jurisdiction basis. The Company conducts its evaluation by considering all available positive and negative evidence, including historical operating results, forecasts of future profitability, the duration of statutory carryforward periods, and the outlooks for the U.S. motion picture and broader economy, among others. A significant piece of objective negative evidence evaluated was the cumulative loss incurred over the three-year period ended December 31, 2024 for each taxing jurisdiction. Such objective evidence limits the ability to consider other subjective evidence, such as the Company’s projections of future taxable income. For the year ended December 31, 2024, the Company remained in a cumulative loss over the past three-year period for the U.S. and international jurisdictions except for Finland.
The Company maintains a valuation allowance against U.S. deferred tax assets as well as international jurisdictions in which it operates, with the exception of Finland.
The actual effective rate for the year ended December 31, 2024 was (
The income tax provision reflected in the consolidated statements of operations consists of the following components:
Year Ended |
||||||||||
(In millions) |
|
December 31, 2024 |
|
December 31, 2023 |
|
December 31, 2022 |
|
|||
Current: |
||||||||||
Federal |
$ |
— |
$ |
— |
$ |
— |
||||
Foreign |
|
|
|
|
|
|
||||
State |
|
( |
|
|
|
( |
||||
Total current |
|
|
|
|
|
|
||||
Deferred: |
||||||||||
Federal |
|
|
|
|
|
|
||||
Foreign |
|
( |
|
( |
|
|
||||
State |
|
|
|
|
|
|
||||
Total deferred |
|
|
|
|
|
|
||||
Total provision |
$ |
|
$ |
|
$ |
|
||||
Pre-tax losses consisted of the following:
Year Ended |
||||||||||
(In millions) |
|
December 31, 2024 |
|
December 31, 2023 |
|
December 31, 2022 |
|
|||
Domestic |
$ |
( |
$ |
( |
$ |
( |
||||
Foreign |
|
( |
|
( |
|
( |
||||
Total |
$ |
( |
$ |
( |
$ |
( |
||||
118
The difference between the effective tax rate on net loss from continuing operations before income taxes and the U.S. federal income tax statutory rate is as follows:
Year Ended |
||||||||||
(In millions) |
|
December 31, 2024 |
|
December 31, 2023 |
|
December 31, 2022 |
|
|||
Income tax benefit at the federal statutory rate |
$ |
( |
$ |
( |
$ |
( |
||||
Effect of: |
||||||||||
State income taxes |
|
( |
|
( |
|
( |
||||
Increase in reserve for uncertain tax positions |
|
— |
|
( |
|
— |
||||
Federal and state credits |
|
( |
|
( |
|
( |
||||
Permanent items — other |
|
( |
|
|||||||
Foreign rate differential |
( |
( |
( |
|||||||
Original issue discount |
— |
— |
( |
|||||||
Other |
|
|
|
|
|
( |
||||
Valuation allowance |
|
|
|
|
|
|
||||
Income tax provision |
$ |
|
$ |
|
$ |
|
||||
Effective income tax rate |
|
( |
% |
|
( |
% |
|
( |
% |
|
The significant components of deferred income tax assets and liabilities as of December 31, 2024 and December 31, 2023 are as follows:
December 31, 2024 |
December 31, 2023 |
|||||||||||
Deferred Income Tax |
Deferred Income Tax |
|||||||||||
(In millions) |
|
Assets |
|
Liabilities |
|
Assets |
|
Liabilities |
||||
Tangible assets |
|
$ |
— |
|
$ |
( |
|
$ |
— |
|
$ |
( |
Right-of-use assets |
— |
( |
— |
( |
||||||||
Accrued liabilities |
|
|
|
— |
|
|
|
— |
||||
Intangible assets |
|
— |
|
( |
|
— |
|
( |
||||
Receivables |
|
|
|
— |
|
|
|
— |
||||
Investments |
|
|
|
— |
|
|
|
— |
||||
Capital loss carryforwards |
|
|
|
— |
|
|
|
— |
||||
Pension and deferred compensation |
|
|
|
— |
|
|
|
— |
||||
Corporate borrowings |
|
— |
|
( |
|
|
|
— |
||||
Disallowed interest |
|
— |
|
— |
||||||||
Deferred revenue |
|
|
|
— |
|
|
|
— |
||||
Lease liabilities |
|
|
|
— |
|
|
|
— |
||||
Finance lease obligations |
|
— |
|
— |
|
|
|
— |
||||
Other credit carryovers |
|
|
|
— |
|
|
|
— |
||||
Net operating loss carryforwards |
|
|
|
— |
|
|
|
— |
||||
Total |
$ |
|
$ |
( |
$ |
|
$ |
( |
||||
Less: Valuation allowance |
|
( |
|
— |
|
( |
|
— |
||||
Net deferred income taxes |
$ |
|
$ |
( |
$ |
|
$ |
( |
||||
A rollforward of the Company’s valuation allowance for deferred tax assets is as follows:
Additions |
Charged |
|||||||||
Balance at |
Charged |
(Credited) |
||||||||
Beginning of |
to |
to Other |
Balance at |
|||||||
(In millions) |
|
Period |
|
Expenses(1) |
|
Accounts(2) |
|
End of Period |
||
Calendar Year 2024 |
||||||||||
Valuation allowance-deferred income tax assets |
$ |
|
|
( |
$ |
|
||||
Calendar Year 2023 |
||||||||||
Valuation allowance-deferred income tax assets |
$ |
|
|
|
$ |
|
||||
Calendar Year 2022 |
||||||||||
Valuation allowance-deferred income tax assets |
$ |
|
|
( |
$ |
|
||||
| (1) | Primarily relates to the Company’s increase in the current year’s federal, state, and international net operating losses. |
119
| (2) | Primarily relates to amounts resulting from the Company’s changes in deferred tax assets and associated valuation allowance that are not related to income statement activity, as well as amounts charged to other comprehensive income. |
The Company has federal income tax net operating loss carryforwards of $
A reconciliation of the change in the amount of unrecognized tax benefits was as follows:
Year Ended |
|||||||||
(In millions) |
|
December 31, 2024 |
|
December 31, 2023 |
|
December 31, 2022 |
|||
Balance at beginning of period |
$ |
|
$ |
|
$ |
|
|||
Gross decreases—expiration of statute of limitations |
— |
( |
( |
||||||
Balance at end of period |
$ |
|
$ |
|
$ |
|
|||
There are currently $
The Company, or
Utilization of the Company’s net operating loss carryforwards, disallowed business interest carryforward and other tax attributes became subject to the Section 382 ownership change limitation due to changes in our stock ownership on January 29, 2021. Management believes the Company’s ability to utilize these tax attributes has not been significantly limited by this event.
NOTE 11—COMMITMENTS AND CONTINGENCIES
The Company, in the normal course of business, is a party to various ordinary course claims from vendors (including food and beverage suppliers and film distributors), landlords, competitors, and other legal proceedings. If management believes that a loss arising from these actions is probable and can reasonably be estimated, the Company records the amount of the loss, or the minimum estimated liability when the loss is estimated using a range and no point is more probable than another. As additional information becomes available, any potential liability related to these actions is assessed and the estimates are revised, if necessary. Management believes that the ultimate outcome of such matters discussed below, individually and in the aggregate, will not have a material adverse effect on the Company’s financial position or overall trends in results of operations. However, litigation and claims are subject to inherent uncertainties and unfavorable outcomes can occur. An unfavorable outcome might include monetary damages. If an unfavorable outcome were to occur, there exists the possibility of a material adverse impact on the results of operations in the period in which the outcome occurs or in future periods. An unfavorable outcome could also have a material adverse effect on the Company’s financial position or the market prices of the Company’s securities, including the Company’s Common Stock.
120
On April 22, 2019, a putative stockholder class and derivative complaint, captioned Lao v. Dalian Wanda Group Co., Ltd., et al., C.A. No. 2019-0303-JRS (the “Lao Action”), was filed against certain of the Company’s directors, Wanda, two of Wanda’s affiliates, Silver Lake, and one of Silver Lake’s affiliates in the Delaware Court of Chancery. The Lao Action asserted claims directly, on behalf of a putative class of Company stockholders, and derivatively, on behalf of the Company, for breaches of fiduciary duty and aiding and abetting breaches of fiduciary duty with respect to transactions that the Company entered into with affiliates of Wanda and Silver Lake on September 14, 2018, and the special cash dividend of $
On February 20, 2023,
On February 27, 2023, the Delaware Court of Chancery entered a status quo order that allowed the March 14, 2023 vote on the Charter Amendments to proceed, but precluded the Company from implementing the Charter Amendments pending a ruling by the court on the plaintiffs’ then-anticipated preliminary injunction motion (the “Status Quo Order”).
On April 2, 2023, the parties entered into a binding settlement term sheet to settle the Shareholder Litigation, which among other things, provided that the parties would jointly request that the Status Quo Order be lifted. Pursuant to the term sheet, the Company agreed, following and subject to AMC’s completion of the Conversion and Reverse Stock Split, to make a non-cash settlement payment to record holders of Common Stock immediately prior to the Conversion (and after giving effect to the Reverse Stock Split) of share of Common Stock for every 7.5 shares of Common Stock owned by such record holders (the “Settlement Payment”). The Company’s obligation to make the Settlement Payment was contingent on the Status Quo Order being lifted and the Company effecting the Charter Amendments. The defendants agreed to the settlement and the payment of the Settlement Payment solely to eliminate the burden, expense, and uncertainty of further litigation, and continue to expressly deny any liability or wrongdoing with respect to the matters alleged in the Shareholder Litigation. On April 3, 2023, the plaintiffs filed an unopposed motion to lift the Status Quo Order. On April 5, 2023, the court denied the motion to lift the Status Quo Order.
121
On April 27, 2023, the parties jointly filed a Stipulation and Agreement of Compromise, Settlement, and Release (the “Settlement Stipulation”) with the court, which fully memorialized the settlement that the parties agreed to in the term sheet. On June 29–30, 2023, the court held a settlement hearing to consider whether to approve the settlement as outlined in the Settlement Stipulation.
On July 21, 2023, the court issued an opinion which, citing issues with the scope of the release sought under the proposed settlement, declined to approve the settlement as presented. On July 22, 2023, the parties filed an addendum to the Settlement Stipulation in an effort to address the issues with the scope of the release raised by the court and requested that the court approve the settlement with the revised release set forth in the addendum.
On August 11, 2023, the court approved the settlement of the Shareholder Litigation and lifted the Status Quo Order. On August 14, 2023, the Company filed the amendment to its Third Amended and Restated Certificate of Incorporation, effective as of August 24, 2023, which was previously approved by the Company’s stockholders at the special meeting held on March 14, 2023 to implement the Charter Amendments. The Reverse Stock Split occurred on August 24, 2023, the conversion of AMC Preferred Equity Units into Common Stock occurred on August 25, 2023, and the Settlement Payment was made on August 28, 2023. On September 15, 2023, the court entered an order dismissing the Shareholder Litigation in its entirety and with prejudice. On October 13, 2023, a purported Company stockholder who objected to the settlement of the Shareholder Litigation filed a notice of appeal of the court’s decision approving the settlement. On May 22, 2024, the Delaware Supreme Court affirmed the court’s decision approving the settlement of the Shareholder Litigation. On August 20, 2024, the purported stockholder who appealed to the Delaware Supreme Court filed a petition for a writ of certiorari with the United States Supreme Court, which was denied on October 7, 2024.
In connection with the Settlement Payment, the Company recorded a $
On August 14, 2023, a putative class action on behalf of holders of AMC Preferred Equity Units, captioned Simons v. AMC Entertainment Holdings, Inc., C.A. No. 2023-0835-MTZ (the “Simons Action”), was filed against the Company in the Delaware Court of Chancery. The Simons Action asserted claims for a declaratory judgment, injunctive relief, and breach of contract, and alleged that the Settlement Payment in the Shareholder Litigation violates the Certificate of Designations that governed the AMC Preferred Equity Units prior to the conversion of the AMC Preferred Equity Units into Common Stock. On September 12, 2023, the Company filed a motion to dismiss the complaint. On December 26, 2023, plaintiff filed an amended complaint, which added a claim for breach of the implied covenant of good faith and fair dealing. On February 16, 2024, the Company filed a motion to dismiss the amended complaint. On October 2, 2024, the court granted the Company’s motion to dismiss, and dismissed the amended complaint with prejudice. On October 30, 2024, the plaintiff filed a notice of appeal in the Delaware Supreme Court.
On May 4, 2023, the Company filed a lawsuit in the Superior Court of the State of Delaware against
The primary insurer in the Coverage Action has paid its full $
The remainder of the insurers contest whether they owe coverage for the Settlement Payment, claiming it does not constitute a “Loss” under their insurance policies. AMC may have claims for coverage from additional insurers as well, however, those insurers’ policies contain mandatory arbitration provisions, so they have not been included in the Coverage Action.
122
On October 6, 2023, an action captioned Mathew, et al. v. Citigroup Global Markets, et al., Case No. 1:23-cv-12302-FDS (the “Mathew Action”), was filed in the U.S. District Court for the District of Massachusetts. The Mathew Action names the Company as a nominal defendant. On November 16, 2023, plaintiffs filed an amended complaint. On January 9, 2024, the Company filed a motion to dismiss the amended complaint. On January 11, 2024, plaintiffs filed a motion for leave to file a second amended complaint. On January 24, 2024, the Company filed an opposition to plaintiff’s motion for leave to file a second amended complaint. On June 17, 2024, the court granted the Company’s motion to dismiss and denied plaintiffs’ motion for leave to file a second amended complaint.
On December 18, 2023, an action captioned Miller, et al. v. AMC Entertainment Holdings, Inc. et al., C.A. No. 2023-1259-LM (Del. Ch.) (the “Miller Action”), was filed against the Company and two of its officers in the Delaware Court of Chancery. Plaintiffs in the Miller Action sought to inspect certain of the Company’s books and records pursuant to 8 Del. C. § 220 in order to investigate allegations concerning alleged manipulation of the Company’s Common Stock. On February 7, 2024, the parties filed a stipulation dismissing the Company’s two officers from the action. On April 17, 2024, the parties filed a stipulation dismissing the Miller Action with prejudice.
On May 2, 2024, the United States District Court for the Southern District of New York issued an order granting final approval of a proposed settlement reached by all parties to an action brought by plaintiffs Dennis J. Donoghue and Mark Rubenstein, each of whom are shareholders of the Company, for the Company to recover “short-swing” profits under Section 16(b) of the Securities Exchange Act of 1934 (the “Exchange Act”) alleged to have been realized by defendants Antara Capital Master Fund LP, Antara Capital Fund GP LLC, Antara Capital LP, Antara Capital GP LLC, and Himanshu Gulati (collectively, the “Antara Defendants”) in connection with their purchases and sales of the Company’s securities. The Company is party to the suit in name only, which was brought for the benefit of the Company. The Company received $
On September 17, 2024, an action captioned A Holdings – B LLC, et al. v. GLAS Trust Company LLC, Index No. 654878/2024 (the “Noteholder Action”), was filed in the Supreme Court of the State of New York. The Noteholder Action was filed by an ad hoc group of holders of the Company’s Existing First Lien Notes asserting claims for breach of contract and seeking a declaratory judgment against the Company and GLAS Trust Company LLC (“GLAS”), the trustee under the indenture for the Company’s Second Lien Notes, in connection with the Refinancing Transactions announced by AMC on July 22, 2024. Plaintiffs allege that GLAS and the Company breached the first lien/second lien intercreditor agreement dated July 31, 2020 (the “Intercreditor Agreement”) by improperly transferring collateral that secured the Existing First Lien Notes free of such liens and eliminating the Existing First Lien Notes’ priority in certain other collateral in connection with the Refinancing Transactions. An unfavorable outcome, in which it is determined that the Company breached, as claimed, the Intercreditor Agreement, would permit noteholders to claim an event of default occurred under the indenture governing the Existing First Lien Notes and, subject to any conditions in the indenture, permit noteholders to accelerate the Existing First Lien Notes, which could in turn result in the acceleration of the Company’s other outstanding debt. Such an event would thereby have a material adverse effect on our business, financial condition and results of operations and on the market prices of our securities, including our Common Stock. We intend to vigorously defend against any claims made in the Noteholder Action. On November 20, 2024, the Company filed a motion to dismiss the complaint.
NOTE 12—FAIR VALUE MEASUREMENTS
Fair value refers to the price that would be received to sell an asset or paid to transfer a liability in an orderly transaction between market participants in the market in which the entity transacts business. The inputs used to develop these fair value measurements are established in a hierarchy, which ranks the quality and reliability of the information used to determine the fair values. The fair value classification is based on levels of inputs. Assets and liabilities that are carried at fair value are classified and disclosed in one of the following categories:
Level 1: |
Quoted market prices in active markets for identical assets or liabilities. |
Level 2: |
Observable inputs that are corroborated by market data. |
Level 3: |
Unobservable inputs that are not corroborated by market data. |
123
Recurring Fair Value Measurements. The following tables summarize the fair value hierarchy of the Company’s financial assets carried at fair value on a recurring basis:
Fair Value Measurements at December 31, 2024 Using |
||||||||||||
Significant |
||||||||||||
|
Total Carrying |
|
Quoted prices in |
|
Significant other |
|
unobservable |
|||||
Value at |
active market |
observable inputs |
inputs |
|||||||||
(In millions) |
December 31, 2024 |
(Level 1) |
(Level 2) |
(Level 3) |
||||||||
Other long-term assets: |
||||||||||||
Investment in Hycroft warrants |
$ |
|
$ |
— |
$ |
— |
$ |
|
||||
Marketable equity securities: |
||||||||||||
Investment in Hycroft |
|
|
— |
— |
||||||||
Total assets at fair value |
$ |
|
$ |
|
$ |
— |
$ |
|
||||
Corporate Borrowings: |
||||||||||||
$ |
|
$ |
— |
$ |
— |
$ |
|
|||||
Total liabilities at fair value |
$ |
|
$ |
— |
$ |
— |
$ |
|
||||
Fair Value Measurements at December 31, 2023 Using |
||||||||||||
Significant |
||||||||||||
|
Total Carrying |
|
Quoted prices in |
|
Significant other |
|
unobservable |
|||||
Value at |
active market |
observable inputs |
inputs |
|||||||||
(In millions) |
December 31, 2023 |
(Level 1) |
(Level 2) |
(Level 3) |
||||||||
Other long-term assets: |
||||||||||||
Investment in Hycroft warrants |
$ |
|
$ |
— |
$ |
— |
$ |
|
||||
Marketable equity securities: |
||||||||||||
Investment in Hycroft |
|
|
— |
— |
||||||||
Total assets at fair value |
$ |
|
$ |
|
$ |
— |
$ |
|
||||
Derivative liability valuation. On July 22, 2024, the Company issued Exchangeable Notes with conversion features that required bifurcation from the host instrument pursuant to ASC 815—Derivatives and Hedging. These conversion features were combined into a single derivative that comprises all features requiring bifurcation, see Note 8—Corporate Borrowings and Finance Lease Liabilities for further information. The derivative features have been valued using a Binomial Lattice approach. The Binomial Lattice approach consists of simulated Common Stock prices from the valuation date to the maturity of the Exchangeable Notes. The significant inputs used to value the derivative include the initial share price of the Common Stock, the volatility of the share price, time to maturity, risk-free interest rate, credit spread, and the discount yield. The estimated fair value of the derivative liability on July 22, 2024 was $
124
Nonrecurring Fair Value Measurements. The following fair value hierarchy tables summarize the Company’s assets that were written down to their fair value on a nonrecurring basis as part of the Company’s impairment evaluation and the nonrecurring fair value measurements of the bond component of the Company’s Exchangeable Notes:
Fair Value Measurements at December 31, 2024 Using |
|||||||||||||||
|
|
Significant other |
|
Significant |
|
||||||||||
|
Total Carrying |
Quoted prices in |
observable |
unobservable |
Total |
||||||||||
Value at |
active market |
inputs |
inputs |
Impairment |
|||||||||||
(In millions) |
|
December 31, 2024 |
|
(Level 1) |
|
(Level 2) |
|
(Level 3) |
|
Losses |
|||||
Property, net: |
|||||||||||||||
Property, net |
$ |
|
$ |
— |
$ |
— |
$ |
|
$ |
|
|||||
Operating lease right-of-use assets |
|||||||||||||||
Operating lease right-of-use assets |
|
— |
— |
|
|
||||||||||
Total |
$ |
|
$ |
— |
$ |
— |
$ |
|
$ |
|
|||||
Fair Value Measurements at December 31, 2023 Using |
|||||||||||||||
|
|
Significant other |
|
Significant |
|
||||||||||
|
Total Carrying |
Quoted prices in |
observable |
unobservable |
Total |
||||||||||
Value at |
active market |
inputs |
inputs |
Impairment |
|||||||||||
(In millions) |
|
December 31, 2023 |
|
(Level 1) |
|
(Level 2) |
|
(Level 3) |
|
Losses |
|||||
Property, net: |
|||||||||||||||
Property, net |
$ |
|
$ |
— |
$ |
— |
$ |
|
$ |
|
|||||
Operating lease right-of-use assets: |
|||||||||||||||
Operating lease right-of-use assets |
|
— |
— |
|
|
||||||||||
Other long-term assets: |
|||||||||||||||
Cost method investments (1) |
|
— |
— |
|
|
||||||||||
Total |
$ |
|
$ |
— |
$ |
— |
$ |
|
$ |
|
|||||
| (1) | Impairment losses for cost method investments are recorded in investment expense (income). |
Valuation Techniques. There is considerable management judgment with respect to cash flow estimates and appropriate discount rates to be used in determining fair value, and, accordingly, actual results could vary significantly from such estimates, which fall under Level 3 within the fair value measurement hierarchy. Such judgments and estimates include estimates of future attendance, revenues, cash flows, rent relief, cost savings, capital expenditures, and the cost of capital, among others. At December 31, 2024, related cash flows were discounted at
Fair Value Measurements at July 22, 2024 Using |
|||||||||||||||
|
|
Significant other |
|
Significant |
|
||||||||||
|
Total Carrying |
Quoted prices in |
observable |
unobservable |
|||||||||||
Value at |
active market |
inputs |
inputs |
Total |
|||||||||||
(In millions) |
|
July 22, 2024 |
|
(Level 1) |
|
(Level 2) |
|
(Level 3) |
|
Losses |
|||||
Corporate Borrowings: |
|||||||||||||||
Exchangeable Notes |
$ |
|
$ |
— |
$ |
|
$ |
— |
$ |
— |
|||||
Valuation Technique. The bond component of the Exchangeable Notes issued on July 22, 2024 was recorded at fair value. The Company estimated the fair value using a discounted cash flow analysis utilizing a discount yield based on the risk-free rate plus an assumed credit spread built using observable recovery rates of similarly secured debt. See Note 8—Corporate Borrowings and Finance Lease Liabilities for further information.
125
Other Fair Value Measurement Disclosures. The following tables summarize the fair value of financial instruments that are not recognized at fair value in the statement of financial position for which it is practicable to estimate that value:
|
Fair Value Measurements at December 31, 2024 Using |
|||||||||||
|
|
Significant other |
|
Significant |
||||||||
Total Carrying |
Quoted prices in |
observable |
unobservable |
|||||||||
Value at |
active market |
inputs |
inputs |
|||||||||
(In millions) |
December 31, 2024 |
(Level 1) |
(Level 2) |
(Level 3) |
||||||||
Current maturities of corporate borrowings |
$ |
|
$ |
— |
$ |
|
$ |
— |
||||
Corporate borrowings |
|
|
|
— |
|
|
— |
|||||
|
Fair Value Measurements at December 31, 2023 Using |
|||||||||||
|
|
Significant other |
|
Significant |
||||||||
Total Carrying |
Quoted prices in |
observable |
unobservable |
|||||||||
Value at |
active market |
inputs |
inputs |
|||||||||
(In millions) |
December 31, 2023 |
(Level 1) |
(Level 2) |
(Level 3) |
||||||||
Current maturities of corporate borrowings |
$ |
|
$ |
— |
$ |
|
$ |
— |
||||
Corporate borrowings |
|
|
|
— |
|
|
|
— |
||||
Valuation Technique. Quoted market prices and observable market-based inputs were used to estimate fair value for Level 2 inputs. The Company valued these notes at principal value less an estimated discount reflecting a market yield to maturity. See Note 8—Corporate Borrowings and Finance Lease Liabilities for further information.
The carrying amounts of cash and cash equivalents, accounts receivable, accounts payable, and accrued liabilities approximate fair value because of the short maturity of these instruments.
NOTE 13—SEGMENT REPORTING
The Company reports information about operating segments in accordance with ASC 280-10, Segment Reporting, which requires financial information to be reported based on the way management organizes segments within a company for making operating decisions and evaluating performance. Management has organized the Company around differences in geographic areas. The Company has identified
Each segment’s revenue is derived from admissions, food and beverage sales and other ancillary revenues, primarily screen advertising, loyalty membership fees, ticket sales, gift card income and exchange ticket income. The measure of segment profit and loss the Company’s chief operating decision maker (“CODM”) uses to evaluate performance and allocate its resources is Adjusted EBITDA, as defined in the reconciliation table below. During the year ended December 31, 2024, the Company changed the definition of Adjusted EBITDA to no longer further adjust for “cash distributions from non-consolidated entities” and “other non-cash rent benefit.” All comparative period information for Adjusted EBITDA has been re-cast to conform with the current definition.
The Company’s CODM is the chief executive officer. The Company does not report asset information by segment because that information is not used to evaluate the performance of or allocate resources between segments. The CODM assess segment performance quarterly by comparing segment annual Adjusted EBITDA against budgeted and/or forecasted Adjusted EBITDA.
The CODM uses Adjusted EBITDA for each segment to determine how to allocate resources for future capital expenditures and for general corporate purposes. The Company defines Adjusted EBITDA as net earnings (loss) plus (i) income tax provision (benefit), (ii) interest expense and (iii) depreciation and amortization, as further adjusted to eliminate the impact of certain items that the Company does not consider indicative of the Company’s ongoing operating performance and to include attributable EBITDA from equity investments in theatre operations in International markets.
126
The following tables below provide reconciliation of segment revenues to Adjusted EBITDA:
Year Ended |
|||||||||
December 31, 2024 |
|||||||||
(In millions) |
U.S. Markets |
International Markets |
Consolidated |
||||||
Revenues (1) |
$ |
|
$ |
|
$ |
|
|||
Less: |
|||||||||
Film exhibition costs |
|
|
|
||||||
Food and beverage costs |
|
|
|
|
|
|
|||
Operating expense, excluding depreciation and amortization (2) |
|
|
|
|
|
|
|
||
Rent |
|
|
|
|
|
||||
General and administrative expense - other, excluding depreciation and amortization (3) |
|
|
|
|
|||||
Other segment items (4) |
|
( |
( |
( |
|||||
Adjusted EBITDA |
$ |
|
$ |
|
$ |
|
|||
Year Ended |
|||||||||
December 31, 2023 |
|||||||||
(In millions) |
U.S. Markets |
International Markets |
Consolidated |
||||||
Revenues (1) |
$ |
|
$ |
|
$ |
|
|||
Less: |
|||||||||
Film exhibition costs |
|
|
|
||||||
Food and beverage costs |
|
|
|
|
|
|
|||
Operating expense, excluding depreciation and amortization (2) |
|
|
|
|
|
|
|||
Rent |
|
|
|
|
|||||
General and administrative expense - other, excluding depreciation and amortization (3) |
|
|
|
|
|||||
Other segment items (4) |
|
( |
|
( |
|
( |
|||
Adjusted EBITDA |
$ |
|
$ |
|
$ |
|
|||
Year Ended |
|||||||||
December 31, 2022 |
|||||||||
(In millions) |
U.S. Markets |
International Markets |
Consolidated |
||||||
Revenues (1) |
$ |
|
$ |
|
$ |
|
|||
Less: |
|||||||||
Film exhibition costs |
|
|
|
||||||
Food and beverage costs |
|
|
|
|
|
|
|||
Operating expense, excluding depreciation and amortization (2) |
|
|
|
|
|
|
|||
Rent |
|
|
|
|
|||||
General and administrative expense - other, excluding depreciation and amortization (3) |
|
|
|
|
|||||
Other segment items (4) |
|
( |
|
( |
|
( |
|||
Adjusted EBITDA |
$ |
|
$ |
( |
$ |
|
|||
| (1) | All segment revenues are comprised of revenues from external customers. |
| (2) | Operating expense, excluding depreciation and amortization excludes certain operating expenses as further defined in the reconciliation of net loss to Adjusted EBITDA below. |
| (3) | General and administrative expense – other, excluding depreciation and amortization excludes stock compensation expense. |
| (4) | Other segment items include government assistance, business interruption insurance recoveries, net periodic pension cost (benefit), and attributable EBITDA from international theatre joint ventures. |
127
Other segment disclosures:
Year Ended |
|||||||||
December 31, 2024 |
|||||||||
(In millions) |
U.S. Markets |
International Markets |
Consolidated |
||||||
Depreciation and amortization |
$ |
|
$ |
|
$ |
|
|||
Income tax provision (benefit) |
— |
|
|
||||||
Other income |
( |
( |
( |
||||||
Other significant noncash items: |
|||||||||
Stock-based compensation expense |
|
|
|
||||||
Impairment of long-lived assets |
|
|
|
||||||
Equity in earnings of non-consolidated entities |
( |
( |
( |
||||||
Capital expenditures |
|
|
|
||||||
Year Ended |
|||||||||
December 31, 2023 |
|||||||||
(In millions) |
U.S. Markets |
International Markets |
Consolidated |
||||||
Depreciation and amortization |
$ |
|
$ |
|
$ |
|
|||
Income tax provision |
|
|
|
||||||
Other income |
( |
( |
( |
||||||
Other significant noncash items: |
|||||||||
Stock-based compensation expense |
|
|
|
||||||
Impairment of long-lived assets |
|
|
|
||||||
Equity in earnings of non-consolidated entities |
( |
( |
( |
||||||
Capital expenditures |
|
|
|
||||||
Year Ended |
|||||||||
December 31, 2022 |
|||||||||
(In millions) |
U.S. Markets |
International Markets |
Consolidated |
||||||
Depreciation and amortization |
$ |
|
$ |
|
$ |
|
|||
Income tax provision |
|
|
|
||||||
Other expense |
|
|
|
||||||
Other significant noncash items: |
|||||||||
Stock-based compensation expense |
|
|
|
||||||
Impairment of long-lived assets |
|
|
|
||||||
Equity in (earnings) loss of non-consolidated entities |
( |
|
|
||||||
Capital expenditures |
|
|
|
||||||
128
The following table sets forth a reconciliation of net loss to Adjusted EBITDA:
Year Ended |
|||||||||
(In millions) |
December 31, 2024 |
|
December 31, 2023 |
December 31, 2022 |
|||||
Net loss |
$ |
( |
$ |
( |
$ |
( |
|||
Plus: |
|||||||||
Income tax provision (1) |
|
|
|
|
|
||||
Interest expense |
|
|
|
|
|
||||
Depreciation and amortization |
|
|
|
|
|
||||
Impairment of long-lived assets (2) |
|
|
|
|
|
||||
Certain operating expense (3) |
|
|
|
|
|
||||
Equity in (earnings) loss of non-consolidated entities (4) |
|
( |
|
( |
|
||||
Attributable EBITDA (5) |
|
|
|
||||||
Investment expense (income) (6) |
|
( |
|
( |
|
||||
Other expense (income) (7) |
|
( |
|
( |
|
||||
Merger, acquisition and other costs (8) |
|
|
|
|
|
||||
Stock-based compensation expense (9) |
|
|
|
|
|
||||
Adjusted EBITDA |
$ |
|
$ |
|
$ |
|
|||
| (1) | For information regarding the income tax provision (benefit), see Note 10—Income Taxes. |
| (2) |
During the year ended December 31, 2024, the Company recorded non-cash impairment charges related to its long-lived assets of $ |
During the year ended December 31, 2023, the Company recorded non-cash impairment charges related to its long-lived assets of $
During the year ended December 31, 2022, the Company recorded non-cash impairment charges related to its long-lived assets of $
| (3) | Amounts represent preopening expense related to temporarily closed screens under renovation, theatre and other closure expense for the permanent closure of screens, including the related accretion of interest, disposition of assets, and other non-operating gains or losses included in operating expenses. The Company has excluded these items as they are non-cash in nature or are non-operating in nature. |
| (4) |
Equity in (earnings) loss of non-consolidated entities primarily consisted of equity in (earnings) from AC JV of $( |
| (5) | Attributable EBITDA includes the EBITDA from equity investments in theatre operators in certain International markets. See below for a reconciliation of the Company’s equity in (earnings) loss of non-consolidated entities to attributable EBITDA. Because these equity investments are in theatre operators in regions where the Company holds a significant market share, the Company believes attributable EBITDA is more indicative of the performance of these equity investments and management uses this measure to |
129
| monitor and evaluate these equity investments. The Company also provides services to these theatre operators including information technology systems, certain on-screen advertising services and the Company’s gift card and package ticket program. |
Year Ended |
|||||||||
(In millions) |
December 31, 2024 |
|
December 31, 2023 |
December 31, 2022 |
|||||
Equity in (earnings) loss of non-consolidated entities |
$ |
( |
$ |
( |
$ |
|
|||
Less: |
|||||||||
Equity in (earnings) of non-consolidated entities excluding International theatre joint ventures |
( |
( |
( |
||||||
Equity in earnings (loss) of International theatre joint ventures |
|
|
( |
||||||
Income tax provision |
— |
|
|
||||||
Investment expense (income) |
( |
( |
|
||||||
Interest expense |
|
|
|
||||||
Impairment of long-lived assets |
— |
— |
|
||||||
Depreciation and amortization |
|
|
|
||||||
Attributable EBITDA |
$ |
|
$ |
|
$ |
|
|||
| (6) |
Investment expense (income) during the year ended December 31, 2024 includes interest income of $( |
Investment expense (income) during the year ended December 31, 2023 included a $(
Investment expense (income) during the year ended December 31, 2022 included a decline in estimated fair value of investment in common shares of Hycroft of $
| (7) |
Other expense (income) during the year ended December 31, 2024 primarily consists of a decrease in fair value of the derivative liability for the embedded conversion feature in the Exchangeable Notes of $( |
Other expense (income) for the year ended December 31, 2023 primarily consisted of gains on debt extinguishment of $(
Other expense (income) for the year ended December 31, 2022 primarily consisted of a loss on debt extinguishment of $
| (8) | Merger, acquisition and other costs are excluded as they are non-operating in nature. |
| (9) | Non-cash or non-recurring expense included in general and administrative: other. |
130
Financial information about geographic area is as follows:
Year Ended |
|||||||||
Revenues (In millions) |
December 31, 2024 |
December 31, 2023 |
December 31, 2022 |
||||||
United States |
$ |
|
$ |
|
$ |
|
|||
United Kingdom |
|
|
|
||||||
Spain |
|
|
|
||||||
Sweden |
|
|
|
||||||
Italy |
|
|
|
||||||
Germany |
|
|
|
||||||
Finland |
|
|
|
||||||
Ireland |
|
|
|
||||||
Other foreign countries |
|
|
|
||||||
Total revenues |
$ |
|
$ |
|
$ |
|
|||
As of |
As of |
|||||
Long-term assets, net (In millions) |
December 31, 2024 |
December 31, 2023 |
||||
United States |
$ |
|
$ |
|
||
International |
|
|
||||
Total long-term assets (1) |
$ |
|
$ |
|
||
| (1) | Long-term assets are comprised of property, operating lease right-of-use assets, intangible assets, goodwill, deferred tax assets, net and other long-term assets. |
NOTE 14—ACCUMULATED OTHER COMPREHENSIVE LOSS
The following table presents the change in accumulated other comprehensive loss by component:
Foreign |
|||||||||
(In millions) |
|
Currency |
|
Pension Benefits |
|
Total |
|||
Balance December 31, 2022 |
$ |
( |
$ |
|
$ |
( |
|||
Other comprehensive income (loss) |
|
( |
( |
||||||
Balance December 31, 2023 |
$ |
( |
$ |
( |
$ |
( |
|||
Other comprehensive income (loss) |
( |
|
( |
||||||
Balance December 31, 2024 |
$ |
( |
$ |
|
$ |
( |
|||
The tax effects allocated to each component of other comprehensive income (loss) is as follows:
Year Ended |
|||||||||||||||||||||||||||
December 31, 2024 |
December 31, 2023 |
December 31, 2022 |
|||||||||||||||||||||||||
|
|
Tax |
|
|
|
Tax |
|
|
|
Tax |
|
||||||||||||||||
Pre-Tax |
(Expense) |
Net-of-Tax |
Pre-Tax |
(Expense) |
Net-of-Tax |
Pre-Tax |
(Expense) |
Net-of-Tax |
|||||||||||||||||||
(In millions) |
Amount |
Benefit |
Amount |
Amount |
Benefit |
Amount |
Amount |
Benefit |
Amount |
||||||||||||||||||
Unrealized foreign currency translation adjustment |
$ |
( |
$ |
( |
$ |
( |
$ |
|
$ |
|
$ |
|
$ |
( |
$ |
— |
$ |
( |
|||||||||
Pension and other benefit adjustments: |
|||||||||||||||||||||||||||
Net gain (loss) arising during the period, net of tax |
|
— |
|
( |
— |
( |
|
— |
|
||||||||||||||||||
Other comprehensive income (loss) |
$ |
( |
$ |
( |
$ |
( |
$ |
( |
$ |
|
$ |
( |
$ |
( |
$ |
— |
$ |
( |
|||||||||
131
NOTE 15—LOSS PER SHARE
On August 24, 2023, the Company effectuated a reverse stock split at a ratio of share of Common Stock for every ten shares of Common Stock. As a result of the reverse stock split, each share of Series A Convertible Participating Preferred Stock became convertible into ten shares of Common Stock, and by extension each AMC Preferred Equity Unit became equivalent to -tenth (1/10th) of a share of Common Stock. The reverse stock split did not impact the number of AMC Preferred Equity Units outstanding. The Company concluded that this change in conversion ratio is analogous to a reverse stock split of the AMC Preferred Equity Units even though the reverse stock split did not have an effect on the number of AMC Preferred Equity Units outstanding.
Accordingly, all references made to share, per share, unit, per unit, or common share amounts in the accompanying financial statements and applicable disclosures for periods prior to August 24, 2023, have been retroactively adjusted to reflect the effect of the reverse stock split. References made to AMC Preferred Equity Units have been retroactively adjusted to reflect the effect of the reverse stock split on their equivalent Common Stock shares.
Basic loss per share is computed by dividing net loss by the weighted-average number of common shares outstanding. Diluted loss per share includes the effects of unvested RSUs with a service condition only, unvested contingently issuable PSUs that have service and performance conditions, and shares issuable upon conversion of the Exchangeable Notes, if dilutive. Diluted earnings per share is computed using the treasury stock method for the RSUs and PSUs and the if-converted method for the Exchangeable Notes.
The following table sets forth the computation of basic and diluted loss per common share:
Year Ended |
Year Ended |
Year Ended |
|||||||
(In millions) |
|
December 31, 2024 |
|
December 31, 2023 |
|
December 31, 2022 |
|||
Numerator: |
|||||||||
Net loss for basic and diluted loss per share |
$ |
( |
$ |
( |
$ |
( |
|||
Denominator (shares in thousands): |
|||||||||
Weighted average shares for basic and diluted loss per common share |
|
|
|
|
|
|
|||
Basic and diluted loss per common share |
$ |
( |
$ |
( |
$ |
( |
|||
Vested RSUs and PSUs have dividend rights identical to the Company’s Common Stock and are treated as outstanding shares for purposes of computing basic and diluted loss per share.
For the year ended December 31, 2024, December 31, 2023, and December 31, 2022, unvested RSUs of
All Tranche Year PSUs which had been attained at December 31, 2024, December 31, 2023, and December 31, 2022 were included in basic loss per share for each respective period because the issuance of the related shares were contingent only upon the passage of time. Therefore, no granted Tranche Year PSUs at December 31, 2024, December 31, 2023, and December 31, 2022 could further dilute basic loss per share.
The Company has excluded approximately
132
NOTE 16—SUBSEQUENT EVENTS
Share Issuances. In January 2025, the Company was paid $
133
Item 9. Changes in and Disagreements With Accountants on Accounting and Financial Disclosure.
Not applicable
Item 9A. Controls and Procedures.
| (a) | Evaluation of disclosure controls and procedures. |
The Company maintains a set of disclosure controls and procedures designed to ensure that material information required to be disclosed in its filings under the Securities Exchange Act of 1934 is recorded, processed, summarized and reported within the time periods specified in the Securities and Exchange Commission’s rules and forms and that material information is accumulated and communicated to the Company’s management, including its Chief Executive Officer and Chief Financial Officer, as appropriate, to allow timely decisions regarding required disclosure. The Company’s Chief Executive Officer and Chief Financial Officer have evaluated these disclosure controls and procedures as of the end of the period covered by this Annual Report on Form 10-K and have determined that such disclosure controls and procedures were effective.
| (b) | Management’s annual report on internal control over financial reporting. |
Management is responsible for establishing and maintaining adequate internal control over financial reporting for the Company as defined in Rule 13a-15(f) of the Exchange Act. With management’s participation, an evaluation of the effectiveness of internal control over financial reporting was conducted as of December 31, 2024, based on the framework and criteria established in Internal Control—Integrated Framework (2013) issued by the Committee of Sponsoring Organizations of the Treadway Commission. Based on this evaluation, management has concluded that the Company’s internal control over financial reporting was effective as of December 31, 2024. The effectiveness of our internal control over financial reporting has been audited by Ernst & Young LLP, an independent registered public accounting firm, as stated in their attestation report in Item 8 of Part II of this Annual Report on Form 10-K.
| (c) | Changes in internal control over financial reporting. |
There were no changes in its internal control over financial reporting as defined in Exchange Act Rule 13a-15(f) during the quarter ended December 31, 2024, that materially affected, or are reasonably likely to materially affect, the Company’s internal control over financial reporting.
Item 9B. Other Information.
Trading Arrangements
In the fourth quarter of 2024, no director or officer (as defined in Exchange Act Rule 16a-1(f)) of AMC
Compensatory Arrangements of Certain Officers
In order to recognize the ongoing extraordinary efforts of the Company’s management team as the theatrical exhibition industry continues to lag its pre-pandemic performance, encourage continued engagement, and incentivize executives during continued difficult business conditions, on February 19, 2025, the Compensation Committee of the Company’s Board of Directors (the “Committee”), in consultation with the Company’s independent compensation consultant, approved modification of the performance goals for the fiscal year ended December 31, 2024, applicable to certain PSUs granted under the 2013 and 2024 Equity Incentive Plans (collectively, the “EIP”) to certain officers, including the named executive officers (“NEOs”) and certified achievement measured against such modified performance goals.
As described in the Company’s definitive proxy statement on Schedule 14A in connection with its 2024 Annual Meeting of Stockholders, filed on April 24, 2024, each year the Committee approves annual grants under the EIP, half of which are designated as PSUs. The PSUs are divided into three equal Tranche Years. Each tranche is eligible to vest based upon attainment of certain financial performance goals during its applicable Tranche Year. The performance goals
134
are established at the beginning of the applicable Tranche Year based upon the Company’s financial plan, which in turn is highly dependent upon forecasts of overall industry box office. For the 2024 Tranche Year, primarily due to changes to studio movie release schedules in response to the continuing impacts of industry strikes in the prior year which were outside the control of the Company, industry box office was lower than the forecasts upon which the performance goals were predicated. As a result, PSUs allocated to the 2024 Tranche Year with unmodified Adjusted EBITDA performance goals would have vested at only 98%. The Committee determined that it was equitable to modify the 2024 Tranche Year performance goals to reflect actual industry conditions during the 2024 Tranche Year. After modification of the performance goals, the PSUs allocated to the 2024 tranche year with adjusted EBITDA performance goals will vest at a level of 146%. Given the management team’s continued focus on maximizing results despite industry factors outside its control, the Committee felt that the modifications were justified and consistent with the goals of the Company’s executive compensation programs, namely to attract, retain, motivate and reward talented executives.
The table below reflects the incremental number of shares issuable (prior to tax withholding) to NEOs as a result of the modification of the performance goals:
NEO |
Common Stock |
Adam Aron |
78,785 |
Sean Goodman |
24,257 |
Dan Ellis |
11,949 |
Elizabeth Frank |
11,949 |
Kevin Connor |
8,530 |
As a result of the modification of the performance goals, in the first quarter of 2025 the Company estimates it will issue approximately 150,000 additional shares of Common Stock net of tax withholding, incur approximately $1.0 million of incremental stock compensation expense, and make estimated incremental cash payments of approximately $0.4 million to cover tax withholding and cash settlement to certain participants below the executive level.
Item 9C. Disclosure Regarding Foreign Jurisdictions that Prevent Inspections.
Not applicable
135
PART III
Item 10. Directors, Executive Officers and Corporate Governance.
For information with respect to the executive officers of the Company, see “Information about our Executive Officers” included as a separate item at the end of Part I, Item 1 of this Form 10-K.
All other information called for by this item is hereby incorporated herein by reference to the relevant information under the headings “Proposal 2 - Election of Directors”, “Delinquent Section 16(A) Reports”, and “Corporate Governance” in our definitive proxy statement on Schedule 14A in connection with our 2025 Annual Meeting of Stockholders, to be filed within 120 days after December 31, 2024 (the “Annual Meeting Proxy Statement”).
Item 11. Executive Compensation.
The information called for by this item is set forth under the headings “Executive Compensation” (excluding the information under the subheading “Pay versus Performance”), “Compensation Committee Report on Executive Compensation”, “Compensation Committee Interlocks and Insider Participation”, “Compensation Policies and Practices as They Relate to Risk Management”, “Director Compensation” and “Compensation Discussion and Analysis” in the Annual Meeting Proxy Statement.
Item 12. Security Ownership of Certain Beneficial Owners and Management and Related Stockholder Matters.
The information called for by this item is set forth under the headings “Security Ownership of Certain Beneficial Owners and Management and Related Stockholder Matters” and “Equity Compensation Plan Information” in the Annual Meeting Proxy Statement.
Item 13. Certain Relationships and Related Transactions, and Director Independence.
The information called for by this item is set forth under the headings “Certain Relationships and Related Transactions” and “Director Independence” in the Annual Meeting Proxy Statement.
Item 14. Principal Accountant Fees and Services.
The information called for by this item is set forth under the headings “Principal Accountant Fees and Services” and “Audit Committee Pre-Approval Policy” in the Annual Meeting Proxy Statement.
136
Part IV
Item 15. Exhibits and Financial Statement Schedules.
(a)(1)The following financial statements are included in Part II, Item 8.
|
Page |
|
Reports of Independent Registered Public Accounting Firm (PCAOB ID |
68 |
|
72 |
||
73 |
||
Consolidated Balance Sheets—December 31, 2024 and December 31, 2023 |
74 |
|
75 |
||
77 |
||
78 |
(a)(2) |
Financial Statement Schedules—All schedules have been omitted because the necessary information is included in the Notes to the Consolidated Financial Statements. |
| (b) | Exhibits |
The Company has attached or incorporated by reference herein certain exhibits as specified below.
137
Exhibit |
|
Description |
|---|---|---|
138
Exhibit |
|
Description |
|---|---|---|
139
Exhibit |
|
Description |
|---|---|---|
140
Exhibit |
|
Description |
|---|---|---|
141
Exhibit |
|
Description |
|---|---|---|
142
Exhibit |
|
Description |
|---|---|---|
143
Exhibit |
|
Description |
|---|---|---|
AMC Entertainment Holdings, Inc. Insider Trading Policy, revised as of February 23, 2023. |
||
Consent of Ernst & Young LLP, Independent Registered Public Accounting Firm. |
||
Certification of Chief Executive Officer pursuant to Section 302 of the Sarbanes-Oxley Acts of 2002. |
||
Certification of Chief Financial Officer pursuant to Section 302 of the Sarbanes-Oxley Acts of 2002. |
||
**101.INS |
Inline XBRL Instance Document |
|
**101.SCH |
Inline XBRL Taxonomy Extension Schema Document |
|
**101.CAL |
Inline XBRL Taxonomy Extension Calculation Linkbase Document |
|
**101.DEF |
Inline XBRL Taxonomy Extension Definition Linkbase Document |
|
**101.LAB |
Inline XBRL Taxonomy Extension Label Linkbase Document |
|
**101.PRE |
Inline XBRL Taxonomy Extension Presentation Linkbase Document |
|
**104 |
Cover Page Interactive Data File (formatted as inline XBRL and contained in Exhibit 101). |
* Filed herewith.
** Submitted electronically with this Report.
*** Management contract, compensatory plan or arrangement.
144
SIGNATURES
Pursuant to the requirements of Section 13 or 15(d) of the Securities Exchange Act of 1934, the registrant has duly caused this report to be signed on its behalf by the undersigned, thereunto duly authorized.
AMC ENTERTAINMENT HOLDINGS, INC. |
||
By: |
/s/ Chris A. Cox |
|
Chris A. Cox |
||
Senior Vice President and Chief Accounting Officer |
||
Date: February 25, 2025 |
||
Pursuant to the requirements of the Securities Exchange Act of 1934, this report has been signed below by the following persons on behalf of the registrant and in the capacities and on the dates indicated.
/s/ ADAM M. ARON |
Chairman of the Board, Chief Executive Officer and President |
|
Adam M. Aron |
(principal executive officer) |
|
February 25, 2025 |
||
/s/ ANTHONY J. SAICH |
||
Anthony J. Saich |
Director |
|
February 25, 2025 |
||
/s/ DENISE CLARK |
||
Denise Clark |
Director |
|
February 25, 2025 |
||
/s/ KATHLEEN M. PAWLUS |
||
Kathleen M. Pawlus |
Director |
|
February 25, 2025 |
||
/s/ HOWARD KOCH, JR. |
||
Howard Koch, Jr. |
Director |
|
February 25, 2025 |
||
/s/ PHILIP LADER |
||
Philip Lader |
Director |
|
February 25, 2025 |
||
/s/ ADAM J. SUSSMAN |
||
Adam J. Sussman |
Director |
|
February 25, 2025 |
||
/s/ GARY F. LOCKE |
||
Gary F. Locke |
Director |
|
February 25, 2025 |
||
/s/ KERI PUTNAM |
||
Keri Putnam |
Director |
|
February 25, 2025 |
||
/s/ MARCUS GLOVER |
||
Marcus Glover |
Director |
|
February 25, 2025 |
||
/s/ SONIA JAIN |
||
Sonia Jain |
Director |
|
February 25, 2025 |
||
/s/ SEAN D. GOODMAN |
Executive Vice President, International Operations |
|
Sean D. Goodman |
Chief Financial Officer and Treasurer (principal financial officer) |
|
February 25, 2025 |
146
/s/ CHRIS A. COX |
Senior Vice President and Chief Accounting |
|
Chris A. Cox |
Officer (principal accounting officer) |
|
February 25, 2025 |
147