8-K: Current report filing
Published on April 24, 2019
Exhibit 99.1
|
Lease Accounting April 24, 2019 |

|
Disclaimer AMC’s consolidated financial statements are prepared and presented in accordance with generally accepted accounting principles ("GAAP"). Certain items contained in this presentation, including Adjusted EBITDA, Adjusted EBITDAR, Net Debt, and Adjusted Free Cash Flow, are non-GAAP financial measures and are provided as a supplement and should not be considered an alternative to any GAAP measure of our operating performance, liquidity or profitability. The presentation of these financial measures is not intended to be a substitute for or superior to any financial information prepared and presented in accordance with GAAP. While management believes such non-GAAP measures provide recipients with useful supplemental information, there are material limitations associated with the use of non-GAAP financial measures as an analytical tool, and these measures may be different from non-GAAP financial measures (even those similarly-titled) used by other companies. Such non-GAAP measures are presented here because we believe they are widely used by investors and analysts to measure performance or to value our company. Our management also uses such measures for their internal analysis. The non-GAAP financial measures included in this presentation should be reviewed in conjunction with AMC’s financial statements and related footnotes contained in documents filed with the SEC. For definitions and reconciliations of these non-GAAP financial measures to the nearest comparable GAAP measure, see the Non-GAAP Financial Information and Supplemental Pro Forma Information posted on the investor relations section of our website at www.amctheatres.com, furnished on a Form 8-K earlier today, and presented in the Appendix of this presentation. This presentation includes “forward-looking statements”. Forward-looking statements may be identified by the use of words such as “forecast,” “plan,” “estimate,” “will,” “would,” “project,” “maintain,” “intend,” “expect,” “anticipate,” “strategy,” “future,” “likely,” “may,” “should,” “believe,” “continue,” and other similar expressions that predict or indicate future events or trends or that are not statements of historical matters. These forward-looking statements are based on information available at the time the statements are made and/or management’s good faith belief as of that time with respect to future events, and are subject to risks, trends, uncertainties and other facts that could cause actual performance or results to differ materially from those expressed in or suggested by the forward-looking statements. These risks, trends, uncertainties and facts include, but are not limited to, risks related to: motion picture production and performance; AMC's lack of control over distributors of films; intense competition in the geographic areas in which AMC operates; AMC Stubs A-List not meeting anticipated revenue projections impacting projected incremental adjusted EBITDA; increased use of alternative film delivery methods or other forms of entertainment; shrinking exclusive theatrical release windows; general and international economic, political, social and financial market conditions and other risks including the effects of the exit of the United Kingdom from the European Union; risks and uncertainties relating to AMC's significant indebtedness; limitations on the availability of capital; certain covenants in the agreements that govern AMC’s indebtedness may limit its ability to take advantage of certain business opportunities; risks relating to AMC's inability to achieve the expected benefits and performance from its recent acquisitions; AMC's ability to refinance its indebtedness on favorable terms; optimizing AMC's theatre circuit through construction and the transformation of its existing theatres may be subject to delay and unanticipated costs; failures, unavailability or security breaches of AMC's information systems; risks relating to impairment losses and theatre and other closure charges; AMC's ability to utilize net operating loss carryforwards to reduce its future tax liability or valuation allowances taken with respect to deferred tax assets; review by antitrust authorities in connection with acquisition opportunities; risks relating to unexpected costs or unknown liabilities relating to recently completed acquisitions; risks relating to the incurrence of legal liability including costs associated with pending class action lawsuits; dependence on key personnel for current and future performance and our ability to attract and retain senior executives and other key personnel; poor financial results preventing AMC from deploying strategic initiatives; operating a business in unfamiliar international markets; increased costs to comply or resulting from a failure to comply with governmental regulations, including the General Data Protection Regulation (“GDPR”) and pending future domestic privacy laws and regulations; and other risks, trends, uncertainties and other facts discussed in the reports AMC has filed with the SEC. Should one or more of these risks, trends, uncertainties or facts materialize, or should underlying assumptions prove incorrect, actual results may vary materially from those indicated or anticipated by the forward-looking statements contained herein. Accordingly, you are cautioned not to place undue reliance on these forward- looking statements, which speak only as of the date they are made. Forward-looking statements should not be read as a guarantee of future performance or results, and will not necessarily be accurate indications of the times at, or by, which such performance or results will be achieved. For a detailed discussion of risks, trends and uncertainties facing AMC, see the section entitled “Risk Factors” in the documents AMC has filed with the SEC, and the risks, trends and uncertainties identified in their other public filings. AMC does not intend, and undertakes no duty, to update any information contained herein to reflect future events or circumstances, except as required by applicable law. 2 |
|
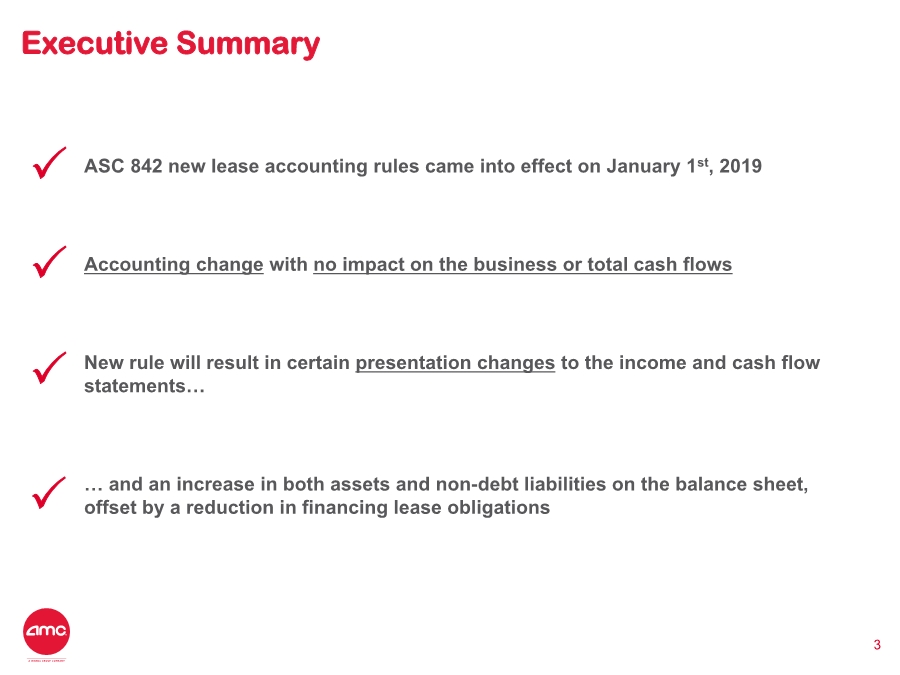
ASC 842 new lease accounting rules came into effect on January 1st, 2019 Accounting change with no impact on the business or total cash flows New rule will result in certain presentation changes to the income and cash flow statements… … and an increase in both assets and non-debt liabilities on the balance sheet, offset by a reduction in financing lease obligations Executive Summary 3 |
|
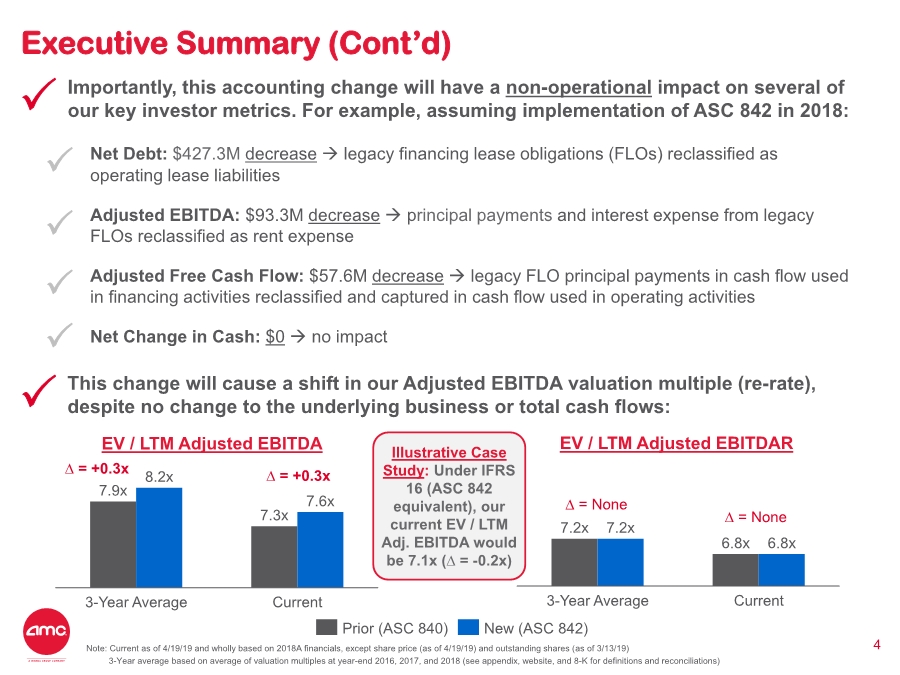
Importantly, this accounting change will have a non-operational impact on several of our key investor metrics. For example, assuming implementation of ASC 842 in 2018: Net Debt: $427.3M decrease → legacy financing lease obligations (FLOs) reclassified as operating lease liabilities Adjusted EBITDA: $93.3M decrease → principal payments and interest expense from legacy FLOs reclassified as rent expense Adjusted Free Cash Flow: $57.6M decrease → legacy FLO principal payments in cash flow used in financing activities reclassified and captured in cash flow used in operating activities Net Change in Cash: $0 → no impact Executive Summary (Cont’d) 4Note: Current as of 4/19/19 and wholly based on 2018A financials, except share price (as of 4/19/19) and outstanding shares (as of 3/13/19) 3-Year average based on average of valuation multiples at year-end 2016, 2017, and 2018 (see appendix, website, and 8-K for definitions and reconciliations) 7.9x 7.3x 8.2x 7.6x 3-Year Average Current 7.2x 6.8x 7.2x 6.8x 3-Year Average Current Prior (ASC 840) New (ASC 842) EV / LTM Adjusted EBITDA EV / LTM Adjusted EBITDAR ∆ = None ∆ = +0.3x∆ = +0.3x Illustrative Case Study: Under IFRS 16 (ASC 842 equivalent), our current EV / LTM Adj. EBITDA would be 7.1x (∆ = -0.2x) This change will cause a shift in our Adjusted EBITDA valuation multiple (re-rate), despite no change to the underlying business or total cash flows: ∆ = None |
|
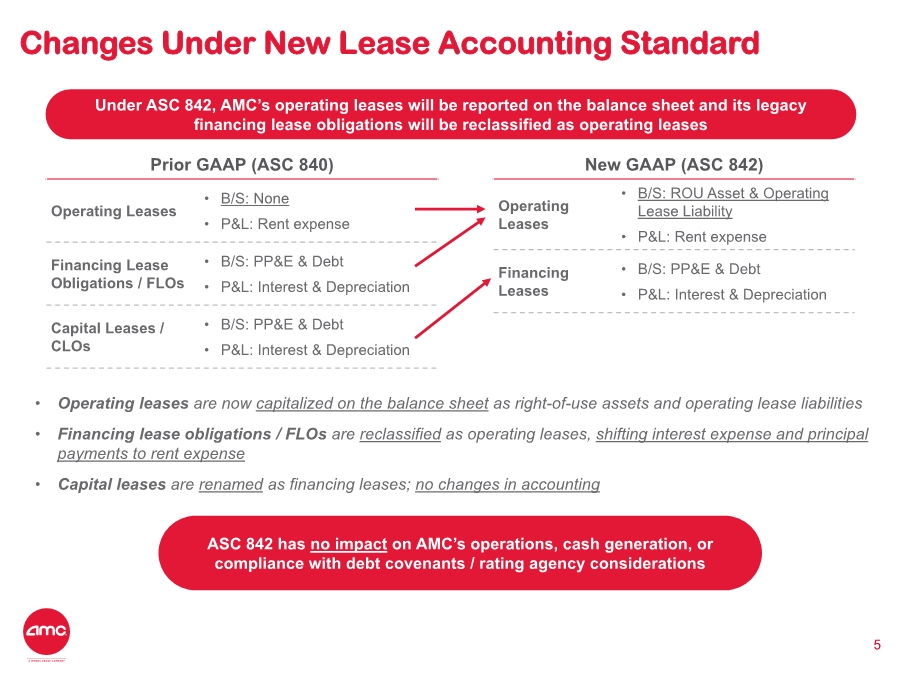
Changes Under New Lease Accounting Standard 5 Prior GAAP (ASC 840) Operating Leases • B/S: None • P&L: Rent expense Financing Lease Obligations / FLOs • B/S: PP&E & Debt • P&L: Interest & Depreciation Capital Leases / CLOs • B/S: PP&E & Debt • P&L: Interest & Depreciation New GAAP (ASC 842) Operating Leases • B/S: ROU Asset & Operating Lease Liability • P&L: Rent expense Financing Leases • B/S: PP&E & Debt • P&L: Interest & Depreciation Under ASC 842, AMC’s operating leases will be reported on the balance sheet and its legacy financing lease obligations will be reclassified as operating leases • Operating leases are now capitalized on the balance sheet as right-of-use assets and operating lease liabilities • Financing lease obligations / FLOs are reclassified as operating leases, shifting interest expense and principal payments to rent expense • Capital leases are renamed as financing leases; no changes in accounting ASC 842 has no impact on AMC’s operations, cash generation, or compliance with debt covenants / rating agency considerations |
|
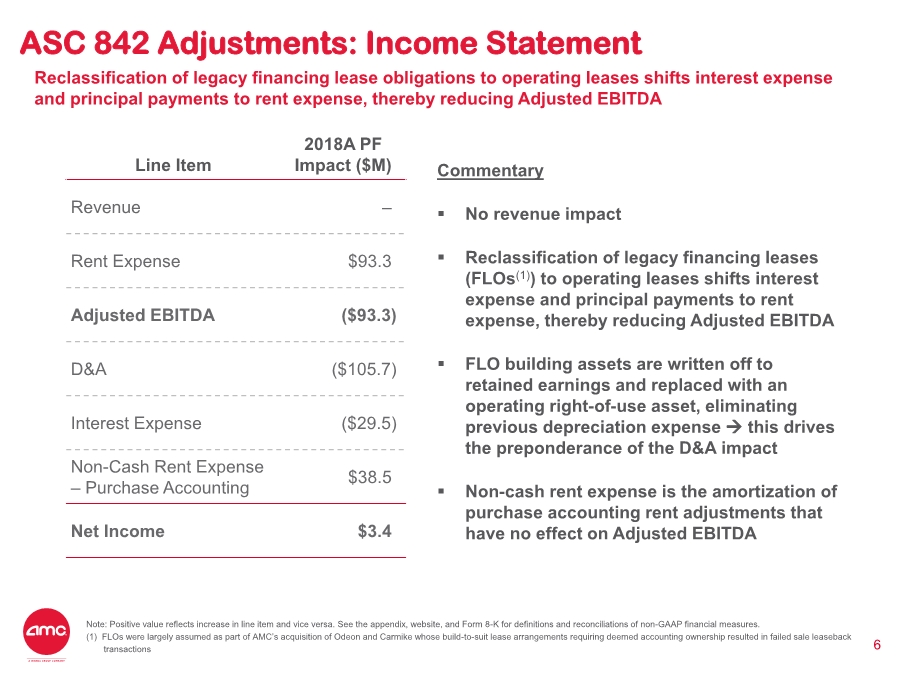
ASC 842 Adjustments: Income Statement 6 Line Item 2018A PF Impact ($M) Revenue –. Rent Expense $93.3. Adjusted EBITDA ($93.3) D&A ($105.7) Interest Expense ($29.5) Non-Cash Rent Expense – Purchase Accounting $38.5. Net Income $3.4. Commentary ▪ No revenue impact ▪ Reclassification of legacy financing leases (FLOs(1)) to operating leases shifts interest expense and principal payments to rent expense, thereby reducing Adjusted EBITDA ▪ FLO building assets are written off to retained earnings and replaced with an operating right-of-use asset, eliminating previous depreciation expense → this drives the preponderance of the D&A impact ▪ Non-cash rent expense is the amortization of purchase accounting rent adjustments that have no effect on Adjusted EBITDA Note: Positive value reflects increase in line item and vice versa. See the appendix, website, and Form 8-K for definitions and reconciliations of non-GAAP financial measures. (1) FLOs were largely assumed as part of AMC’s acquisition of Odeon and Carmike whose build-to-suit lease arrangements requiring deemed accounting ownership resulted in failed sale leaseback transactions Reclassification of legacy financing lease obligations to operating leases shifts interest expense and principal payments to rent expense, thereby reducing Adjusted EBITDA |
|
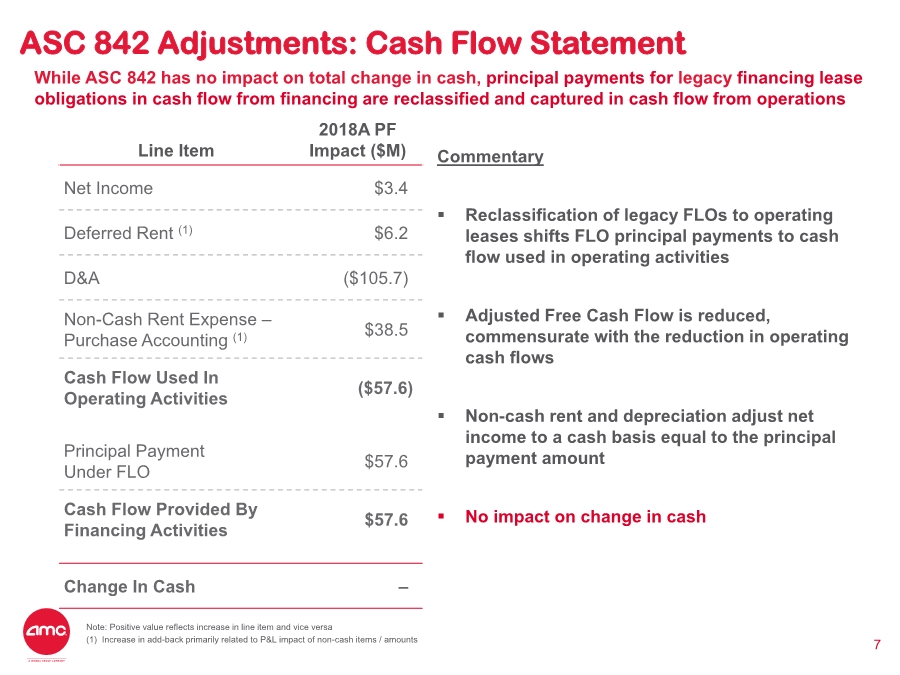
ASC 842 Adjustments: Cash Flow Statement 7 Line Item 2018A PF Impact ($M) Net Income $3.4. Deferred Rent (1) $6.2. D&A ($105.7). Non-Cash Rent Expense – Purchase Accounting (1) $38.5. Cash Flow Used In Operating Activities ($57.6) Principal Payment Under FLO $57.6. Cash Flow Provided By Financing Activities $57.6. Change In Cash –. Commentary ▪ Reclassification of legacy FLOs to operating leases shifts FLO principal payments to cash flow used in operating activities ▪ Adjusted Free Cash Flow is reduced, commensurate with the reduction in operating cash flows ▪ Non-cash rent and depreciation adjust net income to a cash basis equal to the principal payment amount ▪ No impact on change in cash Note: Positive value reflects increase in line item and vice versa (1) Increase in add-back primarily related to P&L impact of non-cash items / amounts While ASC 842 has no impact on total change in cash, principal payments for legacy financing lease obligations in cash flow from financing are reclassified and captured in cash flow from operations |
|
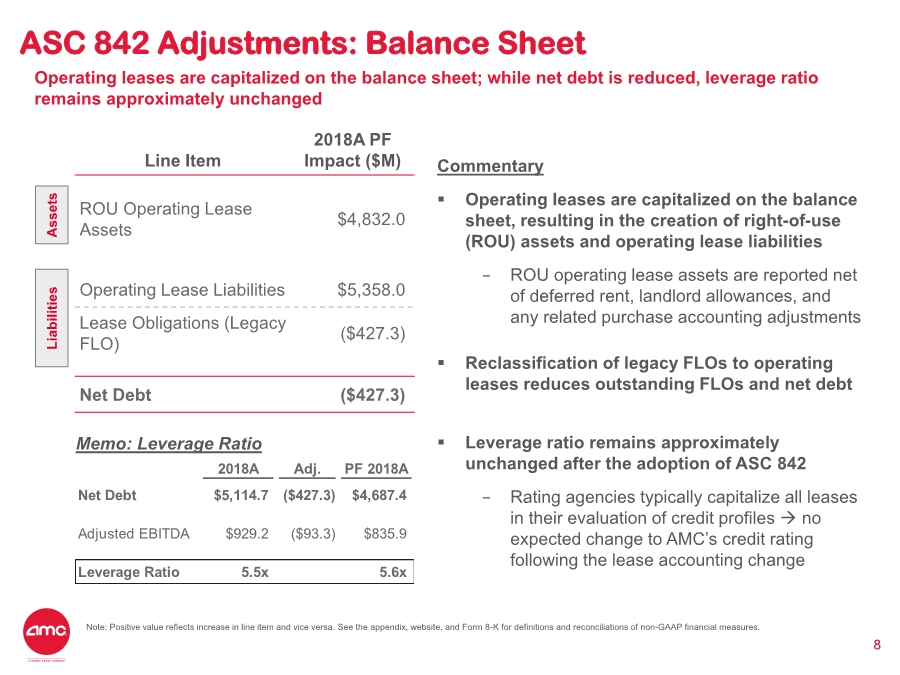
ASC 842 Adjustments: Balance Sheet 8 Line Item 2018A PF Impact ($M) ROU Operating Lease Assets $4,832.0 Operating Lease Liabilities $5,358.0 Lease Obligations (Legacy FLO) ($427.3) Net Debt ($427.3) Commentary ▪ Operating leases are capitalized on the balance sheet, resulting in the creation of right-of-use (ROU) assets and operating lease liabilities − ROU operating lease assets are reported net of deferred rent, landlord allowances, and any related purchase accounting adjustments ▪ Reclassification of legacy FLOs to operating leases reduces outstanding FLOs and net debt ▪ Leverage ratio remains approximately unchanged after the adoption of ASC 842 − Rating agencies typically capitalize all leases in their evaluation of credit profiles → no expected change to AMC’s credit rating following the lease accounting change Note: Positive value reflects increase in line item and vice versa. See the appendix, website, and Form 8-K for definitions and reconciliations of non-GAAP financial measures. Operating leases are capitalized on the balance sheet; while net debt is reduced, leverage ratio remains approximately unchanged 2018A Adj. PF 2018A Net Debt $5,114.7 ($427.3) $4,687.4 Adjusted EBITDA $929.2 ($93.3) $835.9 Leverage Ratio 5.5x 5.6x Memo: Leverage Ratio Assets Liabilities |
|
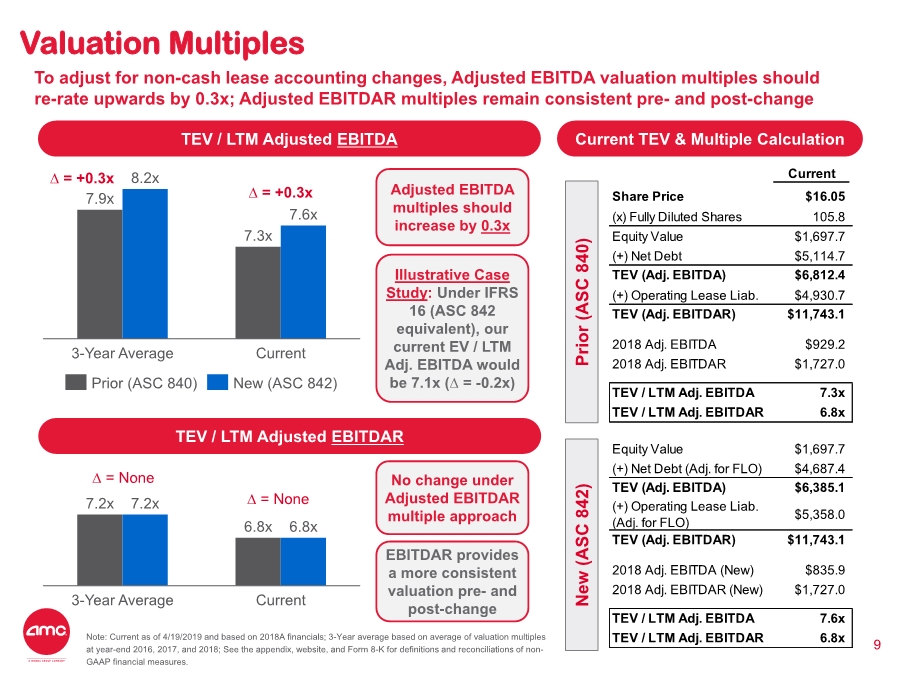
Valuation Multiples 9 TEV / LTM Adjusted EBITDA TEV / LTM Adjusted EBITDAR To adjust for non-cash lease accounting changes, Adjusted EBITDA valuation multiples should re-rate upwards by 0.3x; Adjusted EBITDAR multiples remain consistent pre- and post-change 7.9x 7.3x 8.2x 7.6x Current3-Year Average Prior (ASC 840) New (ASC 842) Note: Current as of 4/19/2019 and based on 2018A financials; 3-Year average based on average of valuation multiples at year-end 2016, 2017, and 2018; See the appendix, website, and Form 8-K for definitions and reconciliations of non- GAAP financial measures. Adjusted EBITDA multiples should increase by 0.3x 7.2x 6.8x 7.2x 6.8x 3-Year Average Current ∆ = +0.3x ∆ = +0.3x No change under Adjusted EBITDAR multiple approach Illustrative Case Study: Under IFRS 16 (ASC 842 equivalent), our current EV / LTM Adj. EBITDA would be 7.1x (∆ = -0.2x) Current TEV & Multiple Calculation Current Share Price $16.05 (x) Fully Diluted Shares 105.8 Equity Value $1,697.7 (+) Net Debt $5,114.7 TEV (Adj. EBITDA) $6,812.4 (+) Operating Lease Liab. $4,930.7 TEV (Adj. EBITDAR) $11,743.1 2018 Adj. EBITDA $929.2 2018 Adj. EBITDAR $1,727.0 TEV / LTM Adj. EBITDA 7.3x TEV / LTM Adj. EBITDAR 6.8x Equity Value $1,697.7 (+) Net Debt (Adj. for FLO) $4,687.4 TEV (Adj. EBITDA) $6,385.1 (+) Operating Lease Liab. (Adj. for FLO) $5,358.0 TEV (Adj. EBITDAR) $11,743.1 2018 Adj. EBITDA (New) $835.9 2018 Adj. EBITDAR (New) $1,727.0 TEV / LTM Adj. EBITDA 7.6x TEV / LTM Adj. EBITDAR 6.8x Prior (ASC 840) New (ASC 842) EBITDAR provides a more consistent valuation pre- and post-change ∆ = None ∆ = None |
|
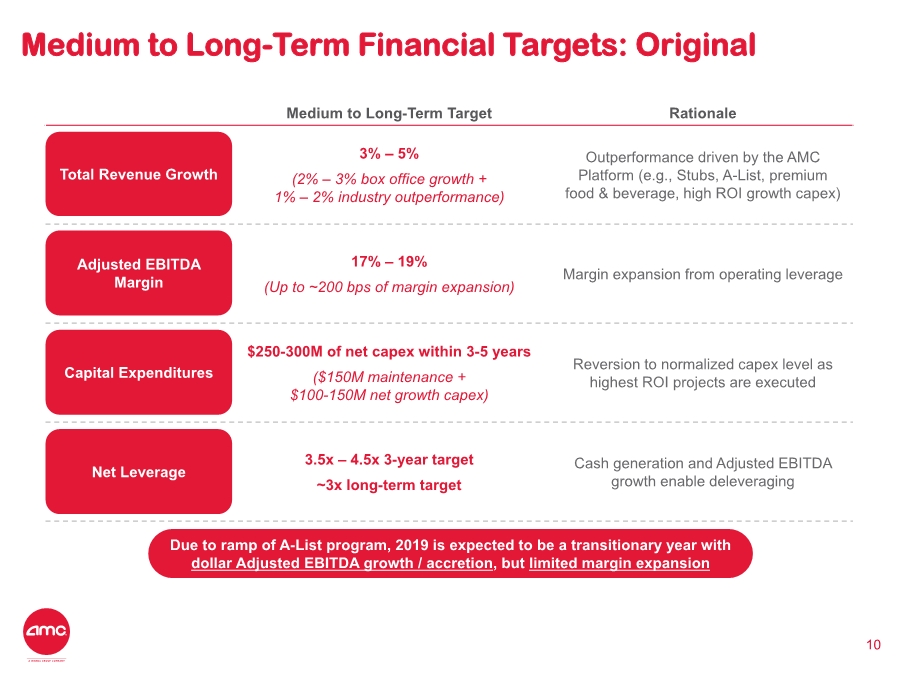
10 Medium to Long-Term Target Rationale 3% – 5% (2% – 3% box office growth + 1% – 2% industry outperformance) Outperformance driven by the AMC Platform (e.g., Stubs, A-List, premium food & beverage, high ROI growth capex) 17% – 19% (Up to ~200 bps of margin expansion) Margin expansion from operating leverage $250-300M of net capex within 3-5 years ($150M maintenance + $100-150M net growth capex) Reversion to normalized capex level as highest ROI projects are executed 3.5x – 4.5x 3-year target ~3x long-term target Cash generation and Adjusted EBITDA growth enable deleveraging Total Revenue Growth Adjusted EBITDA Margin Capital Expenditures Net Leverage Due to ramp of A-List program, 2019 is expected to be a transitionary year with dollar Adjusted EBITDA growth / accretion, but limited margin expansion Medium to Long-Term Financial Targets: Original |
|
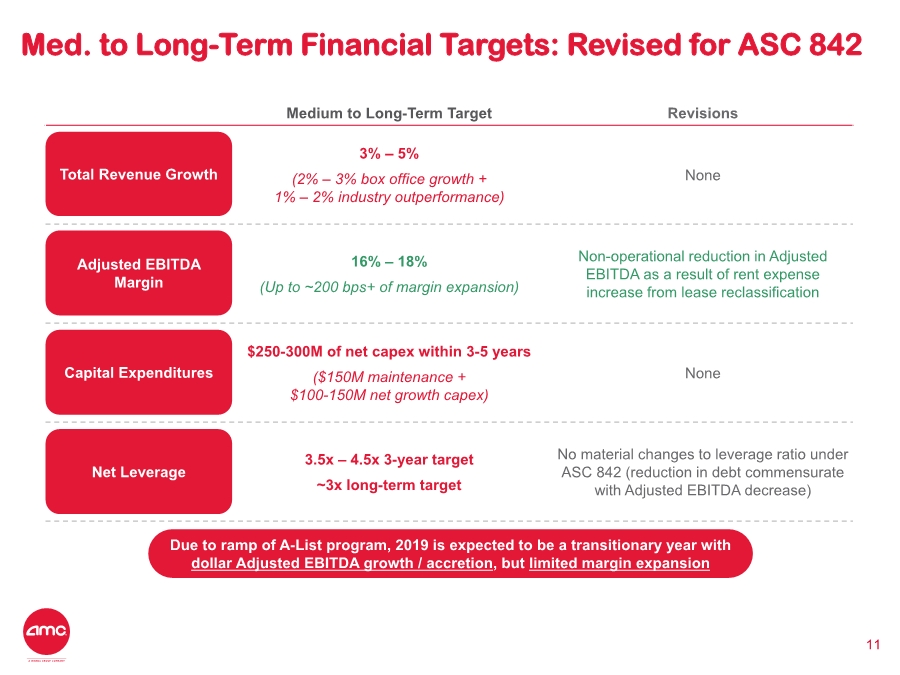
11 Medium to Long-Term Target Revisions 3% – 5% (2% – 3% box office growth + 1% – 2% industry outperformance) None 16% – 18% (Up to ~200 bps+ of margin expansion) Non-operational reduction in Adjusted EBITDA as a result of rent expense increase from lease reclassification $250-300M of net capex within 3-5 years ($150M maintenance + $100-150M net growth capex) None 3.5x – 4.5x 3-year target ~3x long-term target No material changes to leverage ratio under ASC 842 (reduction in debt commensurate with Adjusted EBITDA decrease) Total Revenue Growth Adjusted EBITDA Margin Capital Expenditures Net Leverage Due to ramp of A-List program, 2019 is expected to be a transitionary year with dollar Adjusted EBITDA growth / accretion, but limited margin expansion Med. to Long-Term Financial Targets: Revised for ASC 842 |
|
Appendix 12 |

|
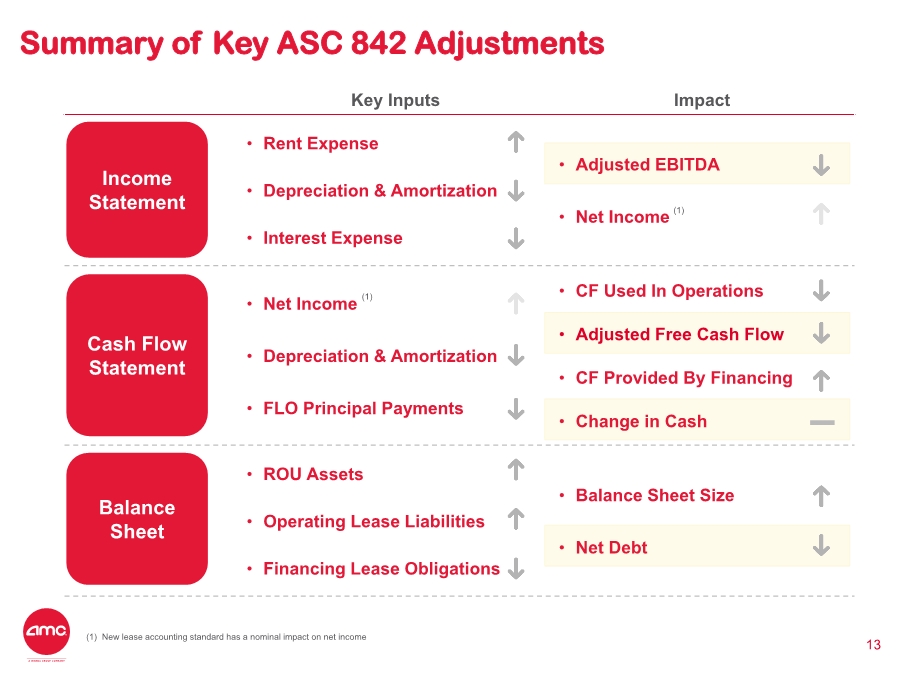
Summary of Key ASC 842 Adjustments 13 Key Inputs Impact • Rent Expense • Depreciation & Amortization • Interest Expense • Adjusted EBITDA • Net Income • Net Income • Depreciation & Amortization • FLO Principal Payments • CF Used In Operations • Adjusted Free Cash Flow • CF Provided By Financing • Change in Cash • ROU Assets • Operating Lease Liabilities • Financing Lease Obligations • Balance Sheet Size • Net Debt Income Statement Cash Flow Statement Balance Sheet (1) New lease accounting standard has a nominal impact on net income (1) (1) |
|
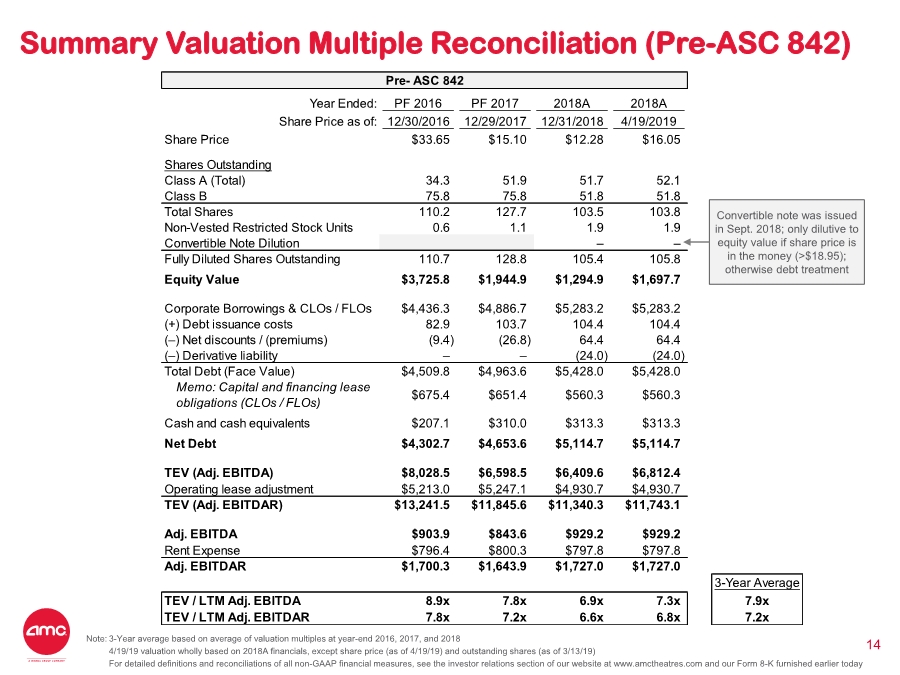
Summary Valuation Multiple Reconciliation (Pre-ASC 842) 14 Pre- ASC 842 Year Ended: PF 2016 PF 2017 2018A 2018A Share Price as of: 12/30/2016 12/29/2017 12/31/2018 4/19/2019 Share Price $33.65 $15.10 $12.28 $16.05 Shares Outstanding Class A (Total) 34.3 51.9 51.7 52.1 Class B 75.8 75.8 51.8 51.8 Total Shares 110.2 127.7 103.5 103.8 Non-Vested Restricted Stock Units 0.6 1.1 1.9 1.9 Convertible Note Dilution –– Fully Diluted Shares Outstanding 110.7 128.8 105.4 105.8 Equity Value $3,725.8 $1,944.9 $1,294.9 $1,697.7 Corporate Borrowings & CLOs / FLOs $4,436.3 $4,886.7 $5,283.2 $5,283.2 (+) Debt issuance costs 82.9 103.7 104.4 104.4 (–) Net discounts / (premiums) (9.4) (26.8) 64.4 64.4 (–) Derivative liability ––(24.0) (24.0) Total Debt (Face Value) $4,509.8 $4,963.6 $5,428.0 $5,428.0 Memo: Capital and financing lease obligations (CLOs / FLOs) $675.4 $651.4 $560.3 $560.3 Cash and cash equivalents $207.1 $310.0 $313.3 $313.3 Net Debt $4,302.7 $4,653.6 $5,114.7 $5,114.7 TEV (Adj. EBITDA) $8,028.5 $6,598.5 $6,409.6 $6,812.4 Operating lease adjustment $5,213.0 $5,247.1 $4,930.7 $4,930.7 TEV (Adj. EBITDAR) $13,241.5 $11,845.6 $11,340.3 $11,743.1 Adj. EBITDA $903.9 $843.6 $929.2 $929.2 Rent Expense $796.4 $800.3 $797.8 $797.8 Adj. EBITDAR $1,700.3 $1,643.9 $1,727.0 $1,727.0 3-Year Average TEV / LTM Adj. EBITDA 8.9x 7.8x 6.9x 7.3x 7.9x TEV / LTM Adj. EBITDAR 7.8x 7.2x 6.6x 6.8x 7.2x Convertible note was issued in Sept. 2018; only dilutive to equity value if share price is in the money (>$18.95); otherwise debt treatment Note: 3-Year average based on average of valuation multiples at year-end 2016, 2017, and 2018 4/19/19 valuation wholly based on 2018A financials, except share price (as of 4/19/19) and outstanding shares (as of 3/13/19) For detailed definitions and reconciliations of all non-GAAP financial measures, see the investor relations section of our website at www.amctheatres.com and our Form 8-K furnished earlier today |
|
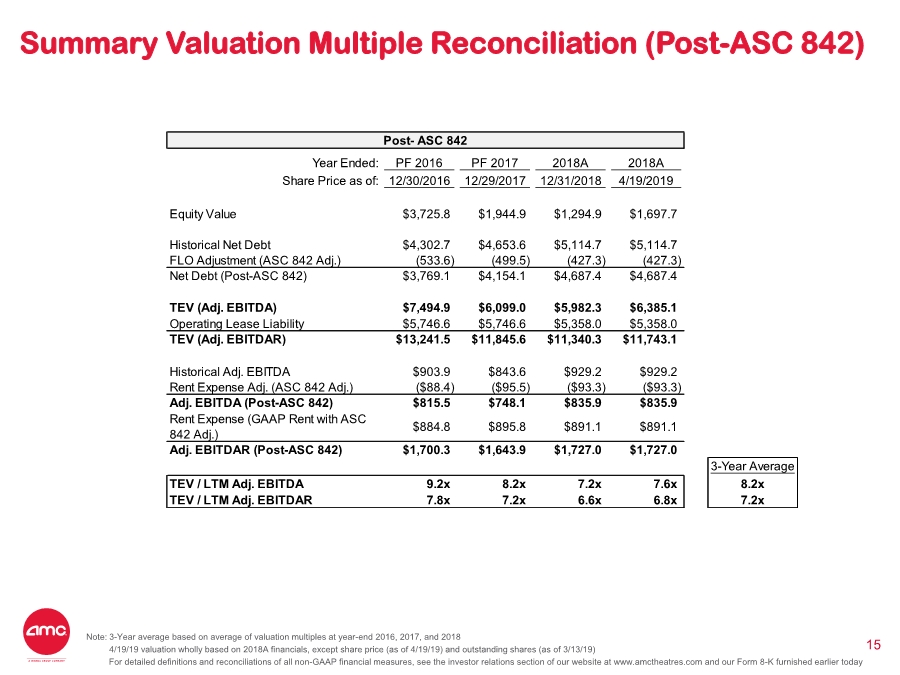
Summary Valuation Multiple Reconciliation (Post-ASC 842) 15 Post- ASC 842 Year Ended: PF 2016 PF 2017 2018A 2018A Share Price as of: 12/30/2016 12/29/2017 12/31/2018 4/19/2019 Equity Value $3,725.8 $1,944.9 $1,294.9 $1,697.7 Historical Net Debt $4,302.7 $4,653.6 $5,114.7 $5,114.7 FLO Adjustment (ASC 842 Adj.) (533.6) (499.5) (427.3) (427.3) Net Debt (Post-ASC 842) $3,769.1 $4,154.1 $4,687.4 $4,687.4 TEV (Adj. EBITDA) $7,494.9 $6,099.0 $5,982.3 $6,385.1 Operating Lease Liability $5,746.6 $5,746.6 $5,358.0 $5,358.0 TEV (Adj. EBITDAR) $13,241.5 $11,845.6 $11,340.3 $11,743.1 Historical Adj. EBITDA $903.9 $843.6 $929.2 $929.2 Rent Expense Adj. (ASC 842 Adj.) ($88.4) ($95.5) ($93.3) ($93.3) Adj. EBITDA (Post-ASC 842) $815.5 $748.1 $835.9 $835.9 Rent Expense (GAAP Rent with ASC 842 Adj.) $884.8 $895.8 $891.1 $891.1 Adj. EBITDAR (Post-ASC 842) $1,700.3 $1,643.9 $1,727.0 $1,727.0 3-Year Average TEV / LTM Adj. EBITDA 9.2x 8.2x 7.2x 7.6x 8.2x TEV / LTM Adj. EBITDAR 7.8x 7.2x 6.6x 6.8x 7.2x Note: 3-Year average based on average of valuation multiples at year-end 2016, 2017, and 2018 4/19/19 valuation wholly based on 2018A financials, except share price (as of 4/19/19) and outstanding shares (as of 3/13/19) For detailed definitions and reconciliations of all non-GAAP financial measures, see the investor relations section of our website at www.amctheatres.com and our Form 8-K furnished earlier today |
|
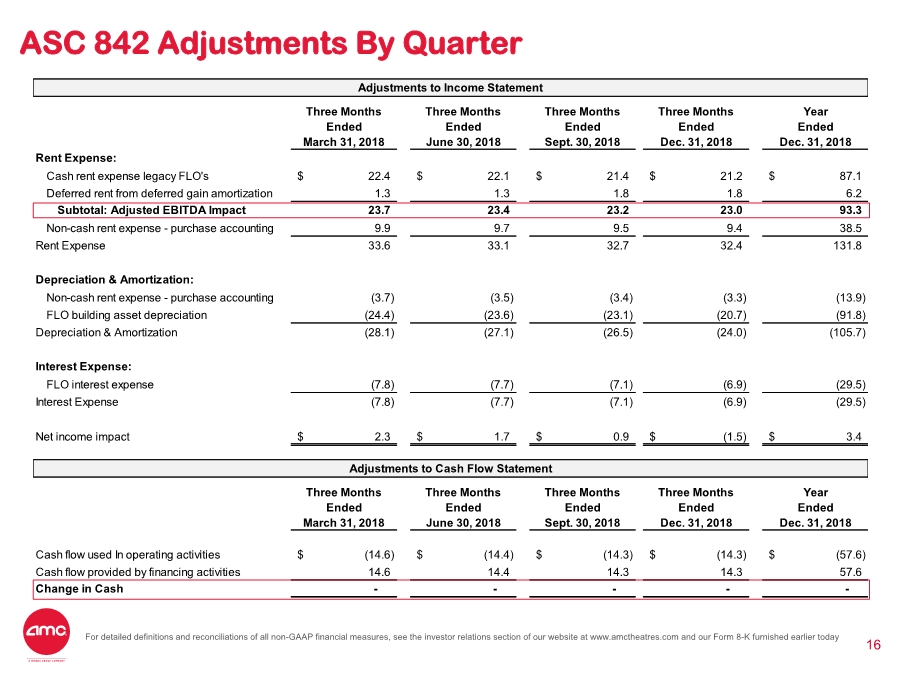
ASC 842 Adjustments By Quarter 16For detailed definitions and reconciliations of all non-GAAP financial measures, see the investor relations section of our website at www.amctheatres.com and our Form 8-K furnished earlier today Adjustments to Income Statement Three Months Three Months Three Months Three Months Year Ended Ended Ended Ended Ended March 31, 2018 June 30, 2018 Sept. 30, 2018 Dec. 31, 2018 Dec. 31, 2018 Rent Expense: Cash rent expense legacy FLO's 22.4$ 22.1$ 21.4$ 21.2$ 87.1$ Deferred rent from deferred gain amortization 1.3 1.3 1.8 1.8 6.2 Subtotal: Adjusted EBITDA Impact 23.7 23.4 23.2 23.0 93.3 Non-cash rent expense - purchase accounting 9.9 9.7 9.5 9.4 38.5 Rent Expense 33.6 33.1 32.7 32.4 131.8 Depreciation & Amortization: Non-cash rent expense - purchase accounting (3.7) (3.5) (3.4) (3.3) (13.9) FLO building asset depreciation (24.4) (23.6) (23.1) (20.7) (91.8) Depreciation & Amortization (28.1) (27.1) (26.5) (24.0) (105.7) Interest Expense: FLO interest expense (7.8) (7.7) (7.1) (6.9) (29.5) Interest Expense (7.8) (7.7) (7.1) (6.9) (29.5) Net income impact 2.3$ 1.7$ 0.9$ (1.5)$ 3.4$ Adjustments to Cash Flow Statement Three Months Three Months Three Months Three Months Year Ended Ended Ended Ended Ended March 31, 2018 June 30, 2018 Sept. 30, 2018 Dec. 31, 2018 Dec. 31, 2018 Cash flow used In operating activities (14.6)$ (14.4)$ (14.3)$ (14.3)$ (57.6)$ Cash flow provided by financing activities 14.6 14.4 14.3 14.3 57.6 Change in Cash - - - - - |