10-K: Annual report pursuant to Section 13 and 15(d)
Published on March 1, 2019
UNITED STATES
SECURITIES AND EXCHANGE COMMISSION
Washington, D.C. 20549
FORM 10-K
|
|
|
|
(Mark One) |
|
|
☒ |
ANNUAL REPORT PURSUANT TO SECTION 13 OR 15(d) OF THE SECURITIES EXCHANGE ACT OF 1934 |
|
For the fiscal year ended December 31, 2018 |
|
|
OR |
|
|
☐ |
TRANSITION REPORT PURSUANT TO SECTION 13 OR 15(d) OF THE SECURITIES EXCHANGE ACT OF 1934 |
|
For the transition period from to |
|
Commission file number 001-33892
AMC ENTERTAINMENT HOLDINGS, INC.
(Exact name of registrant as specified in its charter)
|
|
|
|
Delaware |
26-0303916 |
|
One AMC Way |
66211 |
(913) 213-2000
Registrant’s telephone number, including area code:
Securities registered pursuant to Section 12(b) of the Act:
|
|
|
|
|
Title of Each Class |
|
Name of Each Exchange on Which Registered |
|
Class A Common Stock, par value of $0.01 per share |
|
New York Stock Exchange |
Securities registered pursuant to Section 12(g) of the Act: None.
Indicate by check mark if the registrant is a well-known seasoned issuer, as defined in Rule 405 of the Securities Act. Yes ☒ No ☐
Indicate by check mark if the registrant is not required to file reports pursuant to Section 13 or Section 15(d) of the Act. Yes ☐ No ☒
Indicate by check mark whether the registrant (1) has filed all reports required to be filed by Section 13 or 15(d) of the Securities Exchange Act of 1934 during the preceding 12 months (or for such shorter period that the registrant was required to file such reports), and (2) has been subject to such filing requirements for the past 90 days. Yes ☒ No ☐
Indicate by check mark whether the registrant has submitted electronically every Interactive Data File required to be submitted pursuant to Rule 405 of Regulations S-T (§232.405 of this chapter) during the preceding 12 months (or for such shorter period that the registrant was required to submit such files). Yes ☒ No ☐
Indicate by check mark if disclosure of delinquent filers pursuant to Item 405 of Regulation S-K (§229.405 of this chapter) is not contained herein, and will not be contained, to the best of registrant’s knowledge, in definitive proxy or information statements incorporated by reference in Part III of this Form 10-K or any amendment to this Form 10-K. ☐
Indicate by check mark whether the registrant is a large accelerated filer, an accelerated filer, a non-accelerated filer, a smaller reporting company, or an emerging growth company. See definitions of “large accelerated filer,” “accelerated filer,” “smaller reporting company,” and emerging growth company in Rule 12b-2 of the Exchange Act. (Check one):
|
Large accelerated filer ☒ |
Accelerated filer ☐ |
Non-accelerated filer ☐ |
|
Smaller reporting company ☐ |
Emerging Growth Company ☐ |
If an emerging growth company, indicate by check mark if the registrant has elected not to use the extended transition period for complying with any new or revised financial accounting standards provided pursuant to Section 13(a) of the Exchange Act. ☐
Indicate by check mark whether the registrant is a shell company (as defined in Rule 12b-2 of the Act). Yes ☐ No ☒
The aggregate market value of the voting and non-voting common equity held by non-affiliates of the registrant on June 30, 2018, computed by reference to the price at which the registrant’s Class A common stock was last sold on the New York Stock Exchange on such date was $822,736,151 (51,744,412 shares at a closing price per share of $15.90).
Shares of Class A common stock outstanding—52,047,613 shares at February 22, 2019
Shares of Class B common stock outstanding—51,769,784 shares at February 22, 2019
DOCUMENTS INCORPORATED BY REFERENCE
Certain portions of the registrant’s definitive proxy statement, in connection with its 2019 annual meeting of stockholders, to be filed within 120 days of December 31, 2018, are incorporated by reference into Part III of this Annual Report on Form 10-K.
AMC ENTERTAINMENT HOLDINGS, INC.
FORM 10-K
FOR THE YEAR ENDED DECEMBER 31, 2018
1
In addition to historical information, this Annual Report on Form 10-K contains “forward-looking statements” within the meaning of the “safe harbor” provisions of the United States Private Securities Litigation Reform Act of 1995. Forward-looking statements may be identified by the use of words such as “may,” “will,” “forecast,” “estimate,” “project,” “intend,” “plan,” “expect,” “should,” “believe” and other similar expressions that predict or indicate future events or trends or that are not statements of historical matters. Similarly, certain statements made herein and elsewhere regarding our recent acquisitions are also forward-looking statements, including statements regarding the expected benefits of the acquisition on our future business, operations and financial performance and our ability to successfully integrate the recently acquired businesses. These forward-looking statements are based only on our current beliefs, expectations and assumptions regarding the future of our business, future plans and strategies, projections, anticipated events and trends, the economy and other future conditions. These forward-looking statements involve known and unknown risks, uncertainties, assumptions and other factors, including those discussed in “Risk Factors” and “Management’s Discussion and Analysis of Financial Condition and Results of Operations,” which may cause our actual results, performance or achievements to be materially different from any future results, performance or achievements expressed or implied by such forward-looking statements. These risks and uncertainties include, but are not limited to, the following:
|
· |
risks relating to motion picture production and performance; |
|
· |
our lack of control over distributors of films; |
|
· |
intense competition in the geographic areas in which we operate; |
|
· |
increased use of alternative film delivery methods or other forms of entertainment; |
|
· |
shrinking exclusive theatrical release windows; |
|
· |
general and international economic, political, social and financial market conditions and other risks including the effects of the exit of the United Kingdom from the European Union; |
|
· |
risks and uncertainties relating to our significant indebtedness; |
|
· |
limitations on the availability of capital may prevent us from deploying strategic initiatives and continue our share repurchase program; |
|
· |
certain covenants in the agreements that govern our indebtedness may limit our ability to take advantage of certain business opportunities; |
|
· |
our ability to achieve expected synergies, benefits and performance from our recent strategic theatre acquisitions and strategic initiatives; |
|
· |
our ability to refinance our indebtedness on terms favorable to us; |
|
· |
optimizing our theatre circuit through new construction and the transformation of our existing theatres may be subject to delay and unanticipated costs; |
|
· |
failures, unavailability or security breaches of our information systems; |
|
· |
risks relating to impairment losses, including with respect to goodwill and other intangibles, and theatre and other closure charges; |
|
· |
our ability to utilize net operating loss carryforwards to reduce our future tax liability or valuation allowances taken with respect to deferred tax assets; |
|
· |
review by antitrust authorities in connection with acquisition opportunities; |
2
|
· |
risks relating to unexpected costs or unknown liabilities relating to recently completed acquisitions; |
|
· |
risks relating to the incurrence of legal liability, including costs associated with recently filed securities class action lawsuits; |
|
· |
dependence on key personnel for current and future performance and our ability to attract and retain senior executives and other key personnel, including in connection with any future acquisitions; |
|
· |
risks of poor financial results may prevent us from deploying strategic initiatives; |
|
· |
operating a business in international markets AMC Entertainment Holdings, Inc. (“AMC”) is unfamiliar with, including acceptance by movie-goers of AMC initiatives that are new to those markets; |
|
· |
increased costs in order to comply or resulting from a failure to comply with governmental regulation, including the General Data Protection Regulation (“GDPR”) and pending future domestic privacy laws and regulations; and |
|
· |
we may not generate sufficient cash flows or have sufficient restricted payment capacity under our Senior Secured Credit Facility or the indentures governing our debt securities to pay our intended dividends on our Class A and Class B common stock. |
This list of factors that may affect future performance and the accuracy of forward-looking statements is illustrative but not exhaustive. In addition, new risks and uncertainties may arise from time to time. Accordingly, all forward-looking statements should be evaluated with an understanding of their inherent uncertainty.
Except as required by law, we assume no obligation to publicly update or revise these forward-looking statements for any reason. Actual results could differ materially from those anticipated in these forward-looking statements, even if new information becomes available in the future.
Readers are urged to consider these factors carefully in evaluating the forward‑looking statements. For further information about these and other risks and uncertainties as well as strategic initiatives, see Item 1A. “Risk Factors” and Item 1. “Business” in this Annual Report on Form 10‑K.
3
General Development of Business
AMC Entertainment Holdings, Inc. (“Holdings”), through its direct and indirect subsidiaries, including American Multi Cinema, Inc. and its subsidiaries, (collectively with Holdings, unless the context otherwise requires, the “Company” or “AMC”), is principally involved in the theatrical exhibition business and owns, operates or has interests in theatres primarily located in the United States and Europe. AMC is an indirect subsidiary of Dalian Wanda Group Co., Ltd. (“Wanda”), a Chinese private conglomerate.
As of December 31, 2018, Wanda owned approximately 50.01% of Holdings’ outstanding common stock and 75.01% of the combined voting power of Holdings’ outstanding common stock and has the power to control Holdings’ affairs and policies, including with respect to the election of directors (and, through the election of directors, the appointment of management), entering into of mergers, sales of substantially all of our assets and other extraordinary transactions.
Our business was founded in Kansas City, Missouri in 1920. Holdings was incorporated under the laws of the state of Delaware on June 6, 2007. We maintain our principal executive offices at One AMC Way, 11500 Ash Street, Leawood, Kansas 66211.
Recent Developments
NCM: In March 2018, we recorded an impairment charge of $16.0 million, to reduce the carrying value of our held-for-sale interests in National CineMedia, LLC (“NCM”) common units and National CineMedia, Inc. (“NCM, Inc.”) common shares to fair value based on the publicly quoted per share price as of March 31, 2018 of $5.19.
On June 18, 2018, the Company entered into two Unit Purchase Agreements (the “Agreements”) with each of Regal Cinemas, Inc. (“Regal”) and Cinemark USA, Inc. (“Cinemark”) pursuant to which Regal and Cinemark each separately agreed to purchase 10,738,740 common units of NCM at a sales price of $7.30 per unit and aggregate consideration of approximately $156.8 million (the “Sales”). The Sales closed on July 5, 2018. Following the closing of the Sales, the Company no longer owned any shares of common units of NMC or shares of NCM, Inc. NCM consented to the Sales and waived its rights under the memorandum of understanding that provided the Company would not reduce its combined ownership of NCM and NCM, Inc. below 4.5%. We recorded a gain on sale of $28.9 million during the year ended December 31, 2018.
Screenvision Merger: On May 30, 2018, SV Holdco, LLC (“Screenvision”) entered into an Agreement and Plan of Merger which resulted in a change of control in Screenvision on July 2, 2018. We received distributions and merger consideration of $45.9 million and retain a 18.4% common membership interest in Screenvision on a fully diluted basis. We reduced the carrying value of our investment in Screenvision to $0 and recorded equity in earnings for the excess distribution of $30.1 million during the year ended December 31, 2018.
Sale and Leaseback Transaction: On June 18, 2018, we completed the sale and leaseback of the real estate assets associated with one theatre for proceeds, net of closing costs, of $50.1 million. The gain on the sale of approximately $27.4 million has been deferred and will be amortized over the remaining lease term.
Fifth Amendment to Credit Agreement: On August 14, 2018, we entered into the Fifth Amendment to Credit Agreement with Citicorp North America, Inc, as administrative agent and the other lenders party thereto, amending the Credit Agreement dated as of April 30, 2013. The Fifth Amendment made changes to certain covenants and related definitions. These amendments to the Senior Secured Credit Agreement were executed in order to facilitate an internal reorganization due to recent tax changes and to make modifications which clarified certain ambiguities in the Senior Secured Credit Agreement.
Senior Unsecured Convertible Notes due 2024: On September 14, 2018, we issued $600.0 million aggregate principal amount of our 2.95% Senior Unsecured Convertible Notes due 2024. The Convertible Notes due 2024 mature on September 15, 2024, subject to earlier conversion by the holders thereof, repurchase by AMC at the option of the
4
holders or redemption by AMC upon the occurrence of certain contingencies, as discussed below. Upon maturity, the $600.0 million principal amount of the Convertible Notes due 2024 will be payable in cash. We will pay interest in cash on the Convertible Notes due 2024 at 2.95% per annum, semi-annually in arrears on September 15th and March 15th, commencing on March 15, 2019. We used the net proceeds from the sale of the Convertible Notes due 2024 to repurchase and retire 24,057,143 shares of Class B common stock held by Wanda for $17.50 per share or approximately $421.0 million, associated legal fees of $1.9 million, and to pay a special dividend of $1.55 per share of Class A common stock and Class B common stock, or approximately $160.5 million on September 28, 2018 to shareholders of record on September 25, 2018. See Management’s Discussion and Analysis of Financial Condition and Results of Operations – Significant Events and Note 8 – Corporate Borrowings and Capital and Financing Lease Obligations in the Notes to Consolidated Financial Statements under Part II, Item 8, hereof for further information on the terms of the Convertible Notes due 2024.
Special Dividend: On September 14, 2018, our Board of Directors declared a special cash dividend in the amount of $1.55 per share of Class A and Class B common stock, payable on September 28, 2018 to stockholders of record on September 25, 2018.
Narrative Description of Business
We are the world’s largest theatrical exhibition company and an industry leader in innovation and operational excellence. Over the course of our nearly 100 year history, we have pioneered many of the theatrical exhibition industry’s most important innovations. We introduced Multiplex theatres in the 1960s and the North American stadium-seated Megaplex theatre format in the 1990s. Most recently, we revolutionized movie-going with the deployment of our theatre renovations featuring plush, powered recliner seating. Our growth has been driven by a combination of organic growth through reinvestment in our existing assets and through the acquisition of some of the most respected companies in the theatrical exhibition industry.
The combination of AMC, Odeon, Carmike Cinemas, Inc. (“Carmike”) and Nordic Cinema Group Holdings AB (“Nordic”) makes us the largest theatre operator in the world with 1,006 theatres and 11,091 screens in 15 countries as of December 31, 2018. We are the #1 theatre operator in the United States; the #1 theatre operator in the United Kingdom-Ireland, Italy, Spain, Sweden, Norway, Finland, Estonia, Latvia and Lithuania; the #2 theatre operator in Portugal; and the #4 theatre operator in Germany. We have operations in four of the world’s ten largest economies, including four of the five largest European economies (the United Kingdom, Spain, Italy and Germany). Additionally, the combined company is the largest global procurer in theatrical exhibition of film, food and beverage items, lighting and theatre supplies.
As of December 31, 2018, we owned, operated or held interests in 637 theatres with a total of 8,114 screens in the United States and 369 theatres and 2,977 screens in European markets. With operations in 44 states and the District of Columbia, approximately 52% of the U.S. population lives within 10 miles of one of our theatres. We have a diversified footprint with complementary global geographic and guest demographic profiles, which we believe gives our circuit a unique profile and offers strategic and operational advantages. We operate productive theaters in the top markets in the United States and have the #1 market share in the top two markets: New York and Los Angeles. Our top five markets, in each of which we hold the #1 or #2 share position, are New York (44% share), Los Angeles (28%), Chicago (43%), San Francisco (25%) and Washington, D.C. (33%). Strategically, these markets and our theatres in them are diverse, operationally complex and, in many cases, the scarcity of new theatre opportunities creates a significant competitive advantage for established locations against newcomers or alternative entertainment options.
Our theatrical exhibition revenues are generated primarily from box office admissions and theatre food and beverage sales. We offer consumers a broad range of entertainment alternatives including traditional film programming, independent and foreign films, performing arts, music and sports. We also offer food and beverage alternatives beyond traditional concession items, including made-to-order meals, customized coffee, healthy snacks, beer, wine, premium cocktails and dine-in theatre options. The balance of our revenues is generated from ancillary sources, including on‑screen advertising, fees earned from our AMC Stubs® customer loyalty program, rental of theatre auditoriums, income from gift card and exchange ticket sales, and on‑line ticketing fees.
Approximately 359 million consumers have attended AMC, Odeon and Nordic theatre circuits, combined for the year ended December 31, 2018.
5
As a result of our ongoing focus to improve the quality of the movie-going experience, AMC theatres continue to maintain top-box customer satisfaction scores of nearly 60% and industry leading theatre productivity metrics. According to publicly available information for our most comparable peers in the U.S. market, for the year ended December 31, 2018, our U.S. markets were #1 or #2 in revenues per patron ($15.69), food and beverage per patron ($5.17), and average ticket price ($9.55). We believe that it is the quality of our theatre locations and our customer‑focused innovation that continue to drive improved productivity per location (which we measure as increases in admissions revenues per screen relative to the industry and/or food and beverage revenues per patron).
To ensure that we are an imaginative and bold innovator today and in the years ahead, we have established the following key priorities.
|
· |
Through our marketing programs we plan to strengthen the bonds with our current guests and create new connections with potential guests, to drive more attendance and increase market share. Our focus is to capture guests’ attention before they even leave their homes by paying close attention to our brands, our loyalty program and our communication with movie-goers via the internet, either directly or through social media; |
|
· |
We plan to continue investing in technical innovation that will allow us to enhance the consumer experience through premium formats such as IMAX®, Dolby Cinema™, 3D and other premium format offerings. Additionally, in recognizing the varied tastes of our guests we will continue to explore offerings of alternative content such as live concerts, sporting events, Broadway shows, opera and other non‑traditional programming to provide incremental revenue; |
|
· |
We expect to continue deployment of our proven theatre innovations while simultaneously developing new concepts and initiatives that will elevate the movie-going experience at our theatres; |
|
· |
We are committed to deploying successful new technologies that will allow us to evolve even as consumers look to other ways to watch movies; |
|
· |
We plan for our growth to be driven through our guest‑focused strategy and will continue to explore growth through profitable acquisitions. We believe that acquisitions offer us additional opportunities to introduce our proven guest focused strategies to new movie-goers and will generate meaningful benefits to guests, associates, studio partners and our shareholders; |
|
· |
Studios, film makers and other institutions of the movie industry, whether in Hollywood or abroad, are valued partners with whom we must have cooperative and productive relationships; and |
|
· |
We will continue to motivate our associates by generating pride in their employment at AMC. Because so much of our guest satisfaction is determined by the service delivery of our theatre teams, taking good care of our associates should translate in turn to their taking good care of our guests. |
We plan to continue investing in our theatres and upgrading the consumer experience to take greater advantage of incremental revenue-generating opportunities, primarily through an array of improved and differentiated customer experiences in (1) more comfort and convenience; (2) food and beverage; (3) engagement and loyalty; (4) sight and sound; and (5) targeted programming. The following table provides detail with respect to the geographic location of our theatrical exhibition circuit as of December 31, 2018:
6
|
U.S. Markets |
|
Theatres(1) |
|
Screens(1) |
|
|
Alabama |
|
18 |
|
232 |
|
|
Arizona |
|
12 |
|
197 |
|
|
Arkansas |
|
6 |
|
60 |
|
|
California |
|
55 |
|
741 |
|
|
Colorado |
|
15 |
|
199 |
|
|
Connecticut |
|
6 |
|
73 |
|
|
Delaware |
|
1 |
|
14 |
|
|
Florida |
|
39 |
|
612 |
|
|
Georgia |
|
35 |
|
438 |
|
|
Idaho |
|
1 |
|
11 |
|
|
Illinois |
|
52 |
|
600 |
|
|
Indiana |
|
24 |
|
321 |
|
|
Iowa |
|
7 |
|
92 |
|
|
Kansas |
|
8 |
|
115 |
|
|
Kentucky |
|
6 |
|
66 |
|
|
Louisiana |
|
7 |
|
99 |
|
|
Maryland |
|
12 |
|
132 |
|
|
Massachusetts |
|
10 |
|
142 |
|
|
Michigan |
|
18 |
|
248 |
|
|
Minnesota |
|
9 |
|
120 |
|
|
Missouri |
|
12 |
|
150 |
|
|
Montana |
|
6 |
|
61 |
|
|
Nebraska |
|
4 |
|
43 |
|
|
Nevada |
|
2 |
|
28 |
|
|
New Hampshire |
|
1 |
|
10 |
|
|
New Jersey |
|
27 |
|
354 |
|
|
New Mexico |
|
2 |
|
14 |
|
|
New York |
|
27 |
|
283 |
|
|
North Carolina |
|
25 |
|
332 |
|
|
North Dakota |
|
4 |
|
30 |
|
|
Ohio |
|
16 |
|
205 |
|
|
Oklahoma |
|
17 |
|
174 |
|
|
Oregon |
|
1 |
|
12 |
|
|
Pennsylvania |
|
30 |
|
331 |
|
|
South Carolina |
|
7 |
|
75 |
|
|
South Dakota |
|
4 |
|
31 |
|
|
Tennessee |
|
22 |
|
263 |
|
|
Texas |
|
46 |
|
697 |
|
|
Utah |
|
3 |
|
33 |
|
|
Virginia |
|
12 |
|
164 |
|
|
Washington |
|
14 |
|
167 |
|
|
West Virginia |
|
2 |
|
20 |
|
|
Wisconsin |
|
6 |
|
73 |
|
|
Wyoming |
|
1 |
|
9 |
|
|
District of Columbia |
|
5 |
|
43 |
|
|
Total U.S. Markets |
|
637 |
|
8,114 |
|
|
|
|
|
|
|
|
|
International Markets |
|
|
|
|
|
|
Austria |
|
3 |
|
38 |
|
|
Denmark |
|
2 |
|
10 |
|
|
Estonia |
|
3 |
|
15 |
|
|
Finland |
|
26 |
|
150 |
|
|
Germany |
|
24 |
|
215 |
|
|
Ireland |
|
11 |
|
77 |
|
|
Italy |
|
50 |
|
501 |
|
|
Latvia |
|
1 |
|
14 |
|
|
Lithuania |
|
6 |
|
40 |
|
|
Norway |
|
13 |
|
94 |
|
|
Portugal |
|
3 |
|
45 |
|
|
Spain |
|
44 |
|
501 |
|
|
Sweden |
|
74 |
|
410 |
|
|
United Kingdom |
|
109 |
|
867 |
|
|
Total International Markets |
|
369 |
|
2,977 |
|
|
Total |
|
1,006 |
|
11,091 |
|
7
accounted for following the equity method. In the International markets segment we manage and own 50% economic interests in 58 theatres and 249 screens accounted for following the equity method and own a 50% economic interest in one IMAX® screen accounted for following the equity method. |
Our historic growth also has been driven by a combination of organic growth and acquisition strategies, in addition to strategic alliances and partnerships that highlight our ability to capture innovation and value beyond the traditional exhibition space. For example:
|
· |
In December 2013, NCM spun-off its Fathom Events (“Fathom”) business to a newly formed limited liability company AC JV, LLC (“AC JV”). AC JV focuses exclusively on alternative content programming, including live and pre-recorded concerts, sporting events and other non-film entertainment. |
|
· |
We hold an interest in Digital Cinema Implementation Partners, LLC (“DCIP”), a joint venture charged with implementing digital cinema in our theatres, which has allowed us to substantially complete our planned digital deployments. |
|
· |
We own an interest in Digital Cinema Distribution Coalition, LLC (“DCDC”), a joint venture with certain other exhibitors and film distributors. DCDC was formed to develop a satellite distribution network for feature films and other digital cinema content. As of December 31, 2018, all 637 of our U.S. theatre locations are equipped to receive content via the DCDC network. |
|
· |
We have long-term agreements for screen advertising services with NCM and Screenvision. We believe that the reach, scope, and digital delivery capability of their network provides an effective platform for national, regional, and local advertisers to reach an engaged audience and we receive theatre access fees for participation in their network. |
The following table sets forth our historical information concerning new builds (including expansions), acquisitions and dispositions (including net construction closures) and end-of-period operated theatres and screens through December 31, 2018:
|
|
|
|
|
|
|
|
|
|
|
Permanent/Temporary |
|
|
|
|
|
||
|
|
|
|
|
|
|
|
|
|
|
Closures/(Openings), |
|
|
|
|
|
||
|
|
|
New Builds |
|
Acquisitions |
|
net |
|
Total Theatres |
|
||||||||
|
|
|
Number of |
|
Number of |
|
Number of |
|
Number of |
|
Number of |
|
Number of |
|
Number of |
|
Number of |
|
|
Fiscal Year |
|
Theatres |
|
Remodels |
|
Theatres |
|
Screens |
|
Theatres |
|
Screens |
|
Theatres |
|
Screens |
|
|
Beginning balance |
|
|
|
|
|
|
|
|
|
|
|
|
|
342 |
|
4,975 |
|
|
Calendar 2013 |
|
1 |
|
12 |
|
4 |
|
37 |
|
4 |
|
61 |
|
343 |
|
4,963 |
|
|
Calendar 2014 |
|
3 |
|
29 |
|
4 |
|
36 |
|
4 |
|
81 |
|
346 |
|
4,947 |
|
|
Calendar 2015 |
|
2 |
|
23 |
|
40 |
|
410 |
|
1 |
|
(46) |
|
387 |
|
5,426 |
|
|
Calendar 2016 |
|
2 |
|
17 |
|
520 |
|
5,201 |
|
3 |
|
86 |
|
906 |
|
10,558 |
|
|
Calendar 2017 |
|
12 |
|
96 |
|
128 |
|
736 |
|
32 |
|
221 |
|
1,014 |
|
11,169 |
|
|
Calendar 2018 |
|
11 |
|
89 |
|
4 |
|
39 |
|
23 |
|
206 |
|
1,006 |
|
11,091 |
|
|
|
|
31 |
|
266 |
|
700 |
|
6,459 |
|
67 |
|
609 |
|
|
|
|
|
8
The following table provides detail with respect to digital delivery, 3D enabled projection, large screen formats, such as IMAX® and our proprietary Dolby Cinema™ at AMC, other PLF screens, enhanced food and beverage offerings and our premium seating as deployed throughout our circuit on December 31, 2018:
|
Format |
|
Theatres |
|
Screens |
|
|
Digital |
|
1,006 |
|
11,091 |
|
|
3D enabled (includes IMAX, ETX and IDX) |
|
1,006 |
|
5,411 |
|
|
IMAX (3D enabled) |
|
215 |
|
216 |
|
|
Dolby Cinema at AMC |
|
127 |
|
127 |
|
|
Other PLF (3D enabled) |
|
112 |
|
112 |
|
|
Dine-in theatres |
|
29 |
|
437 |
|
|
Premium seating |
|
345 |
|
3,279 |
|
Our Strategy
We are committed to maintaining a leadership position in the exhibition industry by focusing on forward thinking initiatives for the benefit of our guests. Improving the guest experience remains at our core and is now supported by three strategic elements: (1) Enhance, (2) Engage and (3) Expand. Consistent with our history and culture of innovation, we believe our vision and relentless focus on these three elements, which apply strategic and marketing components to traditional theatrical exhibition, will drive our future success.
|
1) |
Enhance |
We plan to continue investing in our theatres and enhancing the consumer experience to take greater advantage of incremental revenue-generating opportunities, primarily through comfort and convenience innovations, imaginative food and beverage initiatives, and exciting PLF offerings.
Comfort and Convenience Innovations - Recliner seating is the key feature of our theatre renovations. We believe that maximizing comfort and convenience for our customers will be increasingly necessary to maintain and improve our relevance. These renovations, in conjunction with capital contributions from our landlords, involve stripping theatres to their basic structure in order to replace finishes throughout, upgrade the sight and sound experience, installing modernized points of sale and, most importantly, replacing traditional theatre seats with plush, electric recliners that allow customers to deploy a leg rest and fully recline at the push of a button. The quality improvement in the customer experience drives a 30% to 50% increase in attendance, on average, at these locations in their first-year post renovation. Our customers have responded favorably to the significant personal space gains from ample row depths, ability to recline or stretch their legs, extra-wide pillowed chaise and oversized armrests. The reseated theatres attract more midweek audiences than normal theatres and tend to draw more adults who pay higher ticket prices than teens or young children. Upon reopening a remodeled theatre, we typically increase the ticket price to reflect that enhanced consumer experience. Additionally, remodeled theatres tend to draw more adults who pay higher ticket prices than teens or young children, as well as more customers who upgrade their tickets to premium formats.
We plan to continue investing in our theatres and upgrading the consumer experience to take greater advantage of incremental revenue-generating opportunities, primarily through an array of improved and differentiated customer experiences. These experiences include greater engagement and loyalty through world class marketing, a keen focus on the quality of on-screen presentation and programming content, more and faster deployment of comfort and convenience and food and beverage initiatives, all while developing and utilizing new technologies across these platforms for the benefit of our consumers.
We also plan to open new-build theatres, explore profitable acquisitions, and expand through disciplined spot-acquisitions of single theatre locations. We believe new-build construction, spot-acquisitions, and other acquisitive activity offer us additional opportunities to introduce our proven guest focused strategies to new movie-goers and will generate meaningful benefits to guests, associates, studio partners and our shareholders.
As of December 31, 2018, we now feature recliner seating in approximately 345 theatres, including Dine-in-Theatres, totaling approximately 3,279 screens and representing 29.5% of total screens. By the end of 2019, we expect AMC theatres to operate 3,875 screens with recliner seating. Based on feedback from our guests, we believe there is universal appeal for the ample space, comfort and convenience of our powered recliners, and that appeal will translate
9
into additional attendance in new markets both domestically and in Europe. As such, deploying powered recliners will be an integral strategy in the former Carmike and Odeon circuits going forward as we are targeting approximately 43% of our total screens to be comprised of screens with recliner seating by the end of 2021.
Rebalancing of the new supply-and-demand relationship created by recliner seating presents us two further opportunities to improve customer convenience and maximize operating results: open-source internet ticketing and reserved seating.
Open-source internet ticketing makes AMC’s entire universe of seats (over 1.2 million as of December 31, 2018), for all our show times, as available as possible, on as many websites and mobile applications as possible. Our tickets are currently on sale over the internet, either directly or through mobile apps, at our own website and our mobile app and Fandango®, Movietickets.com®, and Atom Tickets. We believe increased online access is important because it captures customers’ purchase intent more immediately and directly than if we wait for their arrival at the theatre box office to make a purchase. Carefully monitoring internet pre-sales also lets us adjust capacity in real time, moving movies that are poised to over perform to larger capacity auditoriums or more additional auditoriums, thereby maximizing yield. During calendar 2018, our internet and mobile ticketing app services sold approximately 67 million tickets for AMC.
Reserved seating at some of AMC’s locations, allows our customers to choose a specific seat in advance of the movie. We believe that knowing there is a specifically chosen seat waiting for a show that promises to be a sellout is comforting to our customers and compels ticket purchases.
We believe the comfort and personal space gains from recliner seating, coupled with the immediacy of demand captured from open-source internet ticketing and the appeal of reserved seating make a powerful economic combination for us.
Imaginative Food and Beverage Initiatives - Our deployment initiatives also apply to food and beverage enhancements. We have expanded our menu of enhanced food and beverage products to include meals, healthy snacks, premium beers, wine and mixed drinks and other gourmet products. We plan to invest across a spectrum of enhanced food and beverage formats, ranging from simple, less capital‑intensive food and beverage design improvements to the development of new dine‑in theatre options. We launched the AMC Feature Fare menu in 2017 to over 300 AMC brand locations with an additional 66 planned in 2019. This was the largest menu overall in AMC history.
Our MacGuffins Bar and Lounges (“MacGuffins”) give us an opportunity to engage our over-21 customers. As of December 31, 2018, we offer alcohol in approximately 339 AMC theatres in the U.S. markets. We expect to increase that number to approximately 367 by the end of 2019. We believe there is ample opportunity to introduce premium beers, wines and liquors throughout the former Carmike and Odeon circuits, and we would like to install our alcohol service in as many theatres globally as we can. We will continue to work with state and local officials in the United States, and the necessary officials in Europe to expand the number of theatres with this appealing amenity. Due to our success in operating MacGuffins, we believe we can leverage our substantial experience when it comes to permitting, installing and commissioning these improvements.
In our reserved seat auditoriums, our innovative services allow for advance online ordering of concession items with an advance ticket order that, in certain theatres, is then delivered to the guest’s seat at a specified time of the guest’s choosing. We currently operate 52 theatres with the pre-order service. We are currently evaluating system compatibility and mobile application functionality to determine timing for deployment in Europe.
The number of guests at domestic AMC theatres who are choosing to purchase a beverage or food item has increased from 64% of our attendance in 2011 to more than 71% in 2018.
Exciting Premium Large Format Offerings - PLF auditoriums generate our highest customer satisfaction scores, and we believe the investment in premium formats increases the value of the movie-going experience for our guests, ultimately leading to additional ticket revenue. To that end we are committed to investing in and expanding our offerings of the best sight and sound experiences through a combination of our partnerships with IMAX® and Dolby Cinema™ and the future development of our own proprietary PLF offering.
IMAX®—IMAX® is one of the world’s leading entertainment technology companies, specializing in motion picture technologies and presentations.
10
As of December 31, 2018, legacy AMC was the largest IMAX® exhibitor in the U.S., with 216 (3D enabled) IMAX® screens and a 51% market share. Each one of our IMAX® local installations is protected by geographic exclusivity, and as of December 31, 2018, our IMAX® screen count was 99% greater than our closest competitor. We also operate 25 IMAX® screens in Europe. We also will continue to expand our IMAX® relationship into former Carmike, Odeon, and Nordic theatres as we integrate all three of the circuits, further strengthening our position as the largest IMAX® exhibitor in the U.S. and growth as an IMAX® distributor in the United Kingdom and Europe.
Dolby Cinema™ at AMC— Dolby Cinema™ at AMC offers a premium cinema offering for movie-goers that combined state‑of‑the‑art image and sound technologies with inspired theatre design and comfort. Dolby Cinema™ at AMC includes Dolby Vision™ laser projection and object‑oriented Dolby Atmos® audio technology, as well as AMC’s plush power reclining seats with seat transducers that vibrate with the action on screen.
In August 2016, we announced the acceleration of our Dolby Cinema™ at AMC deployment and as of December 31, 2018, we operated 127 Dolby Cinema™ at AMC auditoriums. The legacy AMC circuit expects to have 140 Dolby Cinema™ at AMC auditoriums operational by the end of 2019. We expect to expand deployment of our innovative Dolby Cinema™ at AMC auditoriums into former Carmike, Odeon, and Nordic locations as we integrate all circuits.
Prime at AMC—We continue to add our private label PLF experience to many of our locations, with superior sight and sound technology and enhanced seating as contrasted with our traditional auditoriums. This proprietary PLF auditorium is branded Prime at AMC and offers an enhanced theatrical experience for movie-goers beyond our current core theatres, at a lower price premium than IMAX® or Dolby Cinema™ at AMC. Therefore, it may be especially relevant in smaller or more price sensitive markets. As of December 31, 2018, we operated 18 Prime at AMC screens.
|
2) |
Engage |
Marketing - AMC is engaging movie-goers marketing activities to strengthen the bonds with our current guests and create new connections with potential customers that drive both growth and loyalty. AMC Stubs® is a customer loyalty program which allows members to earn rewards, receive discounts and participate in exclusive members‑only offerings and services. It features both a traditional paid tier called AMC Stubs Premiere™ for a $15 annual membership fee and a non-paid tier called AMC Stubs Insider™. Both programs reward loyal guests for their patronage of AMC theatres. Rewards earned are redeemable on future purchases at AMC locations.
On June 20, 2018, we announced the launch of AMC Stubs® A-List, a new tier of our AMC Stubs® loyalty program. This program offers guests admission to movies at AMC up to three times per week including multiple movies per day and repeat visits to already seen movies from $19.95 to $23.95 per month depending upon geographic market. AMC Stubs® A-List also includes premium offerings including IMAX®, Dolby Cinema™ at AMC, RealD, Prime and BigD. AMC Stubs® A-List members can book tickets on-line in advance and select specific seats at AMC Theatres with reserved seating.
As of December 31, 2018, we had more than 17,300,000 member households enrolled in AMC Stubs® A-List, AMC Stubs Premiere™ and AMC Stubs Insider™ programs, combined. Our AMC Stubs® members represented approximately 35.4% of AMC U.S. markets attendance during the year ended December 31, 2018. We expect the number of member households to continue to increase over the next 24 to 36 months. We believe movie-goers want to be recognized and rewarded for attending our theatres and as a result, our new AMC Stubs® program is designed to strengthen guest loyalty, attract new guests and drive additional return visits. Our much larger database of identified movie-goers also provides us with additional insight into our customers’ movie preferences, and this enables us to have both a larger and a more targeted marketing effort to support our Hollywood studio partners. We intend to creatively mine this rapidly growing consumer database to increase sales and otherwise boost loyalty to AMC.
Odeon currently has loyalty programs in all the major territories in which it operates. Odeon movie-goers can earn points for spending money at the theatre, and those points can be redeemed for tickets and concession items at a later date. Odeon currently has more than three million active members in these various loyalty programs. We are currently evaluating the Odeon loyalty programs to determine how best to reward our European movie-goers and heighten guest loyalty to drive additional attendance to Odeon theatres.
11
Our marketing efforts are not limited to our loyalty program as we continue to improve our customer connections through our website and mobile app. We believe our competitive advantage of a robust and easy‑to‑use online and mobile presence combined with an effective loyalty program that provides better market intelligence to anticipate customer’s future behavior should allow us to capture incremental share of both entertainment dollars and time.
Additionally, to align guest expectations and cost structures across the broader U.S. platform comprised of legacy AMC and former Carmike theatres, on March 1, 2017 we announced a differentiated multi-brand strategy.
During 2017, all Carmike theatres were re-branded to be part of the AMC theatres. Every AMC location now operates under one of the following AMC brands:
|
· |
AMC Classic Theatres – America’s Hometown Theatres. Approximately 230 theatres, located primarily in smaller mid-sized and suburban markets, offering fun, friendly, amenities and menu items guests can depend on for a great movie-going experience with value in mind. Some AMC Classic theatres may include MacGuffins bars and Prime at AMC PLF auditoriums. |
|
· |
AMC Dine-In Theatres – Movies with a Menu. Approximately 29 locations, equipped with full kitchens and MacGuffins full bars, will offer great experiences including full-service dining as well as delivery-to-seat of AMC’s menu and beverage offerings. Guests can enjoy a variety of fresh, hand-crafted menu items that rival anything they’d find at their local restaurant, as well as an exciting array of drinks and desserts. |
Inclusive Programming - Our core business is the exhibition of wide-release theatrical Hollywood movies, which distributors promote with significant mass market advertising. We complement this offering of broadly popular movies with more specialized content, seeking to ensure we have entertainment appealing to all audience segments. For example, during the year ended December 31, 2018, AMC theatres exhibited 358 non-English language films which generated approximately $43.0 million of box office revenue.
We believe we are a vital partner for Hollywood studios and for independent distributors because we generate more box office revenue per screen and provide stronger in theatre and online promotional exposure for their movies. To that end, we are committed to working with our studio partners to further innovation, exchange ideas and discover mutually beneficial ways to expand movie-going.
|
3) |
Expand |
We intend to grow through the deployment of our strategic growth initiatives and will continue exploration of acquisitions. Our acquisition strategy combines discipline and purpose with a strong investment thesis for each transaction that we believe will drive value in the long term.
Disciplined new-build theatres and acquisitions expand the platform, whether domestically or internationally, upon which to further deploy our proven strategic initiatives while further diversifying AMC’s consumer base, leading to greater appeal for more films.
The additional scale achieved through new build theatres and acquisitions also serves to benefit AMC through global procurement savings and increased overhead efficiencies. We believe that expansion offers us additional opportunities to introduce our proven guest focused strategies to new movie-goers and will generate meaningful benefits to guests, associates, studio partners and our shareholders.
We believe significant financial opportunities exist in our current portfolio of theatres both in the United States and in Europe, and we have a substantial pipeline of investments to exploit that offer incremental attendance-generating and revenue-generating prospects. By expanding through new-build development and acquisitions and deploying building-by-building solutions from a proprietary menu of proven, customer-endorsed comfort and convenience,
12
enhanced food and beverage, and premium sight and sound concepts, we believe we have the formula for continuing growth and success.
Our Competitive Strengths
We believe we have the following competitive strengths:
Leading Market Share in Important, Affluent and Diverse Markets— Across the three biggest metropolitan markets in the United States—New York, Los Angeles and Chicago, representing 20% of the country’s total box office—we hold a 36% combined market share. As of December 31, 2018, we have theatres located in 24 of the top 25 U.S. markets, holding the #1 or #2 position in 21 of those 25 markets based on box office revenue. On any given weekend, nearly one-half of the top ten theatres for the #1 opening movie title in the United States are AMC theatres, according to data provided by Comscore. We are also the #1 theatre operator in the United Kingdom, Ireland, Italy, Norway, Finland, Latvia, Lithuania, Estonia, and Spain; the #2 operator in Portugal; and the #4 operator in Germany. We believe our strong presence in these top markets makes our theatres highly visible and therefore strategically more important to content providers, who rely on the large audiences and marketing momentum provided by major markets to drive opinion‑making and deliver a movie’s overall box office results.
We have a diversified footprint with complementary global geographic and guest demographic profiles. There are inherent complexities in effectively and efficiently serving them. In some of our more densely populated major metropolitan markets, there is also a scarcity of attractive retail real estate opportunities. Taken together, these factors solidify our market share position. Further, our history and strong presence in these markets have created a greater opportunity to introduce our enhanced customer experience concepts and exhibit a broad array of programming and premium formats, all of which we believe drive higher levels of attendance and higher revenues at our theatres.
Our domestic acquisitions further diversified our footprint with theatres located in complementary suburban and rural markets as well as in geographic areas of the United States like the southeast. Guests from different demographic and geographic profiles have different tastes in movies, and we believe by broadening our geographic base, we can help mitigate the impact of film genre volatility on our box office revenues.
Well Located, Highly Productive Theatres—Our theatres are generally located in the top retail centers across the United States. We believe this provides for long-term visibility and higher productivity and is a key element in the success of our Enhanced Food and Beverage and More Comfort and Convenience initiatives. Our location strategy, combined with our strong major market presence, enable us to deliver industry-leading theatre-level productivity. During the year ended December 31, 2018, six of the ten highest grossing theatres in the United States were AMC theatres, according to data provided by Comscore. During the same period AMC’s U.S. markets average total revenues per theatre was approximately $6.3 million. This per unit productivity is important not only to content providers, but also to developers and landlords, for whom per location and per square foot sales numbers are critical measures. The net effect is a close relationship with the commercial real estate community, which often gives us first‑look and preferred tenant status on emerging opportunities.
AMC Classic theatres are located primarily in smaller, suburban and rural markets, which affects total revenues per theatre. However, in general, theatres located in smaller suburban and rural markets tend to have less competition and a lower cost structure, and we believe when combined with our innovative strategic initiatives that productivity will improve.
Many Odeon theatres share similar characteristics as AMC theatres in that they tend to be located in the top retail centers in major metropolitan markets with higher visibility. We believe that deploying our proven strategic initiatives in these markets will help drive attendance and greatly improve productivity.
The Nordic theatres are in larger and mid-sized cities and towns in affluent Northern Europe as well as in the Baltic region. The theatres are well maintained including some with AMC-like amenities already evident. With a modern, up-to-date circuit and very high market share, the Nordic theatres will require some investment but not nearly the amount expected for the Odeon theatres. Nordic has an ample pipeline of new-build and renovation opportunities already identified, and with some investment in our enhanced food and beverage and premium sight and sound initiatives, we believe there are ample growth opportunities.
13
Selectively Participating in a Consolidating Industry—Throughout the last two decades, AMC has been an active participant in our industry’s consolidation. We intend to selectively explore acquisitions in the United States and internationally where the characteristics of the location, overall market and facilities further enhance the quality of our theatre portfolio.
Additionally, our focus on improving the customer experience and our strong relationships with landlords and developers have provided opportunities to expand our footprint in existing markets by acquiring competitors’ existing theatres at the end of their lease term at little or no cost. We believe that our More Comfort and Convenience and Enhanced Food and Beverage concepts have high appeal to landlords wanting to increase traffic and sales in their retail centers. These “spot acquisitions” have given us the ability to bolster our presence in existing markets at relatively low cost and more quickly (weeks, months) as compared to new builds (months, years).
Substantial Operating Cash Flow—For the years ended December 31, 2018, December 31, 2017 and December 31, 2016, AMC’s net cash provided by operating activities totaled $523.2 million, $537.4 million, and $431.7 million, respectively. We believe that our strategic initiatives, highly productive theatre circuit and continued focus on cost control will enable us to generate sufficient cash flow provided by operating activities to execute our strategy, to grow our revenues, maintain our facilities, service our indebtedness, continue our stock repurchase plan and pay dividends to our stockholders.
Experienced and Dynamic Team—Our senior management team, led by Adam Aron, President and Chief Executive Officer, has the expertise that we believe will be required to transform movie-going from a commodity to a differentiated entertainment experience. Our senior management team has experience operating both domestic and international theatres. A dynamic and balanced team of executives combines long-tenured leaders in operations, real estate and finance who contributed to building AMC’s hard-earned reputation for operations excellence with creative entertainment and restaurant industry executives in marketing, programming and food and beverage who bring to AMC business acumen and experience that support innovation in theatrical exhibition.
With a technology platform in our Theatre Support Center that provides for real-time monitoring of AMC screens across the country and a workplace conducive to collaboration and teamwork, our management team has the organization well aligned with our strategy.
Furthermore, we believe that our people, the nearly 40,200 AMC associates, constitute an essential strength of AMC. They strive to make movie-going experiences at AMC theatres always a treat. We create events and want our customers to always feel special at an AMC theatre.
Key Strategic Shareholder—Our key strategic shareholder, the Dalian Wanda Group Co. (“Wanda”), is one of the largest, privately-held conglomerates in China. Wanda is our single largest shareholder with a 50.01% ownership stake as of December 31, 2018. In addition to its core business as a prominent developer and owner of commercial real estate, Wanda also owns related businesses in entertainment, hospitality and retail. Wanda is the largest theatre exhibition operator in China through its controlling ownership interest in Wanda Cinema Line. The combined ownership and scale of AMC and Wanda Cinema Line has enabled us to enhance relationships and obtain better terms from important food and beverage, lighting and theatre supply vendors, and to expand our strategic partnerships with IMAX® and Dolby®. When our scale and Wanda’s growth are taken into account, we believe AMC is the most efficient and effective partner a content owner has. Wanda is controlled by its chairman, Mr. Jianlin Wang.
Film Content
Box office admissions are our largest source of revenue. We predominantly license “first-run” films from distributors owned by major film production companies and from independent distributors on a film-by-film and theatre-by-theatre basis. Film exhibition costs are accrued based on the applicable admissions revenues and estimates of the final settlement pursuant to our film licenses. These licenses typically state that rental fees are based on aggregate terms established prior to the opening of the picture. In certain circumstances and less frequently, our rental fees are based on a mutually agreed settlement upon the conclusion of the picture. In some European territories, rental fees are established on a weekly basis for the coming week’s percentage forecast. Some European licenses use a per capita agreement instead, paying a flat amount per ticket, where the sum is agreed in long-term agreements in advance of the film showing. Under an aggregate terms formula, we usually pay the distributor a specified percentage of box office gross or
14
pay based on a scale of percentages tied to different amounts of box office gross, or in Europe, we pay based on the number of weeks since release. The settlement process allows for negotiation based upon how a film actually performs.
During the 2018 calendar year, films licensed from our seven largest distributors based on revenues accounted for approximately 90% of our U.S. admissions revenues. In Europe, approximately 80% of our box office revenue came from films attributed to our six largest distributors. Our revenues attributable to individual distributors may vary significantly from year to year depending upon the commercial success of each distributor’s films in any given year.
Our revenues are dependent upon the timing and popularity of film releases by distributors. The most marketable films are usually released during the summer and the calendar year-end holiday seasons. Therefore, our business is highly seasonal, with higher attendance and revenues generally occurring during the summer months and holiday seasons. Our results of operations may vary significantly from quarter to quarter and from year to year.
Food and beverage
Food and beverage sales are our second largest source of revenue after box office admissions. Food and beverage items traditionally include popcorn, soft drinks, candy and hot dogs. Different varieties of food and beverage items are offered at our theatres based on preferences in the particular geographic region. Our traditional food and beverage strategy emphasizes prominent and appealing food and beverage offerings designed for rapid service and efficiency, including a customer friendly self-serve experience. We design our theatres to have more food and beverage capacity to make it easier to serve larger numbers of customers. Strategic placement of large food and beverage operations within theatres increases their visibility, aids in reducing the length of lines, allows flexibility to introduce new concepts and improves traffic flow around the food and beverage stands.
To address recent consumer trends, we have expanded our menu of enhanced food and beverage products to include made-to-order drinks and meals, customized coffee, healthy snacks, premium beers, wine and mixed drinks and other gourmet products. We plan to continue investment across a spectrum of enhanced food and beverage formats, ranging from simple, less capital-intensive food and beverage design improvements to the development of new dine-in theatre options. The costs of these conversions in some cases are partially covered by investments from the theatre landlord. We currently operate 29 Dine-In Theatres that deliver chef-inspired menus with seat-side or delivery service to luxury recliners with tables. Our recent Dine-In Theatre concepts are designed to capitalize on the latest food service trend, the fast casual eating experience.
Employees
As of December 31, 2018, we employed 4,408 full-time and 35,754 part-time employees. We consider our employee relations to be good.
Theatrical Exhibition Industry and Competition
U.S. Markets
Movie-going is embedded in the American social fabric. For over 100 years people young and old, of all races and socio-economic levels, have enjoyed the entertainment that motion pictures offer.
In the United States, the movie exhibition business is large, stable and mature. While in any given calendar quarter the quantity and quality of movies can drive volatile results, box office revenues have generally advanced from 2009 to 2018. The industry’s best year ever, in terms of revenues, was 2018, with box office revenues of approximately $11.9 billion, an increase of approximately 6.9% from 2017 with 1.3 billion admissions in the U.S. and Canada.
The movie exhibition business has survived the booms and busts of economic cycles and has adapted to myriad changes in technology and customer behavior. There is great value for the entertainment dollar in movie-going, and no replacement has been invented for the escape and fun that a night at the movies represents.
After decades of economic models driven by quantity (number of theatres, screens and seats), we believe it is the quality of the movie-going experience that will define future success. Whether through enhanced food and beverage options (Food and Beverage Kiosks, Marketplaces, Coke Freestyle®, MacGuffins or Dine-in Theatres), more comfort and convenience (recliner seating, open-source internet ticketing, reserved seating), engagement and loyalty (AMC
15
Stubs®, open-source internet ticketing, mobile apps, social media) or sight and sound (digital projectors, 3D, Dolby Cinema™ at AMC, other PLF screens or IMAX®), it is the ease of use and the amenities that these innovations bring to customers that we believe will drive sustained profitability in the years ahead.
The following table represents information about the U.S./Canada exhibition industry obtained from the National Association of Theatre Owners (“NATO”) and Box Office Mojo:
|
|
|
Box Office |
|
|
|
Average |
|
|
|
|
|
||
|
|
|
Revenues |
|
Attendance |
|
Ticket |
|
Number of |
|
Indoor |
|
||
|
Calendar Year |
|
(in millions) |
|
(in millions) |
|
Price |
|
Theatres |
|
Screens |
|
||
|
2018 |
|
$ |
11,858 |
|
1,301 |
|
$ |
9.11 |
|
5,482 |
|
40,313 |
|
|
2017 |
|
|
11,091 |
|
1,236 |
|
|
8.97 |
|
5,398 |
|
39,651 |
|
|
2016 |
|
|
11,372 |
|
1,314 |
|
|
8.65 |
|
5,472 |
|
40,009 |
|
|
2015 |
|
|
11,135 |
|
1,321 |
|
|
8.43 |
|
5,484 |
|
39,411 |
|
|
2014 |
|
|
10,353 |
|
1,267 |
|
|
8.17 |
|
5,463 |
|
39,356 |
|
|
2013 |
|
|
10,921 |
|
1,343 |
|
|
8.13 |
|
5,326 |
|
39,368 |
|
|
2012 |
|
|
10,837 |
|
1,361 |
|
|
7.96 |
|
5,317 |
|
39,056 |
|
|
2011 |
|
|
10,174 |
|
1,283 |
|
|
7.93 |
|
5,331 |
|
38,974 |
|
|
2010 |
|
|
10,566 |
|
1,339 |
|
|
7.89 |
|
5,399 |
|
38,902 |
|
|
2009 |
|
|
10,596 |
|
1,413 |
|
|
7.50 |
|
5,561 |
|
38,605 |
|
Based on information obtained from Comscore, we believe that the four largest exhibitors, in terms of U.S./Canada box office revenue (Regal Entertainment Group, AMC, Cinemark Holdings, Inc. and Cineplex Inc.) generated approximately 64% of the box office revenues in 2018. This statistic is up from 35% in 2000 and is evidence that the theatrical exhibition business in the U.S. / Canada has been consolidating.
Movie-going is a popular leisure activity with high penetration across Odeon’s and Nordic’s key geographies. Theatre appeal has proven resilient to competition for consumers’ leisure spending and to recessionary periods and we believe we will continue to benefit from increased spending across international markets. The European market lags the U.S. market across a number of factors, including annual spend per customer, number of IMAX® screens and screens per capita that cause us to believe that the deployment of our customer initiatives will be successful in these markets. On the other hand, our European markets are more densely populated and operate with fewer screens per one million of population, making the screens we acquired more valuable.
Additionally, international markets have become increasingly important. The percentage of total box office revenues attributable to International markets increased from 69% in 2012 to 73% in 2017. U.S. films generate the majority of the box office in Europe, but movie-goers in specific geographies welcome locally produced films with local actors and familiar story lines which can mitigate film genre attendance fluctuations. Going forward, we believe we will see positive growth in theatre attendance as we deploy our proven guest centered innovations like recliner seating, enhanced food and beverage offerings and premium large format experiences.
Our theatres are subject to varying degrees of competition in the geographic areas in which they operate. Competition is often intense with respect to attracting patrons, licensing motion pictures and finding new theatre sites. Where real estate is readily available, it is easier to open a theatre near one of our theatres, which may adversely affect operations at our theatre. However, in certain of our densely populated major metropolitan markets, we believe a scarcity of attractive retail real estate opportunities enhances the strategic value of our existing theatres. We also believe the complexity inherent in operating in these major metropolitan markets is a deterrent to other less sophisticated competitors, protecting our market share position.
The theatrical exhibition industry faces competition from other forms of out-of-home entertainment, such as concerts, amusement parks and sporting events, and from other distribution channels for filmed entertainment, such as cable television, pay-per-view, video streaming services, and home video systems, as well as from all other forms of entertainment.
16
Movie-going is a compelling consumer out-of-home entertainment experience. Movie theatres currently garner a relatively small share of overall consumer entertainment time and spend, leaving significant room for further expansion and growth in the United States and internationally. In addition, our industry benefits from available capacity to satisfy additional consumer demand without capital investment.
Regulatory Environment
The distribution of motion pictures is, in large part, regulated by federal and state antitrust laws and has been the subject of numerous antitrust cases. The consent decrees, resulting from one of those cases to which we were not a party, have a material impact on the industry and us. Those consent decrees bind certain major motion picture distributors and require the motion pictures of such distributors to be offered and licensed to exhibitors, including us, on a film-by-film and theatre-by-theatre basis. Consequently, we cannot assure ourselves of a supply of motion pictures by entering into long-term arrangements with major distributors, but must compete for our licenses on a film-by-film and theatre-by-theatre basis.
Our theatres in the United States must comply with Title III of the Americans with Disabilities Act, or ADA. Compliance with the ADA requires that public accommodations, including websites and mobile apps for such accommodations, “reasonably accommodate” individuals with disabilities and that new construction or alterations made to “commercial facilities” conform to accessibility guidelines unless “structurally impracticable” for new construction or technically infeasible for alterations. Non-compliance with the ADA could result in the imposition of injunctive relief, fines, and awards of damages to private litigants or additional capital expenditures to remedy such noncompliance. As an employer covered by the ADA, we must make reasonable accommodations to the limitations of employees and qualified applicants with disabilities, provided that such reasonable accommodations do not pose an undue hardship on the operation of our business. In addition, many of our employees are covered by various government employment regulations, including minimum wage, overtime and working conditions regulations. In Europe, all territories have similar national regulations relating to disabilities.
Our operations also are subject to federal, state and local laws regulating such matters as construction, renovation and operation of theatres as well as wages and working conditions, citizenship, health and sanitation requirements and licensing. We believe our theatres are in material compliance with such requirements.
We own and operate theatres and other properties that operate in the United States, United Kingdom, Spain, Italy, Germany, Portugal, Ireland, Sweden, Finland, Estonia, Latvia, Lithuania, Norway, and Denmark, which are subject to various federal, state and local laws and regulations. Certain of these laws and regulations, including those relating to environmental protection, may impose joint and several liability on certain statutory classes of persons for the costs of investigation or remediation of contamination, regardless of fault or the legality of original disposal. We believe our theatres are in material compliance with such requirements.
Other Acquisitions, Dispositions, Financings and Developments
Other Acquisitions
During the year ended December 31, 2018, we entered into a Stock Issuance and Restrictions Agreement with RealD Holdings Inc. (“RealD”). The new agreement replaces a similar agreement with RealD for the lease of RealD 3D systems where rental payments continue to be variable and based on paid admissions and extends the term of the agreement to December 31, 2024. The investments are recorded at cost following the measurement alternative as there is no established market for the securities and we do not have significant influence over these entities.
In September 2017, we acquired $5.0 million in Dreamscape and $5.0 million in Central Services Studios, Inc. as part of our virtual reality technologies strategy. During January 2018, we invested an additional $5.0 million in Dreamscape and $5.0 million in Central Services Studios. We do not have significant influence over these entities and will follow the cost method of accounting.
Other Dispositions
On June 18, 2018, we entered into two Unit Purchase Agreements (the “Agreements”) with each of Regal and Cinemark pursuant to which Regal and Cinemark each separately agreed to purchase 10,738,740 common units of NCM
17
at a sales price of $7.30 per unit and aggregate consideration of approximately $156.8 million (the “Sales”). The Sales closed on July 5, 2018. Following the closing of the Sales, we no longer owned any shares of common stock in NCM, Inc. or common units in NCM. NCM consented to the Sales and waived its rights under the memorandum of understanding that provided AMC would not reduce its combined ownership of NCM and NCM, Inc. below 4.5%. We recorded a $28.9 million gain on the sale of its NCM investment during the year ended December 31, 2018.
On August 4, 2017, AMC and Regal Entertainment Group consummated a transaction for the sale of all the issued and outstanding ownership interests in Open Road Releasing, LLC (“Open Road”) for total proceeds of $28.8 million of which we received $14.0 million in net proceeds after transaction expenses for our 50% investment and for collection of amounts due from Open Road and recognized a gain on sale of $17.2 million.
In the second quarter of 2017 and in the fourth quarter of 2016, in connection with the Carmike acquisition, we divested 17 theatres as required by the Antitrust Division of the United States Department of Justice. See Part I – Recent Developments for further information.
Debt Financing of Acquisitions
On March 17, 2017, we completed an offering of $475.0 million aggregate principal amount of our Senior Subordinated Notes due 2027 (the “Notes due 2027”). We capitalized deferred financing costs of approximately $19.8 million, related to the issuance of the Notes due 2027. The Notes due 2027 mature on May 15, 2027. We will pay interest on the Notes due 2027 at 6.125% per annum, semi-annually in arrears on May 15th and November 15th, commencing on November 15, 2017. We used the net proceeds from the Notes due 2027 private offering, together with a portion of the net proceeds from the Sterling Notes due 2024 (see below) to pay a portion of the consideration for the acquisition of Nordic plus related transaction fees and expenses.
On March 17, 2017, we completed an offering of £250.0 million additional aggregate principal amount of our Sterling Notes due 2024 and an offering of £250.0 million additional aggregate principal amount of our Sterling Notes due 2024. We used the net proceeds to pay a portion of the consideration for the acquisition of Nordic plus related transaction fees and expenses.
On December 21, 2016, in connection with the Carmike acquisition, we incurred $350.0 million of bridge loans (the “Bridge Loans”) under a Bridge Loan Agreement, dated as of December 21, 2016 (the “Bridge Loan Agreement”). We repaid the Bridge Loans on February 13, 2017, with a portion of the net proceeds from our additional public offering.
On November 8, 2016, in connection with the Carmike and Odeon acquisitions, we issued $595.0 million aggregate principal amount of our 5.875% Senior Subordinated Notes due 2026 and £250.0 million ($310.0 million) of our 6.375% Senior Subordinated Notes due 2024. On November 29, 2016, in connection with the Odeon acquisition, we borrowed $500.0 million of incremental term loans under our Credit Agreement, dated as of April 30, 2013 as amended.
See the Liquidity and Capital Resources section of Item 7 of Part II hereof for further information and Note 8 – Corporate Borrowings and Capital and Financing Lease Obligations in the Notes to Consolidated Financial Statements under Part II, Item 8, hereof for further information.
Seasonality
Our revenues are dependent upon the timing of motion picture releases by distributors. The most marketable motion pictures are usually released during the summer and the year-end holiday seasons. Therefore, our business is highly seasonal, with higher attendance and revenues generally occurring during the summer months and holiday seasons. Our results of operations may vary significantly from quarter to quarter.
Available Information
We make available free of charge on our website (www.amctheatres.com) under “Investor Relations” / Financial Performance”/ “SEC Filings,” annual reports on Form 10-K, quarterly reports on Form 10-Q, current reports on Form 8-K, proxy materials on Schedule 14A and amendments to those reports as soon as reasonably practicable after we electronically file or furnish such materials with the Securities and Exchange Commission. The contents of our
18
Internet website are not incorporated into this report. The Securities and Exchange Commission maintains a website (www.sec.gov) that contains reports, proxy and information statements and other information about the Company.
Executive Officers
The following table sets forth certain information regarding our executive officers and key employees as of February 12, 2019:
|
Name |
|
Age |
|
Position(s) Held |
|
Adam M. Aron |
|
64 |
|
Chief Executive Officer, President and Director |
|
Craig R. Ramsey |
|
67 |
|
Executive Vice President and Chief Financial Officer |
|
John D. McDonald |
|
61 |
|
Executive Vice President, U.S. Operations |
|
Elizabeth Frank |
|
49 |
|
Executive Vice President, Worldwide Programming and Chief Content Officer |
|
Mark A. McDonald |
|
60 |
|
Executive Vice President, Global Development |
|
Stephen A. Colanero |
|
52 |
|
Executive Vice President and Chief Marketing Officer |
|
Kevin M. Connor |
|
56 |
|
Senior Vice President, General Counsel and Secretary |
|
Chris A. Cox |
|
53 |
|
Senior Vice President and Chief Accounting Officer |
|
Carla C. Chavarria |
|
53 |
|
Senior Vice President, and Chief Human Resources Officer |
All our current executive officers hold their offices at the pleasure of our board of directors, subject to rights under their respective employment agreements in some cases. There are no family relationships between or among any executive officers, except that Messrs. John D. McDonald and Mark A. McDonald are brothers.
Mr. Adam Aron has served as Chief Executive Officer, President and Director of the Company since January 2016. From February 2015 to December 2015, Mr. Aron was appointed Chief Executive Officer of Starwood Hotels and Resorts Worldwide, Inc. Since 2006, Mr. Aron has served as Chairman and Chief Executive Officer of World Leisure Partners, Inc. a personal consultancy for matters related to travel and tourism, high-end real estate development, and professional sports, that he founded. Mr. Aron served as Chief Executive Officer and Co-Owner of the Philadelphia 76ers from 2011 to 2013, and remains a co-owner currently. From 2006 to 2015, Mr. Aron served as Senior Operating Partner of Apollo Management L.P. Mr. Aron currently serves on the board of directors of Norwegian Cruise Line Holdings, Ltd. and the Philadelphia 76ers. Mr. Aron served on the board of directors of Prestige Cruise Holdings Inc. from 2007 to 2014. Mr. Aron received a Master’s of Business Administration degree with distinction from the Harvard Business School and a bachelor of arts degree cum laude from Harvard College.
Mr. Craig R. Ramsey has served as Executive Vice President and Chief Financial Officer of AMC since April 2002. Mr. Ramsey served as Interim Chief Executive Officer and President of the Company from August 7, 2015 until January 4, 2016. Mr. Ramsey served as Secretary of the Company from April 2002 until April 2003. Mr. Ramsey served as Senior Vice President, Finance, Chief Financial Officer and Chief Accounting Officer from August 1998 until May 2002. Mr. Ramsey served as Vice President, Finance from January 1997 to August 1998, and prior thereto, Mr. Ramsey had served as Director of Information Systems and Director of Financial Reporting since joining AMC in February 1995. Mr. Ramsey has over 30 years of experience in finance in public and private companies. Mr. Ramsey holds a B.S. degree in Accounting and Business Administration from the University of Kansas.
Mr. John D. McDonald has served as Executive Vice President, U.S. Operations of AMC since July 2009. Prior to July 2009, Mr. McDonald served as Executive Vice President, U.S. and Canada Operations effective October 1998. Mr. McDonald served as Senior Vice President, Corporate Operations from November 1995 to October 1998. Mr. McDonald is a member of the National Association of Theatre Owners Advisory board of directors, Chairman of the Technology Committee for the National Association of Theatre Owners, and member of the board of directors for DCIP. Mr. McDonald has successfully managed the integration for the Gulf States, General Cinema, Loews, and Kerasotes mergers and acquisitions. Mr. McDonald attended California State Polytechnic University where he studied economics and history.
Ms. Elizabeth Frank has served as Executive Vice President, Worldwide Programming and Chief Content Officer for AMC since July 2012. Between August 2010 and July 2012, Ms. Frank served as Senior Vice President, Strategy and Strategic Partnerships. From 2006 to 2010, Ms. Frank served as Senior Vice President of Global Programs for AmeriCares. From 2003 to 2006, Ms. Frank served as Vice President of Corporate Strategic Planning for Time Warner Inc. Prior to Time Warner Inc., Ms. Frank was a partner at McKinsey & Company for nine years. Ms. Frank
19
holds a Bachelor of Business Administration degree from Lehigh University and a Masters of Business Administration from Harvard University.
Mr. Mark A. McDonald has served as Executive Vice President, Global Development of AMC since July 2009. Prior thereto, Mr. McDonald served as Executive Vice President, International Operations from December 1998 to July 2009. Prior thereto, Mr. McDonald had served as Senior Vice President, Asia Operations since November 1995. Mr. McDonald holds a B.A. degree from the University of Southern California and a M.B.A. from the Anderson School at University of California Los Angeles.
Mr. Stephen A. Colanero has served as Executive Vice President and Chief Marketing Officer of AMC since December 2009. Prior to joining AMC, Mr. Colanero served as Vice President of Marketing for RadioShack Corporation from April 2008 to December 2009. Mr. Colanero also served as Senior Vice President of Retail Marketing for Washington Mutual Inc. from February 2006 to August 2007 and as Senior Vice President, Strategic Marketing for Blockbuster Inc. from November 1994 to January 2006. Mr. Colanero holds a B.S. degree in Accounting from Villanova University and a M.B.A. in Marketing and Strategic Management from The Wharton School at the University of Pennsylvania.
Mr. Kevin M. Connor has served as Senior Vice President, General Counsel and Secretary of AMC since April 2003. Prior to April 2003, Mr. Connor served as Senior Vice President, Legal beginning November 2002. Prior thereto, Mr. Connor was in private practice in Kansas City, Missouri as a partner with the firm Seigfreid Bingham, P.C. from October 1995. Mr. Connor holds a Bachelor of Arts degree in English and History from Vanderbilt University, a Juris Doctorate degree from the University of Kansas School of Law and LLM in Taxation from the University of Missouri-Kansas City.
Mr. Chris A. Cox has served as Senior Vice President and Chief Accounting Officer of AMC since June 2010. Prior thereto Mr. Cox served as Vice President and Chief Accounting Officer since May 2002. Prior to May 2002, Mr. Cox had served as Vice President and Controller since November 2000. Previously, Mr. Cox had served as Director of Corporate Accounting for the Dial Corporation from December 1999 until November 2000. Mr. Cox holds a Bachelor of Business Administration in degree Accounting and Finance from the University of Iowa.
Ms. Carla C. Chavarria has served as Senior Vice President, Human Resources of AMC since January 2014. Ms. Chavarria served as Vice President, Human Resources Services from September 2006 to January 2014. Prior thereto, Ms. Chavarria served as Vice President, Recruitment and Development from April 2005 to September 2006. Ms. Chavarria’ prior experience includes human resources manager and director of employment practices. Ms. Chavarria began her career at AMC in 1988 as a theatre manager in Philadelphia. Ms. Chavarria serves as co-chair for the AMC Cares Invitational and is a member of the AMC Investment Committee. She is formerly a board member for the Quality Hill Playhouse and Big Brothers Big Sisters of Kansas City. She currently serves on the boards of the Kansas City Zoo, Negro League Baseball Museum and is the chair of Win Win. Ms. Chavarria has over 20 years of human resources experience. Ms. Chavarria holds a B.S. from The Pennsylvania State University.
Risk Factors Associated with AMC’s Business
We depend on motion picture production and performance.
Our ability to operate successfully depends upon the availability, diversity and appeal of motion pictures, our ability to license motion pictures and the performance of such motion pictures in our markets. The most attended films are usually released during the summer and the calendar year-end holidays, making our business highly seasonal. We license first‑run motion pictures, the success of which has increasingly depended on the marketing efforts of the major motion picture studios. Poor performance of, or any disruption in the production of these motion pictures (including by reason of a strike or lack of adequate financing), or a reduction in the marketing efforts of the major motion picture studios, could hurt our business and results of operations. Conversely, the successful performance of these motion pictures, particularly the sustained success of any one motion picture, or an increase in effective marketing efforts of the major motion picture studios, may generate positive results for our business and operations in a specific fiscal quarter or year that may not necessarily be indicative of, or comparable to, future results of operations. As movie studios rely on a smaller number of higher grossing “tent pole” films there may be increased pressure for higher film licensing fees. Our loyalty program and
20
certain promotional pricing also may affect performance and increase the cost to license motion pictures relative to revenue for admission. In addition, a change in the type and breadth of movies offered by motion picture studios may adversely affect the demographic base of movie-goers.
Except to the extent that we own some film distribution rights in a small number of European territories, we have no control over distributors of the films and our business may be adversely affected if our access to motion pictures is limited or delayed.
We rely on distributors of motion pictures, over whom we have no control, for the films that we exhibit. Major motion picture distributors are required by law to offer and license film to exhibitors, including us, on a film-by-film and theatre-by-theatre basis. Consequently, we cannot assure ourselves of a supply of motion pictures by entering into long‑term arrangements with major distributors, but must compete for our licenses on a film-by-film and theatre-by-theatre basis. Our business depends on maintaining good relations with these distributors, as this affects our ability to negotiate commercially favorable licensing terms for first-run films or to obtain licenses at all. With only seven distributors representing approximately 90% of the U.S. box office in 2018, there is a high level of concentration in the industry. Our business may be adversely affected if our access to motion pictures is limited or delayed because of deterioration in our relationships with one or more distributors or for some other reason. To the extent that we are unable to license a popular film for exhibition in our theatres, our operating results may be adversely affected.
Our substantial debt could adversely affect our operations and prevent us from satisfying those debt obligations.
We have a significant amount of debt. As of December 31, 2018, we had outstanding approximately $5,283.3 million of indebtedness ($5,428.1 million face amount), which consisted of $1,326.3 million under our Senior Secured Credit Facility ($1,345.4 million face amount), $524.3 million of our existing Convertible Notes due 2024 ($600.0 million face amount), $2,620.5 million of our existing subordinated notes ($2,679.1 million face amount), $238.7 million of the 6.0% Senior Secured Notes due 2023 ($230.0 million face amount), a $1.3 million ($1.3 million face amount) promissory note, and $560.3 million of existing capital and financing lease obligations. As of December 31, 2018, we had $211.2 million available for borrowing under our Senior Secured Revolving Credit Facility and £73.9 million ($93.7 million) available for borrowing under our Odeon Revolving Credit Facility. As of December 31, 2018, we also had approximately $6.9 billion of undiscounted rental payments under operating leases (with initial base terms generally between 15 to 20 years). The amount of our indebtedness and lease and other financial obligations could have important consequences to our stockholders. For example, it could:
|
· |
increase our vulnerability to general adverse economic and industry conditions; |
|
· |
limit our ability to obtain additional financing in the future for working capital, capital expenditures, dividend payments, acquisitions, general corporate purposes or other purposes; |
|
· |
require us to dedicate a substantial portion of our cash flow from operations to the payment of lease rentals and principal and interest on our indebtedness, thereby reducing the funds available to us for operations, dividends and any future business opportunities; |
|
· |
limit our planning flexibility for, or ability to react to, changes in our business and the industry; and |
|
· |
place us at a competitive disadvantage with competitors who may have less indebtedness and other obligations or greater access to financing. |
If we fail to make any required payment under our Senior Secured Credit Facility or the indentures governing our notes or to comply with any of the financial and operating covenants contained therein, we would be in default. Lenders under our Senior Secured Credit Facility or holders of our notes, as applicable, could then decide to accelerate the maturity of the indebtedness under the Senior Secured Credit Facility or the indentures and in the case of the Senior Credit Facility, foreclose upon the stock and personal property of our subsidiaries that is pledged to secure the Senior Secured Credit Facility. Other creditors might then accelerate other indebtedness. If the lenders under the Senior Secured Credit Facility or holders of our notes accelerate the maturity of the indebtedness thereunder, we might not have sufficient assets to satisfy our obligations under the Senior Secured Credit Facility, the indentures, or our other indebtedness. Our indebtedness under our Senior Secured Credit Facility bears interest at rates that fluctuate with changes in certain prevailing interest rates (although, subject to certain conditions, such rates may be fixed for certain
21
periods). If interest rates increase, we may be unable to meet our debt service obligations under our Senior Secured Credit Facility and other indebtedness.
The agreements governing our indebtedness contain covenants that may limit our ability to take advantage of certain business opportunities advantageous to us.
The agreements governing our indebtedness contain various covenants that limit our ability to, among other things:
|
· |
incur or guarantee additional indebtedness; |
|
· |
pay dividends or make other distributions to our stockholders; |
|
· |
make restricted payments; |
|
· |
incur liens; |
|
· |
engage in transactions with affiliates; and |
|
· |
enter into business combinations. |
These restrictions could limit our ability to obtain future financing, make acquisitions, fund needed capital expenditures, withstand economic downturns in our business or the economy in general, conduct operations or otherwise take advantage of business opportunities that may arise.
At the same time, the covenants in the instruments governing our indebtedness may not provide investors with protections against transactions they may deem undesirable. Although the indentures governing our notes contain a fixed charge coverage test that limits our ability to incur indebtedness, this limitation is subject to a number of significant exceptions and qualifications. Moreover, the indentures do not impose any limitation on our incurrence of lease obligations or liabilities that are not considered “Indebtedness” under the indentures (such as operating leases), nor do they impose any limitation on the amount of liabilities incurred by subsidiaries, if any, that might be designated as “unrestricted subsidiaries,” which are subsidiaries that we designate, that are not subject to the restrictive covenants contained in the indentures governing our indebtedness.
Furthermore, there are no restrictions in the indentures on our ability to invest in other entities (including unaffiliated entities) and no restrictions on the ability of our subsidiaries to enter into agreements restricting their ability to pay dividends or otherwise transfer funds to us. Also, although the indentures limit our ability to make dividends and other restricted payments, these restrictions are subject to significant exceptions and qualifications.
If our cash flows prove inadequate to service our debt and provide for our other obligations, we may be required to refinance all or a portion of our existing debt or future debt at terms unfavorable to us.
Our ability to make payments on and refinance our debt and other financial obligations and to fund our capital expenditures and acquisitions will depend on our ability to generate substantial operating cash flow. This will depend on our future performance, which will be subject to prevailing economic conditions and to financial, business and other factors beyond our control.
In addition, our debt obligations require us to repay or refinance our obligations when they come due. If our cash flows were to prove inadequate to meet our debt service, rental and other obligations in the future, we may be required to refinance all or a portion of our existing or future debt, on or before maturity, to sell assets or to obtain additional financing. We cannot give assurance that we will be able to refinance any of our indebtedness, including our Senior Secured Credit Facility and our notes, sell any such assets, or obtain additional financing on commercially reasonable terms or at all.
The terms of the agreements governing our indebtedness restrict, but do not prohibit us from incurring additional indebtedness. If we are in compliance with the financial covenants set forth in the Senior Secured Credit
22
Facility and our other outstanding debt instruments, we may be able to incur substantial additional indebtedness. If we incur additional indebtedness, the related risks that we face may intensify.
Limitations on the availability of capital may prevent deployment of strategic initiatives.
Implementation of our key strategic initiatives, including recliner seating, enhanced food and beverage and premium sight and sound, require significant capital expenditures. Our gross capital expenditures were approximately $576.3 million, $628.8 million and $421.7 million for the years ended December 31, 2018, December 31, 2017 and, December 31, 2016, respectively. We estimate that our net cash outflows for capital expenditures will be approximately $450.0 million for the year ending December 31, 2019. The lack of available capital resources due to business performance or other financial commitments could prevent or delay the deployment of innovations in our theatres. We may have to seek additional financing or issue additional securities to fully implement our growth strategy. We cannot be certain that we will be able to obtain new financing on favorable terms, or at all. In addition, covenants under our existing indebtedness limit our ability to incur additional indebtedness, and the performance of any additional or improved theatres may not be sufficient to service the related indebtedness that we are permitted to incur.
We are subject, at times, to intense competition.
Our theatres are subject to varying degrees of competition in the geographic areas in which we operate. Competitors may be multi‑national circuits, national circuits, regional circuits or smaller independent exhibitors. Competition among theatre exhibition companies is often intense with respect to the following factors:
|
· |
Attracting patrons. The competition for patrons is dependent upon factors such as the availability of popular motion pictures, the location and number of theatres and screens in a market, the comfort and quality of the theatres and pricing. Many of our competitors have sought to increase the number of screens that they operate. Competitors have built or may be planning to build theatres in certain areas where we operate, which could result in excess capacity and increased competition for patrons. |
|
· |
Licensing motion pictures. We believe that the principal competitive factors with respect to film licensing include licensing terms, number of seats and screens available for a particular picture, revenue potential and the location and condition of an exhibitor’s theatres. |
|
· |
Theatre Locations. We must compete with exhibitors and others in our efforts to locate and acquire attractive new and existing sites for our theatres and when renewing leases on our existing theatres. There can be no assurance that we will be able to acquire such new sites or existing theatres at reasonable prices or on favorable terms. Moreover, some of these competitors may be stronger financially than we are. As a result of the foregoing, we may not succeed in acquiring theatres or may have to pay more than we would prefer to make an acquisition. |
The theatrical exhibition industry also faces competition from other forms of out-of-home entertainment, such as concerts, amusement parks and sporting events and from other distribution channels for filmed entertainment, such as cable television, pay-per-view, video streaming, and home video systems and from other forms of in-home entertainment.
An increase in the use of alternative film delivery methods or other forms of entertainment may drive down our attendance and limit our ticket prices.
We compete with other film delivery methods, including network, syndicated cable and satellite television and DVDs, as well as video-on-demand, pay-per-view services, video streaming and downloads via the Internet. We also compete for the public’s leisure time and disposable income with other forms of entertainment, including sporting events, amusement parks, live music concerts, live theatre and restaurants. An increase in the popularity of these alternative film delivery methods and other forms of entertainment could reduce attendance at our theatres, limit the prices we can charge for admission and materially adversely affect our business and results of operations.
23
Our results of operations may be impacted by shrinking theatrical exclusive release windows.
Over the last decade, the average theatrical exclusive release window, which represents the time that elapses from the date of a film’s theatrical release to the date a film is available to consumers in-home, has decreased from approximately six months to approximately three to four months. If patrons choose to wait for in-home viewing options rather than attend a theatre for viewing the film, it may adversely impact our business and results of operations, financial condition and cash flows. We cannot give assurance that this release window, which is determined by the film studios, will not shrink further or be eliminated altogether, which could have an adverse impact on our business and results of operations.
Our business is subject to international economic, political and other risks that could negatively affect our business, results of operations and financial condition.
As a result of the Odeon and Nordic Acquisitions, 26.5% of our revenues were derived from countries outside the United States for the year ended December 31, 2018. The success of our acquisitions of Odeon and Nordic is dependent upon our ability to operate a business in markets where we have limited experience and is subject to risks that are beyond our control. Accordingly, our business is subject to risks associated with doing business internationally, including:
|
· |
difficulties and costs of staffing and managing international operations among diverse geographies, languages and cultures; |
|
· |
the impact of regional or country-specific business cycles and economic instability; |
|
· |
the impact of the United Kingdom’s exit from the European Union and the potential that other countries could also exit; |
|
· |
fluctuations in foreign currency exchange rates which could lead to fluctuations in our reported results of operations or result in significant decreases in the value of our international investments as denominated in U.S. Dollars; |
|
· |
increased foreign interest rates, foreign exchange fees and other bank charges as a result of financing our foreign operations; |
|
· |
exposure to anti-corruption laws, including the Foreign Corrupt Practices Act (“FCPA”) and the U.K. Bribery Act (the “Bribery Act”), and export-control regulations and economic sanctions regulations, including those promulgated by the Office of Foreign Assets Control, United States Department of Treasury (“OFAC”); |
|
· |
exposure to local economic conditions and local laws and regulations; |
|
· |
exposure to local labor and employment laws; |
|
· |
relationships with local labor unions and works councils; |
|
· |
limited borrowing capabilities relating to activities in non‑U.S. countries; |
|
· |
economic and/or credit conditions abroad; |
|
· |
potential adverse changes in the political and/or economic stability of foreign countries or in their diplomatic relations with the United States; |
|
· |
restrictions on the withdrawal of foreign investment and earnings; |
|
· |
government policies against businesses owned by foreigners; |
24
|
· |
investment restrictions or requirements; |
|
· |
exposure to piracy laws and regulations, including the European Union GDPR; |
|
· |
diminished ability to legally enforce our contractual rights in foreign countries; |
|
· |
difficulty in protecting our brand, reputation and intellectual property; |
|
· |
restrictions on the ability to obtain or retain licenses required for operation; |
|
· |
foreign exchange restrictions; |
|
· |
adverse changes in regulatory or tax requirements; |
|
· |
restrictions on foreign ownership of subsidiaries; |
|
· |
data protection and privacy laws, including GDPR, which became effective in May 2018 and similar pending domestic laws such as the California Privacy Act, which becomes effective in 2020, and other restrictions on transferring personally identifiable information outside of a jurisdiction; and |
|
· |
tariffs and other trade barriers. |
If we are unable to manage the complexity of our global operations successfully, it could have a material adverse effect on our business, financial condition and results of operations.
The decision by British voters to exit the European Union may negatively impact our operations.
The U.K. is currently negotiating the terms of its exit from the European Union (“Brexit”) scheduled for March 29, 2019. In November 2018, the U.K. and the European Union agreed upon a draft Withdrawal Agreement that sets out the terms of the U.K.’s departure, including commitments on citizen rights after Brexit, a financial settlement from the U.K., and a transition period from March 29, 2019 through December 31, 2020 to allow time for a future trade deal to be agreed. On January 15, 2019, the draft Withdrawal Agreement was rejected by the U.K. Parliament creating significant uncertainty about the terms (and timing) under which the U.K. will leave the European Union. The U.K. Parliament voted on February 14, 2019 to reject the government’s Brexit negotiating strategy, increasing the likelihood of a no-deal Brexit.
Current uncertainty over whether the U.K. will ultimately leave the EU, as well as the final outcome of the negotiations between the U.K. and the EU, could have an adverse effect on our business and financial results. The long-term effects of Brexit will depend on the terms negotiated between the U.K. and the EU, which may take years to complete and may include, among other things, greater restrictions on imports and exports between the U.K. and EU countries, a fluctuation in currency exchange rates and additional regulatory complexity. Additional currency volatility could drive a weaker British pound, which increases the cost of goods imported into our U.K. operations and may decrease the profitability of our U.K. operations. A weaker British pound versus the U.S. dollar also causes local currency results of our U.K. operations to be translated into fewer U.S. dollars during a reporting period and currency volatility makes this translation less predictable. Our operations in the U.K. and Europe, as well as our United States operations, could be impacted by the global economic uncertainty caused by Brexit or the actual withdrawal by the U.K. from the EU. If we are unable to manage any of these risks effectively, our business could be adversely affected. With a range of outcomes still possible, the impact from Brexit remains uncertain and will depend, in part, on the final outcome of tariff, trade, regulatory and other negotiations.
We may not achieve the expected benefits and performance from our recent acquisitions.
As a result of our recent acquisitions of Carmike, Odeon, and Nordic, we expect to achieve certain synergies and cost savings through, for example, reducing general and administrative expenses by combining operating functions such as accounting, finance and technology, achieving purchasing efficiencies and achieving revenue enhancements resulting from the acquisitions. However, there can be no assurance that we will be able to generate sufficient cash flow from these acquisitions to service the indebtedness incurred to finance such acquisitions or realize any other anticipated
25
benefits. Nor can there be any assurance that our profitability will be improved by these or any future acquisitions. Although we have a long history of successfully integrating acquisitions, any acquisition involves risks, such as:
|
· |
the difficulty of assimilating and integrating the acquired operations and personnel into our current business; |
|
· |
the potential disruption of our ongoing business; |
|
· |
the diversion of management’s attention and other resources; |
|
· |
the possible inability of management to maintain uniform standards, controls, procedures and policies; |
|
· |
the risks of entering markets in which we have little or no experience; |
|
· |
the potential impairment of relationships with employees; |
|
· |
unexpected costs, charges or expenses; |
|
· |
our effective implementation and customer acceptance of our marketing strategy, including our loyalty programs; |
|
· |
the possibility that any liabilities we may incur or assume may prove to be more burdensome than anticipated; and |
|
· |
the possibility that the acquired theatres do not perform as expected. |
Optimizing our theatre circuit through new construction and the transformation of our existing theatres may be subject to delay and unanticipated costs.
The availability of attractive site locations for new construction is subject to various factors that are beyond our control. These factors include:
|
· |
local conditions, such as scarcity of space or increase in demand for real estate, demographic changes and changes in zoning and tax laws; and |
|
· |
competition for site locations from both theatre companies and other businesses. |
We typically require 18 to 24 months in the United States from the time we reach an agreement with a landlord to when a theatre opens. This timeframe may vary as we introduce this concept in international markets.
In addition, the improvement of our existing theatres through our enhanced food and beverage and recliner seating and premium sight and sound initiatives is subject to substantial risks, such as difficulty in obtaining permits, landlord approvals and operating licenses (e.g. liquor licenses). We may also experience cost overruns from delays or other unanticipated costs in both new construction and facility improvements. Furthermore, our new sites and transformed locations may not perform to our expectations.
We rely on our information systems to conduct our business, and any failure to protect these systems against security breaches or failure of these systems themselves could adversely affect our business, results of operations and liquidity and could result in litigation and penalties. Additionally, if these systems fail or become unavailable for any significant period of time, our business could be harmed.
The efficient operation of our business is dependent on computer hardware and software systems. Among other things, these systems collect and store certain personal information from customers, vendors and employees and process customer payment information. Additionally, open-source internet ticketing allows tickets for all of our theatres to be sold by various third-party vendors on websites using information systems we do not control. Our information systems and those maintained by our third-party vendors and the sensitive data they are designed to protect are vulnerable to security breaches by computer hackers, cyber terrorists and other cyber attackers. We rely on industry-accepted security
26
measures and technology to securely maintain confidential and proprietary information maintained on our information systems, and we rely on our third-party vendors to take appropriate measures to protect the confidentiality of the information on those information systems. However, these measures and technology may not adequately prevent security breaches. Our information systems may become unavailable or fail to perform as anticipated for any reason, including viruses, loss of power or human error. Any significant interruption or failure of our information systems or those maintained by our third-party vendors or any significant breach of security could adversely affect our reputation with our customers, vendors and employees and could adversely affect our business, results of operations and liquidity and could result in litigation against us or the imposition of penalties. A significant interruption, failure or breach of the security of our information systems or those of our third-party vendors could also require us to expend significant resources to upgrade the security measures and technology that guard sensitive data against computer hackers, cyber terrorists and other cyber attackers. We maintain cyber risk insurance coverage to protect against such risks, however, there can be no assurance that such coverage will be adequate.
We may incur future impairment charges to goodwill or long-lived assets and future theatre and other closure charges.
We review long‑lived assets, including goodwill, indefinite-lived intangible assets and other intangible assets, marketable securities and non‑consolidated entities for impairment annually and whenever events or changes in circumstances indicate that the carrying amount of the assets may not be fully recoverable. The review for goodwill compares the fair value for each of our reporting units to its associated carrying value, including goodwill. Factors that could lead to impairment of goodwill and intangible assets include adverse industry or economic trends, reduced estimates of future cash flows, and declines in the market price of our common stock. Our valuation methodology for assessing impairment requires management to make judgments and assumptions based on historical experience and projections of future operating performance. We may be required to record future charges to earnings during the period in which an impairment of goodwill or intangible assets is determined to exist. During the years ended December 31, 2018, December 31, 2017, and December 31, 2016, we recorded impairment charges which were related to property, net of $13.8 million, $43.6 million, and $5.5 million, respectively. During 2018, we impaired 13 theatres in the U.S. markets with 150 screens (in Alabama, Arkansas, California, Colorado, Georgia, Iowa, Kentucky, Michigan, North Dakota, Ohio, Pennsylvania, Tennessee, and Wyoming) and we impaired 15 theatres in the International markets with 118 screens (in Italy, Spain, and United Kingdom).
We have a significant amount of goodwill on our balance sheet as a result of acquisitions. As of December 31, 2018, goodwill recorded on our consolidated balance sheet totaled $4,788.7 million. We performed our annual goodwill impairment test as of October 1, 2018. Based on the results of these tests, we determined that the goodwill recorded on our consolidated balance sheet was not impaired. However, if the market price of our common stock further declines from current levels, or if other events or circumstances change that would more likely than not reduce the fair value of our reporting units below their respective carrying value, all or a portion of our goodwill may be impaired in future periods. Examples of such adverse events or circumstances that could change include (i) an adverse change in macroeconomic conditions; (ii) increased cost factors that have a negative effect on our earnings and cash flows; (iii) negative or overall declining financial performance compared with our actual and projected results of relevant prior periods; and (iv) a sustained decrease in our share price. Any impairment charges that we may take in the future could be material to our results of operations and financial condition and could adversely affect our stock price.
The opening of new theatres by us and certain of our competitors has drawn audiences away from some of our older theatres. In addition, demographic changes and competitive pressures have caused some of our theatres to become unprofitable. Since not all theatres are appropriate for our new initiatives, we may have to close certain theatres or recognize impairment losses related to the decrease in value of particular theatres. Deterioration in the performance of our theatres could require us to recognize additional impairment losses and close additional theatres, which could have an adverse effect on the results of our operations. We continually monitor the performance of our theatres, and factors such as changing consumer preferences and our inability to sublease vacant retail space could negatively impact operating results and result in future closures, sales, dispositions and significant theatre and other closure charges prior to expiration of underlying lease agreements.
27
We may be limited in our ability to utilize, or may not be able to utilize, net operating loss carryforwards to reduce our future tax liability.
As of December 31, 2018, we had an estimated federal income tax loss carryforward of $212.8 million and estimated state income tax loss carryforward of $243.5 million which will be limited annually due to certain change in ownership provisions of the Internal Revenue Code, as amended (“IRC”), Section 382. The federal tax loss carryforwards prior to January 1, 2019 will begin to expire in 2019 and will completely expire in 2036. Any federal tax loss carryforwards generated after January 1, 2018 will be available to be used indefinitely. Our state loss carryforwards may be used over various periods ranging from 1 to 20 years. As of December 31, 2018, we had estimated foreign income tax loss carryforwards of $652.6 million. Our foreign tax loss carryforwards are available to be used indefinitely, except approximately $6.8 million which will expire in various periods ranging from 1 to 20 years. The tax loss carryforwards are reflected in our balance sheet as an asset valued at our current effective rate and reduced by the valuation allowance.
We have experienced numerous “ownership changes” within the meaning of Section 382(g) of the IRC, including our merger with Wanda. These ownership changes have and will continue to subject our tax loss carryforwards to annual limitations which will restrict our ability to use them to offset our taxable income in periods following the ownership changes. In general, the annual use limitation equals the aggregate value of our equity at the time of the ownership change multiplied by a specified tax‑exempt interest rate. Carmike also has experienced numerous “ownership changes” within the meaning of Section 382(g). These ownership changes have and will continue to subject losses acquired with the transaction to annual limitations which will restrict our ability to use them to offset our taxable income in periods following the ownership changes.
We are subject to complex taxation, changes in tax rates, adoption of new United States or international tax legislation and disagreements with tax authorities that could adversely affect our business, financial condition or results of operations.
We are subject to many different forms of taxation in both the United States and in foreign jurisdictions where we operate. Current economic and political conditions, including Brexit, make tax rates and policy in any jurisdiction, including the U.S., U.K. and E.U., subject to significant change. Recent examples include the Organization for Economic Co‑operation and Development’s (“OECD”) recommendations on Base Erosion and Profit Shifting (“BEPS”), the European Commission’s Anti‑Tax Avoidance Package, and the U.S. Tax Cuts and Jobs Act signed into law in December 2017. The costs of compliance with these laws and regulations are high and are likely to increase in the future. Any failure on our part to comply with these laws and regulations can result in negative publicity and diversion of management time and effort and may subject us to significant liabilities and other penalties.
The value of our deferred tax assets may not be realizable to the extent our future profits are less than we have projected and we may be required to record valuation allowances against previously-recorded deferred tax assets, which may have a material adverse effect on our results of operations and our financial condition.
Our income tax expense includes deferred income taxes arising from changes in temporary differences between the financial reporting and tax bases of assets and liabilities, credit carry-forwards and net operating losses. We evaluate the realizability of our deferred income tax assets and assess the need for a valuation allowance on an ongoing basis. In evaluating our deferred income tax assets, we consider whether it is more likely than not that the deferred income tax assets will be realized. The ultimate realization of our deferred income tax assets depends upon generating sufficient future taxable income during the periods in which our temporary differences become deductible and before our credit carry-forwards and net operating losses expire. Our assessment of the realizability of our deferred income tax assets requires significant judgment. If we fail to achieve our projections or if we need to lower our projections, we may not have sufficient evidence of our ability to realize our deferred tax assets, and we may need to increase our valuation allowance. Our U.S. cumulative pretax losses have raised uncertainty about the likelihood of realizing our deferred tax assets, along with the change in U.S. Federal enacted tax rates, and as a result we have recorded a valuation allowance against all of the U.S. deferred tax assets and liabilities, except those deemed indefinite-lived for the year ended December 31, 2017. For the year ended December 31, 2018, our cumulative pretax losses continue to raise uncertainty about the likelihood of realizing our deferred tax assets. A valuation adjustment to our income tax provision of approximately $39.0 million in our U.S. markets was recorded during 2018. For our U.S. markets, a total income tax provision of $16.1 million was recorded for the year ended December 31, 2018. There are no assurances that we will not increase or decrease the valuation allowances in future periods against deferred tax assets and liabilities. Any increase in
28
the valuation allowance would result in additional deferred tax expense; likewise, any decrease would result in additional deferred tax benefit. Any deferred tax expense could have a material adverse effect on our results of operations and financial condition.
The accounting methods for our convertible debt securities may have a material effect on our reported financial results.
In accounting for Convertible Notes due 2024, we identified certain features that are bifurcated and accounted for as derivatives, Under the applicable accounting guidance, the derivatives must be marked to market each reporting period. The fluctuation in the fair value between reporting periods is recorded in that period and impacts net earnings. These changes in the fair value will create volatility in our net earnings. Additionally, we recorded a debt discount based on the fair value of the derivative liability related to the conversion feature upon issuance, which will be accreted to interest expense over the term of the agreement. This will impact non-cash interest expense in the current period presented and future periods.
In addition, convertible debt instruments (such as the Convertible Notes due 2024) that may be settled in cash, shares or a combination of cash and shares may utilize the if-converted method which we have elected to use to compute earnings per share, the effect of which is that the shares issuable upon conversion of the notes are included in the calculation of diluted earnings per share to the extent that they are dilutive. Under the if-converted method the number of shares of common stock that would be necessary to settle all of the Convertible Notes due 2024 are included in diluted earnings per share. This may cause further volatility in our diluted earnings per share.
We may be reviewed by antitrust authorities.
Given our size and market share, pursuit of acquisition opportunities that would increase the number of our theatres in markets where we have a leading market share would likely result in significant review by antitrust regulators in the applicable jurisdictions, and we may be required to dispose of theatres in order to complete such acquisition opportunities. As a result, we may not be able to succeed in acquiring other exhibition companies or we may have to dispose of a significant number of theatres in key markets in order to complete such acquisitions.
We operate in a consolidating industry that is scrutinized from time to time for compliance with antitrust and competition laws, including currently dormant investigations into film clearances and joint ventures among competing exhibitors. If we were found to have violated antitrust laws, it could have a material adverse effect on our operations and financial condition.
We are subject to substantial government regulation, which could entail significant cost.
We are subject to various federal, state and local laws, regulations and administrative practices both domestically and internationally affecting our business, and we must comply with provisions regulating antitrust, health and sanitation standards, equal employment, environmental, data protection and licensing for the sale of food and, in some theatres, alcoholic beverages. Our new theatre openings could be delayed or prevented or our existing theatres could be impacted by difficulties or failures in our ability to obtain or maintain required approvals or licenses. Changes in existing laws or implementation of new laws, regulations and practices could have a significant impact on our business. A significant portion of our theatre level employees are part time workers who are paid at or near the applicable minimum wage in the theatre’s jurisdiction. Increases in the minimum wage and implementation of reforms requiring the provision of additional benefits will increase our labor costs.
We own and operate facilities throughout the United States and various international markets throughout Europe and are subject to the environmental laws and regulations of those jurisdictions, particularly laws governing the cleanup of hazardous materials and the management of properties. We might in the future be required to participate in the cleanup of a property that we own or lease, or at which we have been alleged to have disposed of hazardous materials from one of our facilities. In certain circumstances, we might be solely responsible for any such liability under environmental laws, and such claims could be material.
In the U.S., our theatres must comply with Title III of the Americans with Disabilities Act of 1990 (“ADA”). Compliance with the ADA requires that public accommodations, including websites and mobile apps for such public accommodations, “reasonably accommodate” individuals with disabilities and that new construction or alterations made
29
to “commercial facilities” conform to accessibility guidelines unless “structurally impracticable” for new construction or technically infeasible for alterations. Non‑compliance with the ADA could result in the imposition of injunctive relief, fines, and an award of damages to private litigants or additional capital expenditures to remedy such noncompliance, any of which could have a material adverse effect on our operations and financial condition. In Europe, all territories have similar national regulations relating to disabilities that our theatres operate in accordance with. Noncompliance with these regulations could carry financial, operational and reputation risks.
We have had significant financial losses in previous years.
Prior to fiscal 2007, we had reported net losses in each of the prior nine fiscal years totaling approximately $551.1 million. For fiscal 2007, 2008, 2009, 2010, 2011, 2012, the period March 30, 2012 through August 30, 2012, the period August 31, 2012 through December 31, 2012, the year ended 2013, the year ended 2014, the year ended 2015, the year ended 2016, the year ended 2017, and the year ended 2018, we reported net earnings (losses) of $116.9 million, $(6.2) million, $(149.0) million, $79.9 million, $(174.3) million, $(94.1) million, $90.2 million, $(42.7) million, $364.4 million, $64.1 million, $103.9 million, $111.7 million, $(487.2) million, and $110.1 million, respectively. If we experience poor financial results in the future, we may be unable to meet our payment obligations while attempting to expand our theatre circuit and withstand competitive pressures or adverse economic conditions.
General political, social and economic conditions can reduce our attendance.
Our success depends on general political, social and economic conditions and the willingness of consumers to spend money at movie theatres. If going to motion pictures becomes less popular or consumers spend less on food and beverage, which accounted for 30.6% of our revenues in calendar 2018, our operations could be adversely affected. In addition, our operations could be adversely affected if consumers’ discretionary income falls as a result of an economic downturn. Geopolitical events, including the threat of terrorism or cyber‑attacks, could cause people to avoid our theatres or other public places where large crowds are in attendance. In addition, due to our concentration in certain markets, natural disasters such as hurricanes or earthquakes in those markets could adversely affect our overall results of operations.
We depend on key personnel for our current and future performance.
Our current and future performance depends to a significant degree upon the retention of our senior management team and other key personnel. The loss or unavailability of any member of our senior management team or a key employee could have a material adverse effect on our business, financial condition and results of operations. We cannot give assurance that we would be able to locate or employ qualified replacements for senior management or key employees on acceptable terms.
Our controlling shareholder owns more than 75% of the combined voting power of our common stock and has significant influence over our corporate management and affairs.
Our Class B common stock has three votes per share, and our Class A common stock, which is the publicly traded stock, has one vote per share. As of December 31, 2018, Wanda owns 51,769,784 shares of Class B common stock, or 50.01% of our outstanding common stock, representing approximately 75.01% of the voting power of our outstanding common stock. As such, Wanda has significant influence over our reporting and corporate management and affairs, and, because of the three-to-one voting ratio between our Class B and Class A common stock, Wanda will continue to control a majority of the combined voting power of our common stock and therefore be able to control all matters submitted to our stockholders for approval (including election of directors and approval of significant corporate transactions, such as mergers) so long as the shares of Class B common stock owned by Wanda and its permitted transferees represent at least 30% of all outstanding shares of our Class A and Class B common stock. The shares of our Class B common stock automatically convert to shares of Class A common stock upon Wanda and its permitted transferees holding less than 30% of all outstanding shares of our Class A and Class B common stock.
30
We may not generate sufficient cash flows or have sufficient restricted payment capacity under our Senior Secured Credit Facility or the indentures governing our debt securities to pay our intended dividends on our Class A common stock.
Subject to legally available funds, we intend to pay quarterly cash dividends. We will only be able to pay dividends from our available cash on hand and funds received from our subsidiaries. Our subsidiaries' ability to make distributions to us will depend on their ability to generate substantial operating cash flow. Our ability to pay dividends to our stockholders is subject to the terms of our Senior Secured Credit Facility and the indentures governing our outstanding notes. Our operating cash flow and ability to comply with restricted payment covenants in our debt instruments will depend on our future performance, which will be subject to prevailing economic conditions and to financial, business and other factors beyond our control. In addition, dividend payments are not mandatory or guaranteed, and our board of directors may decrease the level of dividends or entirely discontinue the payment of dividends. We may not pay dividends as a result of the following additional factors, among others:
|
· |
we are not legally or contractually required to pay dividends; |
|
· |
while we currently intend to pay a regular quarterly dividend, this policy could be modified or revoked at any time; |
|
· |
even if we do not modify or revoke our dividend policy, the actual amount of dividends distributed and the decision to make any distribution is entirely at the discretion of our board of directors and future dividends, if any, will depend on, among other things, our results of operations, cash requirements, financial condition, business opportunities, provisions of applicable law and other factors that our board of directors may deem relevant; |
|
· |
the amount of dividends distributed is and will be subject to contractual restrictions under the restrictive payment covenants contained in: |
|
· |
the indentures governing our debt securities, |
|
· |
the terms of our Senior Secured Credit Facility, |
|
· |
the terms of our Convertible Notes due 2024, |
|
· |
the terms of any other outstanding or future indebtedness incurred by us or any of our subsidiaries; and |
|
· |
the amount of dividends distributed is subject to state law restrictions. |
The maximum amount we would be permitted to distribute in accordance with our Senior Secured Credit Facility and the indentures governing our notes was approximately $2.5 billion as of December 31, 2018. As a result of the foregoing limitations on our ability to make distributions, we cannot give assurance that we will be able to make all of our intended quarterly dividend payments.
There may be future dilution of our Class A common stock, which could adversely affect the market price of shares of our Class A common stock.
In the future, we may issue additional shares of Class A common stock to raise cash to refinance indebtedness, for working capital, to finance strategic initiatives and future acquisitions or for other purposes. We may also acquire interests in other companies by using a combination of cash and shares of Class A common stock or just shares of Class A common stock. We may also issue securities convertible into, or exchangeable for, or that represent the right to receive, shares of Class A common stock. Any of these events may dilute the ownership interests of current stockholders, reduce our earnings per share or have an adverse effect on the price of our shares of Class A common stock. In addition, the conversion of some or all of our Convertible Notes due 2024, to the extent we deliver shares of Class A common stock upon conversion thereof, would dilute the ownership interests of current stockholders, reduce our earnings per share and potentially have an adverse effect on the price of our shares of Class A common stock.
31
Future sales of our Class A common stock in the public market could adversely affect the market price of our Class A common stock.
We cannot predict the effect, if any, that market sales of shares of our Class A common stock or the availability of shares of our Class A common stock for sale will have on the prevailing market price of our Class A common stock. Sales of a substantial number of shares of our Class A common stock in the public market, or the perception that these sales may occur, could reduce the market price of our shares of Class A common stock.
Wanda holds shares of our Class B common stock, all of which constitute "restricted securities" under the Securities Act. The shares of our Class B common stock automatically convert to Class A common stock (1) if transferred to a person other than certain permitted transferees or (2) upon Wanda and its permitted transferees holding less than 30% of all outstanding shares of our Class A and Class B common stock. Provided the holders comply with the applicable volume limits and other conditions prescribed in Rule 144 under the Securities Act, all of these restricted securities are currently freely tradeable. Pursuant to a registration rights agreement dated December 23, 2013, we have agreed to use our best efforts to effect registered offerings upon request from Wanda and to grant incidental or "piggyback" registration rights with respect to any registrable securities held by Wanda. The obligation to effect any demand for registration by Wanda will be subject to certain conditions, including limitations on the number of demand registrations and limitations on the minimum value of securities to be registered. We have also agreed to use our best efforts to grant certain incidental or "piggyback" registration rights with respect to securities issued to certain current and former officers. In connection with the sale of our Convertible Notes due 2024, we have agreed, subject to certain conditions, to use our reasonable efforts to effect registered offerings on behalf of holders of the Convertible Notes due 2024 with respect to the securities held by them and the shares of Class A common stock issuable upon conversion thereof. We filed a registration statement with the SEC on December 14, 2018 to fulfill this requirement. The exercise of such registration rights by Wanda, the holders of the Convertible Notes due 2024 and/or the current and former officers may substantially increase the number of shares of Class A common stock in the public market and could reduce the market price of shares of our Class A common stock.
We have elected to take advantage of the "controlled company" exemption to the corporate governance rules for publicly-listed companies, which could make our Class A common stock less attractive to some investors or otherwise harm our stock price.
Because we qualify as a "controlled company" under the corporate governance rules for publicly-listed companies, we are not required to have a majority of our board of directors be independent, nor are we required to have a compensation committee or an independent nominating function. In light of our status as a controlled company, our board of directors has determined not to have a majority of our board of directors be independent, have a compensation committee composed solely of independent directors or have an independent nominating function and has chosen to have the full board of directors be directly responsible for nominating members of our board. Accordingly, should the interests of Wanda, as our controlling stockholder, differ from those of other stockholders, the other stockholders may not have the same protections afforded to stockholders of companies that are subject to all of the corporate governance rules for publicly-listed companies. Our status as a controlled company could make our Class A common stock less attractive to some investors or otherwise harm our stock price.
The super voting rights of our Class B common stock and other anti-takeover protections in our amended and restated certificate of incorporation and our amended and restated bylaws may discourage or prevent a takeover of our Company, even if an acquisition would be beneficial to our stockholders.
Provisions contained in our amended and restated certificate of incorporation and amended and restated bylaws, as amended, as well as provisions of the Delaware General Corporation Law and the supermajority rights of our Class B common stockholder, could delay or make it more difficult to remove incumbent directors or for a third-party to acquire us, even if a takeover would benefit our stockholders. These provisions include:
|
· |
a dual class common stock structure, which provides Wanda with the ability to control the outcome of matters requiring stockholder approval, even if they own significantly less than a majority of the shares of our outstanding Class A and Class B common stock; |
|
· |
a classified board of directors; |
32
|
· |
the sole power of a majority of the board of directors to fix the number of directors; |
|
· |
limitations on the removal of directors; |
|
· |
the sole power of the board of directors to fill any vacancy on the board of directors, whether such vacancy occurs as a result of an increase in the number of directors or otherwise; |
|
· |
the ability of our board of directors to designate one or more series of preferred stock and issue shares of preferred stock without stockholder approval; and |
|
· |
the inability of stockholders to call special meetings. |
Our issuance of shares of preferred stock could delay or prevent a change of control of our company. Our board of directors has the authority to cause us to issue, without any further vote or action by the stockholders, up to 50,000,000 shares of preferred stock, par value $0.01 per share, in one or more series, to designate the number of shares constituting any series, and to fix the rights, preferences, privileges and restrictions thereof, including dividend rights, voting rights, rights and terms of redemption, redemption price or prices and liquidation preferences of such series. The issuance of shares of preferred stock may have the effect of delaying, deferring or preventing a change in control of our company without further action by the stockholders, even where stockholders are offered a premium for their shares.
Our incorporation under Delaware law, the ability of our board of directors to create and issue a new series of preferred stock or a stockholder rights plan and certain other provisions of our amended and restated certificate of incorporation and amended and restated bylaws, as amended, could impede a merger, takeover or other business combination involving our company or the replacement of our management or discourage a potential investor from making a tender offer for our Class A common stock, which, under certain circumstances, could reduce the market value of our Class A common stock.
Our issuance of preferred stock could dilute the voting power of the common stockholders and adversely affect the market value of our Class A common stock.
The issuance of shares of preferred stock with voting rights may adversely affect the voting power of the holders of our other classes of voting stock either by diluting the voting power of our other classes of voting stock if they vote together as a single class, or by giving the holders of any such preferred stock the right to block an action on which they have a separate class vote even if the action were approved by the holders of our other classes of voting stock.
In addition, the issuance of shares of preferred stock with dividend or conversion rights, liquidation preferences or other economic terms favorable to the holders of preferred stock could adversely affect the market price for our Class A common stock by making an investment in the common stock less attractive. For example, investors may not wish to purchase Class A common stock at a price above the conversion price of a series of convertible preferred stock because the holders of the preferred stock would effectively be entitled to purchase Class A common stock at the lower conversion price causing economic dilution to the holders of Class A common stock.
The elimination of the calculation of USD LIBOR rates may impact our contracts that are indexed to USD LIBOR.
In July 2017, the Financial Conduct Authority (the authority that regulates LIBOR) announced it intends to stop compelling banks to submit rates for the calculation of LIBOR after 2021. The Alternative Reference Rates Committee ("ARRC") has proposed that the Secured Overnight Financing Rate ("SOFR") is the rate that represents best practice as the alternative to USD-LIBOR for use in derivatives and other financial contracts that are currently indexed to USD-LIBOR. ARRC has proposed a paced market transition plan to SOFR from USD-LIBOR and organizations are currently working on industry wide and company specific transition plans as it relates to derivatives and cash markets exposed to USD-LIBOR. The Company has material contracts that are indexed to USD-LIBOR and is monitoring this activity and evaluating the related risks.
Item 1B. Unresolved Staff Comments.
None.
33
The following table sets forth the general character and ownership classification of our theatre circuit, excluding non-consolidated joint ventures and managed theatres, as of December 31, 2018:
|
Property Holding Classification |
|
Theatres |
|
Screens |
|
|
Owned |
|
60 |
|
532 |
|
|
Leased pursuant to ground leases |
|
17 |
|
181 |
|
|
Leased pursuant to building leases |
|
864 |
|
10,055 |
|
|
Total |
|
941 |
|
10,768 |
|
Our theatre leases generally have initial terms ranging from 12 to 20 years, with options to extend the lease for up to 20 additional years. The leases typically require escalating minimum annual rent payments and additional rent payments based on a percentage of the leased theatre’s revenue above a base amount and require us to pay for property taxes, maintenance, insurance and certain other property-related expenses. In some instances, our escalating minimum annual rent payments are contingent upon increases in the consumer price index. In some cases, our rights as tenant are subject and subordinate to the mortgage loans of lenders to our lessors, so that if a mortgage were to be foreclosed, we could lose our lease. Historically, this has never occurred.
We lease our corporate headquarters in Leawood, Kansas. We believe our facilities are currently adequate for our operations.
Currently, the majority of the food and beverage, seating and other equipment required for each of our theatres are owned. The majority of our digital projection equipment is leased from DCIP.
All obligations under the Senior Secured Credit Facility, and the guarantees of those obligations (as well as cash management obligations), are secured by substantially all of AMC’s assets as well as those of each subsidiary guarantor.
Please refer to Narrative Description of Business under Part I, Item 1 of this Annual Report on Form 10-K for the geographic locations of our Theatrical Exhibition circuit as of December 31, 2018. See Note 4 – Property in the Notes to the Consolidated Financial Statements under Part II, Item 8 hereof.
The information required to be furnished by us under this Part I, Item 3 (Legal Proceedings) is incorporated by reference to the information contained in Note 13 – Commitments and Contingencies to the Consolidated Financial Statements included in Part II, Item 8 on this Annual Report on Form 10-K.
Item 4. Mine Safety Disclosures.
Not applicable.
34
Item 5. Market for Registrant’s Common Equity, Related Stockholder Matters and Issuer Purchases of Equity Securities.
Market Information
Our common equity consists of Class A and Class B common stock. Our Class A common stock has traded on the New York Stock Exchange since December 18, 2013 under the symbol “AMC.” There is no established public trading market for our Class B common stock.
Holders of Common Stock
On February 22, 2019, there were 36 stockholders of record of our Class A common stock and one stockholder of record of our Class B common stock.
Temporary Equity: Certain members of management have the right to require Holdings to purchase the Class A common stock held by them under certain limited circumstances pursuant to the terms of a stockholders agreement. Beginning on January 1, 2016 and ending on January 1, 2019 (or upon the termination of a management stockholders employment by us without cause, by the management stockholder for good reason, or due to the management stockholders death or disability), management shareholders will have the right, in limited circumstances, to require Holdings to purchase shares that are not fully and freely tradeable at a price equal to the price per share paid by such management shareholder with appropriate adjustments for any subsequent events such as dividends, splits, or combinations. The shares of Class A common stock subject to the stockholder agreement are classified as temporary equity, apart from permanent equity, as a result of the contingent redemption feature contained in the stockholder agreement.
During the year ended December 31, 2018, one employee, and one former employee who held 37,105 shares relinquished their put rights, therefore the related share amount of $0.4 million was reclassified to additional paid in capital, a component of stockholders’ equity. During the year ended December 31, 2017, a former employee who held 27,197 shares, relinquished his put right, therefore the related share amount of $0.3 million was reclassified to additional paid-in capital, a component of stockholders’ equity. During the year ended December 31, 2016, a former employee who held 27,197 shares, relinquished his put right, therefore the related share amount of $0.2 million was reclassified to additional paid-in capital, a component of stockholders’ equity.
Dividend Policy
Subject to legally available funds, we intend to pay a quarterly cash dividend at an annual rate initially equal to approximately $0.80 per share (or a quarterly rate initially equal to approximately $0.20 per share) of Holdings’ Class A and Class B common stock. The payment of future dividends is subject to our Board of Directors’ discretion and dependent on many considerations, including limitations imposed by covenants in the agreements governing our indebtedness, operating results, capital requirements, strategic considerations and other factors.
We will only be able to pay dividends from our available cash on hand and funds received from our subsidiaries. Their ability to make any payments to us will depend upon many factors, including our operating results, cash flows and the terms of the Senior Secured Credit Facility and the indentures governing our debt securities. Our ability to pay dividends to our stockholders will also be subject to the terms of the indebtedness. The declaration and payment of any future dividends will be at the sole discretion of our board of directors after taking into account various factors, including legal requirements, our subsidiaries’ ability to make payments to us, our financial condition, operating results, cash flow from operating activities, available cash and current and anticipated cash needs. We do not intend to borrow funds to pay the quarterly dividend described above. See the Liquidity and Capital Resources section of Item 7 of Part II hereof for further information regarding the dividend restrictions.
Securities Authorized for Issuance Under Equity Compensation Plans
See Item 12. of Part III of this Annual Report on Form 10-K.
35
Unregistered Sales of Equity Securities and Use of Proceeds
Sale of Unregistered Securities
None.
Issuer Purchase of Equity Securities
The following table provides information with respect to Common Stock purchases by the Company during the fourth fiscal quarter of 2018:
|
|
|
Purchases of Equity Securities |
||||||||
|
|
|
|
|
|
|
|
|
|
Approximate Dollar |
|
|
|
|
|
|
|
|
|
Total Number of |
|
Value of Shares that |
|
|
|
|
|
|
|
|
|
Shares Purchased as |
|
May Yet Be |
|
|
|
|
|
|
|
|
|
Part of Publicly |
|
Purchased Under the |
|
|
|
|
Total Number of |
|
Average Price Paid |
|
Announced Plans or |
|
Plans or Program (a) |
||
|
Period |
|
Shares Purchased |
|
Per Share |
|
Programs (a) |
|
(in millions) |
||
|
October 1, 2018 through October 31, 2018 |
|
— |
|
$ |
— |
|
— |
|
$ |
44.3 |
|
November 1, 2018 through November 30, 2018 |
|
— |
|
$ |
— |
|
— |
|
$ |
44.3 |
|
December 1, 2018 through December 31, 2018 |
|
— |
|
$ |
— |
|
— |
|
$ |
44.3 |
|
Total |
|
— |
|
|
|
|
— |
|
|
|
|
(a) |
As announced on August 3, 2017, our Board of Directors authorized a share repurchase program for an aggregate purchase of up to $100.0 million of our common stock, excluding transaction costs. As of December 31, 2018, $44.3 million remained available for repurchase under this plan. A two-year time limit has been set for the completion of this program, expiring August 2, 2019. |
Performance Graph
The following stock price performance graph should not be deemed incorporated by reference by any general statement incorporating by reference this Annual Report on Form 10-K into any filing under the Exchange Act or the Securities Act of 1933, as amended, except to the extent that we specifically incorporate this information by reference and shall not otherwise be deemed filed under such acts.
The following stock performance graph compares, for the period December 31, 2013 through December 31, 2018, the cumulative total stockholder returns for AMC’s common stock, the Standard & Poor’s Corporation Composite 500 Index and a self-determined peer group consisting of Cinemark Holdings, Inc. (CNK) and IMAX Corporation (IMAX) (“2018 Peer Group”). Prior to 2018 this peer group included Regal Entertainment Group (“Regal”) (“2017 Peer Group”). Regal was acquired in 2018 and is no longer a publicly traded company. With the loss of Regal as a publicly traded company in our peer group, we determined to add IMAX Corporation (IMAX) to our peer group in 2018. Measurement points are the last trading day for each month ended December 31, 2013 through December 31, 2018. The graph assumes that $100.00 was invested on December 31, 2013 in our common stock and in our peer group and in the Standard & Poor’s Corporation Composite 500 Index and assumes reinvestment of any dividends.
36
The stock price performance below is not necessarily indicative of future stock price performance.
COMPARISON OF 5 YEAR CUMULATIVE TOTAL RETURN*
Among AMC Entertainment Holdings, Inc., the S&P 500 Index, and a 2017 Peer Group and 2018 Peer Group
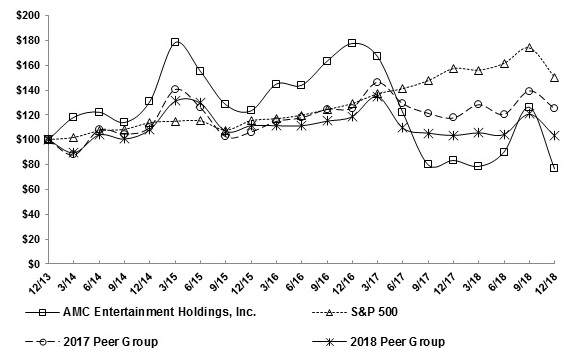
*$100 invested on December 31, 2013 in stock or in index, including reinvestment of dividends.
Fiscal year ended December 31.
Copyright© 2019 Standard & Poor's, a division of S&P Global. All rights reserved.
|
|
|
12/13 |
|
3/14 |
|
6/14 |
|
9/14 |
|
12/14 |
|
AMC Entertainment Holdings, Inc. |
|
100.00 |
|
118.00 |
|
122.10 |
|
113.81 |
|
130.62 |
|
S&P 500 |
|
100.00 |
|
101.81 |
|
107.14 |
|
108.34 |
|
113.69 |
|
2017 Peer Group |
|
100.00 |
|
87.78 |
|
107.84 |
|
104.54 |
|
110.03 |
|
2018 Peer Group |
|
100.00 |
|
89.46 |
|
103.96 |
|
100.61 |
|
108.24 |
|
|
|
|
|
|
|
|
|
|
|
|
|
|
|
|
|
3/15 |
|
6/15 |
|
9/15 |
|
12/15 |
|
AMC Entertainment Holdings, Inc. |
|
|
|
178.08 |
|
155.03 |
|
128.22 |
|
123.16 |
|
S&P 500 |
|
|
|
114.77 |
|
115.09 |
|
107.68 |
|
115.26 |
|
2017 Peer Group |
|
|
|
140.22 |
|
125.76 |
|
102.42 |
|
106.14 |
|
2018 Peer Group |
|
|
|
131.22 |
|
129.74 |
|
106.87 |
|
111.39 |
|
|
|
|
|
|
|
|
|
|
|
|
|
|
|
|
|
3/16 |
|
6/16 |
|
9/16 |
|
12/16 |
|
AMC Entertainment Holdings, Inc. |
|
|
|
144.75 |
|
143.77 |
|
162.95 |
|
177.42 |
|
S&P 500 |
|
|
|
116.82 |
|
119.68 |
|
124.29 |
|
129.05 |
|
2017 Peer Group |
|
|
|
114.70 |
|
117.63 |
|
124.37 |
|
125.48 |
|
2018 Peer Group |
|
|
|
111.48 |
|
111.40 |
|
115.14 |
|
118.79 |
|
|
|
|
|
|
|
|
|
|
|
|
|
|
|
|
|
3/17 |
|
6/17 |
|
9/17 |
|
12/17 |
|
AMC Entertainment Holdings, Inc. |
|
|
|
166.94 |
|
121.79 |
|
79.88 |
|
83.22 |
|
S&P 500 |
|
|
|
136.88 |
|
141.10 |
|
147.42 |
|
157.22 |
37
|
2017 Peer Group |
|
|
|
146.04 |
|
128.89 |
|
121.21 |
|
117.49 |
|
2018 Peer Group |
|
|
|
135.17 |
|
109.59 |
|
105.40 |
|
103.60 |
|
|
|
|
|
|
|
|
|
|
|
|
|
|
|
|
|
3/18 |
|
6/18 |
|
9/18 |
|
12/18 |
|
AMC Entertainment Holdings, Inc. |
|
|
|
78.42 |
|
89.97 |
|
126.07 |
|
76.58 |
|
S&P 500 |
|
|
|
156.03 |
|
161.38 |
|
173.83 |
|
150.33 |
|
2017 Peer Group |
|
|
|
128.09 |
|
120.40 |
|
139.15 |
|
124.96 |
|
2018 Peer Group |
|
|
|
105.65 |
|
104.29 |
|
120.78 |
|
103.25 |
38
Item 6. Selected Financial Data.
|
|
|
Year Ended |
|||||||||||||
|
|
|
December 31, |
|||||||||||||
|
(In millions, except operating data) |
|
2018 |
|
2017 |
|
2016 |
|
2015 |
|
2014 |
|||||
|
Statement of Operations Data: |
|
|
|
|
|
|
|
|
|
|
|
|
|
|
|
|
Revenues: |
|
|
|
|
|
|
|
|
|
|
|
|
|
|
|
|
Admissions |
|
$ |
3,385.0 |
|
$ |
3,229.5 |
|
$ |
2,049.4 |
|
$ |
1,892.0 |
|
$ |
1,765.4 |
|
Food and beverage |
|
|
1,671.5 |
|
|
1,548.4 |
|
|
1,019.1 |
|
|
910.1 |
|
|
797.7 |
|
Other revenue |
|
|
404.3 |
|
|
301.3 |
|
|
167.4 |
|
|
144.8 |
|
|
132.3 |
|
Total revenues |
|
|
5,460.8 |
|
|
5,079.2 |
|
|
3,235.9 |
|
|
2,946.9 |
|
|
2,695.4 |
|
Operating Costs and Expenses: |
|
|
|
|
|
|
|
|
|
|
|
|
|
|
|
|
Film exhibition costs |
|
|
1,710.2 |
|
|
1,604.3 |
|
|
1,089.5 |
|
|
1,021.4 |
|
|
934.3 |
|
Food and beverage costs |
|
|
270.9 |
|
|
252.1 |
|
|
142.2 |
|
|
128.6 |
|
|
112.0 |
|
Operating expense, excluding depreciation and amortization below |
|
|
1,654.7 |
|
|
1,548.0 |
|
|
873.5 |
|
|
795.7 |
|
|
733.3 |
|
Rent |
|
|
797.8 |
|
|
794.4 |
|
|
505.5 |
|
|
467.8 |
|
|
455.2 |
|
General and administrative: |
|
|
|
|
|
|
|
|
|
|
|
|
|
|
|
|
Merger, acquisition and transactions costs(1) |
|
|
31.3 |
|
|
63.0 |
|
|
47.9 |
|
|
3.4 |
|
|
1.2 |
|
Other, excluding depreciation and amortization below(2) |
|
|
179.3 |
|
|
133.2 |
|
|
90.0 |
|
|
76.4 |
|
|
68.4 |
|
Depreciation and amortization |
|
|
537.8 |
|
|
538.6 |
|
|
268.2 |
|
|
233.0 |
|
|
216.3 |
|
Impairment of long-lived assets |
|
|
13.8 |
|
|
43.6 |
|
|
5.5 |
|
|
1.7 |
|
|
3.1 |
|
Operating costs and expenses |
|
|
5,195.8 |
|
|
4,977.2 |
|
|
3,022.3 |
|
|
2,728.0 |
|
|
2,523.8 |
|
Operating income |
|
|
265.0 |
|
|
102.0 |
|
|
213.6 |
|
|
218.9 |
|
|
171.6 |
|
Other expense (income)(3) |
|
|
(108.1) |
|
|
(1.5) |
|
|
0.3 |
|
|
(7.5) |
|
|
(11.8) |
|
Interest expense: |
|
|
|
|
|
|
|
|
|
|
|
|
|
|
|
|
Corporate borrowings |
|
|
262.3 |
|
|
231.6 |
|
|
110.7 |
|
|
96.8 |
|
|
111.0 |
|
Capital and financing lease obligations |
|
|
38.5 |
|
|
42.4 |
|
|
10.8 |
|
|
9.2 |
|
|
9.9 |
|
Non-cash NCM exhibitor services agreement(4) |
|
|
41.5 |
|
|
— |
|
|
— |
|
|
— |
|
|
— |
|
Equity in (earnings) losses of non-consolidated entities(5) |
|
|
(86.7) |
|
|
185.2 |
|
|
(47.7) |
|
|
(37.1) |
|
|
(26.6) |
|
Investment expense (income)(6) |
|
|
(6.2) |
|
|
(22.6) |
|
|
(10.2) |
|
|
(6.1) |
|
|
(8.2) |
|
Earnings (loss) from continuing operations before income taxes |
|
|
123.7 |
|
|
(333.1) |
|
|
149.7 |
|
|
163.6 |
|
|
97.3 |
|
Income tax provision (benefit)(7) |
|
|
13.6 |
|
|
154.1 |
|
|
38.0 |
|
|
59.7 |
|
|
33.5 |
|
Earnings (loss) from continuing operation |
|
|
110.1 |
|
|
(487.2) |
|
|
111.7 |
|
|
103.9 |
|
|
63.8 |
|
Gain (loss) from discontinued operations, net of income tax provision |
|
|
— |
|
|
— |
|
|
— |
|
|
— |
|
|
0.3 |
|
Net earnings (loss) |
|
$ |
110.1 |
|
$ |
(487.2) |
|
$ |
111.7 |
|
$ |
103.9 |
|
$ |
64.1 |
|
Basic earnings (loss) per share: |
|
|
|
|
|
|
|
|
|
|
|
|
|
|
|
|
Earnings (loss) from continuing operations |
|
$ |
0.91 |
|
$ |
(3.80) |
|
$ |
1.13 |
|
$ |
1.06 |
|
$ |
0.65 |
|
Gain from discontinued operations |
|
|
— |
|
|
— |
|
|
— |
|
|
— |
|
|
0.01 |
|
Basic earnings (loss) per share |
|
$ |
0.91 |
|
$ |
(3.80) |
|
$ |
1.13 |
|
$ |
1.06 |
|
$ |
0.66 |
|
Average shares outstanding (thousands) — Basic |
|
|
120,621 |
|
|
128,246 |
|
|
98,838 |
|
|
97,963 |
|
|
97,506 |
|
Diluted earnings (loss) per share: |
|
|
|
|
|
|
|
|
|
|
|
|
|
|
|
|
Earnings (loss) from continuing operations |
|
$ |
0.41 |
|
$ |
(3.80) |
|
$ |
1.13 |
|
$ |
1.06 |
|
$ |
0.65 |
|
Gain from discontinued operations |
|
|
— |
|
|
— |
|
|
— |
|
|
— |
|
|
0.01 |
|
Diluted earnings (loss) per share |
|
$ |
0.41 |
|
$ |
(3.80) |
|
$ |
1.13 |
|
$ |
1.06 |
|
$ |
0.66 |
|
Average shares outstanding (thousands) — Diluted |
|
|
130,105 |
|
|
128,246 |
|
|
98,872 |
|
|
98,029 |
|
|
97,700 |
|
Dividends declared per basic and diluted common share |
|
$ |
2.35 |
|
$ |
0.80 |
|
$ |
0.80 |
|
$ |
0.80 |
|
$ |
0.60 |
39
|
|
|
Year Ended |
|||||||||||||
|
|
|
December 31, |
|||||||||||||
|
(In millions, except operating data) |
|
2018 |
|
2017 |
|
2016 |
|
2015 |
|
2014 |
|||||
|
Balance Sheet Data (at period end): |
|
|
|
|
|
|
|
|
|
|
|
|
|
|
|
|
Cash and equivalents |
|
$ |
313.3 |
|
$ |
310.0 |
|
$ |
207.1 |
|
$ |
211.3 |
|
$ |
218.2 |
|
Corporate borrowings |
|
|
4,722.9 |
|
|
4,235.3 |
|
|
3,761.0 |
|
|
1,912.9 |
|
|
1,782.4 |
|
Other long-term liabilities |
|
|
963.1 |
|
|
903.8 |
|
|
706.6 |
|
|
462.6 |
|
|
419.7 |
|
Capital and financing lease obligations |
|
|
560.3 |
|
|
651.4 |
|
|
675.4 |
|
|
101.9 |
|
|
109.3 |
|
Stockholder’s equity |
|
|
1,397.6 |
|
|
2,112.4 |
|
|
2,009.7 |
|
|
1,538.7 |
|
|
1,512.7 |
|
Total assets |
|
|
9,495.8 |
|
|
9,805.9 |
|
|
8,641.8 |
|
|
5,088.3 |
|
|
4,755.2 |
|
Other Data: |
|
|
|
|
|
|
|
|
|
|
|
|
|
|
|
|
Net cash provided by operating activities |
|
$ |
523.2 |
|
$ |
537.4 |
|
$ |
431.7 |
|
$ |
467.5 |
|
$ |
297.3 |
|
Capital expenditures |
|
|
(576.3) |
|
|
(626.8) |
|
|
(421.7) |
|
|
(333.4) |
|
|
(270.7) |
|
Screen additions |
|
|
89 |
|
|
96 |
|
|
17 |
|
|
23 |
|
|
29 |
|
Screen acquisitions |
|
|
39 |
|
|
736 |
|
|
5,201 |
|
|
410 |
|
|
36 |
|
Screen dispositions |
|
|
211 |
|
|
258 |
|
|
38 |
|
|
14 |
|
|
33 |
|
Construction openings (closures), net |
|
|
5 |
|
|
37 |
|
|
(48) |
|
|
60 |
|
|
(48) |
|
Average screens—continuing operations(8) |
|
|
10,696 |
|
|
10,675 |
|
|
5,592 |
|
|
4,933 |
|
|
4,871 |
|
Number of screens operated |
|
|
11,091 |
|
|
11,169 |
|
|
10,558 |
|
|
5,426 |
|
|
4,947 |
|
Number of theatres operated |
|
|
1,006 |
|
|
1,014 |
|
|
906 |
|
|
387 |
|
|
346 |
|
Screens per theatre |
|
|
11.0 |
|
|
11.0 |
|
|
11.7 |
|
|
14.0 |
|
|
14.3 |
|
Attendance (in thousands)—continuing operations(8) |
|
|
358,901 |
|
|
346,763 |
|
|
215,145 |
|
|
196,902 |
|
|
187,241 |
|
(1) |
Merger, acquisition and transactions costs relate to expenses incurred in connection with the Carmike (acquired December 2016), Odeon (acquired November 2016) and Nordic (acquired March 2017) acquisitions. The year ended December 31, 2018 includes the write-off of $8.0 million of deferred costs related to an Odeon proposed public offering and $6.3 million of expense related to an arbitration ruling on a pre-acquisition date rent dispute for Odeon. During the year ended December 31, 2017, merger, acquisition and transactions costs includes $22.6 million of expense for NCM common units surrendered as a part of the exclusivity waiver with NCM in connection with the Department of Justice (“DOJ”) Final Judgment (“Final Judgment”). During the year ended December 31, 2016, merger, acquisition and transactions costs includes a $10.0 million management transaction bonus financed by a capital contribution from Wanda and related to the successful completion of the Odeon and Carmike acquisitions during 2016. |
|
(2) |
During the year ended in December 31, 2018, other general and administrative expense included a settlement of litigation of $5.7 million, and stock-based compensation expense of $14.9 million. During the ended December 31, 2017, other general and administrative expense included a stock-based compensation expense of $5.7 million. During the year ended December 31, 2016, other general and administrative expense included a settlement of litigation of $7.0 million and stock-based compensation expense of $6.8 million. During the year ended December 31, 2015, other general and administrative expense included stock-based compensation expense of $10.5 million and a net periodic benefit credit of $18.1 million related to the termination of our post-retirement health benefit plan. During the year ended December 31, 2014, other general and administrative expense included stock-based compensation expense of $11.3 million. |
|
(3) |
During the year ended December 31, 2018, other income of $108.1 million is primarily due to $66.4 million of income for the derivative liability related to the embedded conversion feature for the Convertible Notes due 2024 and $45.0 million of income for the derivative asset related to the contingent call option for the cancellation of additional shares of Class B common stock in the Stock Purchase and Cancellation Agreement with Wanda. During the year ended December 31, 2015, we recorded a loss on extinguishment related to the redemption of the Notes due 2020 of approximately $9.3 million and a loss on the modification of the Senior Secured Credit Facility of $1.4 million. During the year ended December 31, 2014, we redeemed our Notes due 2019 resulting in a net gain of $8.4 million. See Note 8 – Corporate Borrowings and Capital and Financing Lease Obligations in the Notes to Consolidated Financial Statements under Part II, Item 8, hereof for further information regarding the derivative liability related to the embedded conversion feature and the call option for the cancellation of additional shares of Class B common stock. |
40
|
(4) |
Non-cash NCM exhibitor services agreement includes a significant financing component due to the significant length of time between receiving the non-cash consideration and fulfilling the performance obligation. We received the non-cash consideration in the form of common membership units from NCM, in exchange for rights to exclusive access to our theatre screens and attendees through February 2037. Upon adoption of ASC 606, our advertising revenues have significantly increased with a similar offsetting increase in non-cash interest expense. |
|
(5) |
Equity in earnings for the year ended December 31, 2018 includes a $28.9 million gain on the sale of all of our remaining interest in NCM and a $30.1 million gain related to the Screenvision merger. During the year ended December 31, 2017, we recorded non-consolidated entity impairment losses and losses on dispositions of our NCM ownership interests of approximately $230.7 million. |
|
(6) |
Investment expense (income) includes a gain on sale of Open Road of $17.2 million during the year ended December 31, 2017. Investment expense (income) includes a gain on sale of our shares in RealD, Inc. of $3.0 million during the year ended December 31, 2016. |
|
(7) |
During the year ended December 31, 2017 we recorded the impact of the change in enacted Federal tax rates in our U.S. jurisdictions of $88.6 million and the impact of a full valuation allowance on our deferred income taxes in U.S. jurisdictions of $221.6 million, for an aggregate charge of approximately $310.0 million in the fourth quarter of 2017. The Company estimates that it will have no liability for deemed repatriation of foreign earnings. During the year ended December 31, 2016 we recorded a $19.2 million income tax benefit related to favorable resolutions of uncertain tax positions with authorities. |
|
(8) |
Includes consolidated theatres only. |
Item 7. Management’s Discussion and Analysis of Financial Condition and Results of Operations.
The following discussion relates to the consolidated audited financial statements of AMC Entertainment Holdings, Inc. (“AMC”) included elsewhere in this Annual Report on Form 10-K. This discussion contains forward-looking statements. Please see “Forward-Looking Statements” for a discussion of the risks, uncertainties and assumptions relating to these statements.
Overview
AMC is the world’s largest theatrical exhibition company and an industry leader in innovation and operational excellence. We operate theatres in 15 countries and are the market leader in nine of those. In the United States, AMC has the #1 market share in the top two markets, New York and Los Angeles.
Our theatrical exhibition revenues are generated primarily from box office admissions and theatre food and beverage sales. The balance of our revenues are generated from ancillary sources, including on-screen advertising, fees earned from our AMC Stubs® customer frequency membership program, rental of theatre auditoriums, income from gift card and exchange ticket sales, on-line ticketing fees and arcade games located in theatre lobbies. As of December 31, 2018, we owned, operated or had interests in 1,006 theatres and 11,091 screens.
Film Content
Box office admissions are our largest source of revenue. We predominantly license “first-run” films from distributors owned by major film production companies and from independent distributors on a film-by-film and theatre-by-theatre basis. Film exhibition costs are accrued based on the applicable admissions revenues and estimates of the final settlement pursuant to our film licenses. Licenses that we enter into typically state that rental fees are based on aggregate terms established prior to the opening of the picture. In certain circumstances and less frequently, our rental fees are based on a mutually agreed settlement upon the conclusion of the picture. Under an aggregate terms formula, we pay the
41
distributor a specified percentage of box office gross or pay based on a scale of percentages tied to different amounts of box office gross. The settlement process allows for negotiation based upon how a film actually performs.
During the 2018 calendar year, films licensed from our seven largest distributors based on revenues accounted for approximately 90% of our U.S. admissions revenues. Our revenues attributable to individual distributors may vary significantly from year to year depending upon the commercial success of each distributor’s films in any given year.
Our revenues are dependent upon the timing and popularity of film releases by distributors. The most marketable films have historically been released during the summer and the calendar year-end holiday seasons. Our results of operations may vary significantly from quarter to quarter and from year to year based on the timing and popularity of film releases.
During the year ended December 31, 2018, we opened 11 new theatres with a total of 89 screens, acquired 4 theatres with 39 screens, permanently closed 211 screens, temporarily closed 514 screens and reopened 519 screens to implement our strategy to install consumer experience upgrades.
As of December 31, 2018, we had 5,411 3D enabled screens, including 216 IMAX®, and 112 other Premium Large Format (“PLF”) screens; approximately 49% of our screens were 3D enabled screens, including IMAX® 3D enabled screens, and approximately 2% of our screens were IMAX® 3D enabled screens. The following table identifies the upgrades to our theatre circuit during the periods indicated:
|
|
|
Number of |
|
Number of |
|
|
|
|
Screens As of |
|
Screens As of |
|
|
Format |
|
December 31, 2018 |
|
December 31, 2017 |
|
|
Digital |
|
11,091 |
|
11,169 |
|
|
3D enabled |
|
5,411 |
|
5,471 |
|
|
IMAX® (3D enabled) |
|
216 |
|
209 |
|
|
Dolby CinemaTM at AMC |
|
127 |
|
89 |
|
|
Other PLF (3D enabled) |
|
112 |
|
99 |
|
|
Dine-in theatres |
|
437 |
|
430 |
|
|
Premium seating |
|
3,279 |
|
2,631 |
|
As of December 31, 2018, AMC is the largest IMAX® exhibitor in the U.S. with a 51% market share, and each of our IMAX® local installations is protected by geographic exclusivity. As of December 31, 2018, our IMAX® screen count is 99% greater than our closest competitor. We believe that we have had considerable success with our IMAX® partnership.
As of December 31, 2018, we have 127 fully operational Dolby Cinema™ at AMC screens in the U.S. In August 2016, we announced the acceleration of our Dolby Cinema™ at AMC deployment. We expect to have 140 Dolby Cinema™ at AMC screens operational by the end of 2019.
We believe there is considerable opportunity to add a private label PLF format in many of our locations, with superior sight and sound technology and enhanced seating as contrasted with our traditional auditoriums. These PLF formats (whose branding varies market to market) give AMC the capability to add a premium screen in theatres where an IMAX® and/or Dolby Cinema™ at AMC might not be feasible, or where an additional premium format could complement existing premium format screens.
Guest Amenities
We continually upgrade the quality of our theatre circuit through substantial renovations featuring our seating concepts, acquisitions, new builds (including expansions), expansion of food and beverage offerings (including dine-in theatres), and by disposing of older screens through closures and sales. We believe we are an industry leader in the development and operation of theatres. Typically, our theatres have 12 or more screens and offer amenities to enhance
42
the movie-going experience, such as stadium seating providing unobstructed viewing, digital sound and premium seat design.
Recliner seating is the key feature of theatre renovations. We believe that maximizing comfort and convenience for our customers will be increasingly necessary to maintain and improve our relevance. These renovations, in conjunction with capital contributions from our landlords, involve stripping theatres to their basic structure in order to replace finishes throughout, upgrade the sight and sound experience, install modernized points of sale and, most importantly, replace traditional theatre seats with plush, electric recliners that allow customers to deploy a leg rest and fully recline at the push of a button. The renovation process typically involves losing up to two-thirds of a given auditorium’s seating capacity. For an industry historically focused on quantity, this reduction in seating capacity could be viewed as counter-intuitive and harmful to revenues. However, the quality improvement in the customer experience is driving a 42% increase in attendance on average at these locations in their first-year post renovation. Our customers have responded favorably to the significant personal space gains from ample row depths, ability to recline or stretch their legs, extra-wide pillowed chaise and oversized armrests. The reseated theatres attract more midweek audiences than normal theatres and tend to draw more adults who pay higher ticket prices than teens or young children. Upon reopening a remodeled theatre, we typically increase the ticket price to reflect that enhanced consumer experience. Additionally, remodeled theatres tend to draw more adults who pay higher ticket prices than teens or young children, as well as more customers who upgrade their tickets to premium formats.
As of December 31, 2018, we now feature recliner seating in approximately 345 theatres, including Dine-in-Theatres, totaling approximately 3,279 screens. By the end of 2019, we expect to convert an additional 600 screens to recliner seating.
Open-source internet ticketing makes our AMC seats (over 1.2 million) in all our U.S. theatres and auditoriums for all our showtimes as available as possible, on as many websites as possible. Our tickets are currently on sale over the internet, directly or through mobile apps, at our own website and app and Fandango, Movietickets.com, and Atom Tickets. We believe increased online access is important because it captures customers’ purchase intent more immediately and directly than if we wait for their arrival at the theatre box office to make a purchase. Carefully monitoring internet pre-sales also lets us adjust capacity in real time, moving movies that are poised to over perform to larger capacity auditoriums or adding additional auditoriums, thereby maximizing yield.
Food and beverage sales are our second largest source of revenue after box office admissions. Food and beverage items traditionally include popcorn, soft drinks, candy and hot dogs. Different varieties of food and beverage items are offered at our theatres based on preferences in the particular geographic region. Our traditional food and beverage strategy emphasizes prominent and appealing food and beverage offerings designed for rapid service and efficiency, including a customer friendly self-serve experience. We design our theatres to have more food and beverage capacity to make it easier to serve larger numbers of customers. Strategic placement of large food and beverage operations within theatres increases their visibility, aids in reducing the length of lines, allows flexibility to introduce new concepts and improves traffic flow around the food and beverage stands.
To address recent consumer trends, we have expanded our menu of enhanced food and beverage products to include made-to-order drinks and meals, customized coffee, healthy snacks, premium beers, wine and mixed drinks, flatbread pizzas, more varieties of hot dogs, four flavors of popcorn and other menu items. The costs of these conversions in some cases are partially covered by investments from the theatre landlord. We currently operate 29 Dine-In Theatres that deliver chef-inspired menus with seat-side or delivery service to luxury recliners with tables. Our recent Dine-In Theatre concepts are designed to capitalize on the latest food service trend, the fast casual eating experience.
AMC Stubs®
AMC Stubs® is a customer loyalty program for our U.S. markets which allows members to earn rewards, receive discounts and participate in exclusive members-only offerings and services. It features both a traditional paid tier called AMC Stubs PremiereTM and a non-paid tier called AMC Stubs InsiderTM. Both programs reward loyal guests for their patronage of AMC Theatres.
On June 20, 2018, we announced the launch of AMC Stubs® A-List, a new tier of our AMC Stubs® loyalty program. This program offers guests admission to movies at AMC up to three times per week including multiple movies per day and repeat visits to already seen movies for $19.95 to $23.95 per month depending upon geographic market.
43
AMC Stubs® A-List also includes premium offerings including IMAX®, Dolby Cinema™ at AMC, RealD, Prime and BigD. AMC Stubs® A-List members can book tickets on-line in advance and select specific seats at AMC Theatres with reserved seating.
As of December 31, 2018, we had more than 17,300,000 active member households in the AMC Stubs® program. Our AMC Stubs® members represented approximately 35.4% of our attendance during 2018 with members generating 1.9x the revenue of non-members. Our much larger database of identified movie-goers also provides us with additional insight into our customers’ movie preferences, and this enables us to have both a larger and a more targeted marketing effort to support our Hollywood studio partners.
The portion of the admissions and food and beverage revenues attributed to the rewards is deferred as a reduction of admissions and food and beverage revenues and is allocated between admissions and food and beverage revenues based on expected member redemptions.
Upon redemption, deferred rewards are recognized as revenues along with associated cost of goods. Points are forfeited upon expiration and recognized as admissions or food and beverage revenues. For the paid tier of the program (AMC Stubs PremiereTM), the program’s annual membership fee is deferred, net of estimated refunds, and is recognized ratably over the one-year membership period.
Significant Events
NCM. In March 2018, we recorded in the line item, Equity in loss of non-consolidated entities, a lower of carrying value or fair value impairment charge of $16.0 million, to reduce the carrying value of our held-for-sale interests in NCM common units and NCM, Inc. common shares to Level 1 fair value as of March 31, 2018. The impairment charge reflects recording our held-for-sale units and shares at the publicly quoted per share price on March 31, 2018 of $5.19.
On June 18, 2018, the Company entered into two Unit Purchase Agreements (the “Agreements”) with each of Regal and Cinemark pursuant to which Regal and Cinemark each separately agreed to purchase 10,738,740 common units of NCM at a sales price of $7.30 per unit and aggregate consideration of approximately $156.8 million (the “Sales”). The Sales closed on July 5, 2018. Following the closing of the Sales, the Company no longer owns any shares of common stock in NCM, Inc. or common units in NCM. NCM consented to the Sales and waived its rights under the memorandum of understanding that provided the Company would not reduce its combined ownership of NCM and NCM, Inc. below 4.5%. We recorded a gain on sale of $28.9 million during the year ended December 31, 2018.
Screenvision Merger. On May 30, 2018, Screenvision entered into an Agreement and Plan of Merger which resulted in a change of control in Screenvision. We received distributions and merger consideration of $45.9 million on July 2, 2018 upon consummation of the merger and retain a 18.4% common membership interest in Screenvision on a fully diluted basis. We reduced the carrying value of our investment in Screenvision to $0 and recorded equity in earnings for the excess distribution of $30.1 million during the year ended December 31, 2018.
Sale and Leaseback Transaction: On June 18, 2018, we completed the sale and leaseback of the real estate assets associated with one theatre for proceeds, net of closing costs, of $50.1 million. The gain on the sale of approximately $27.4 million has been deferred and will be amortized over the remaining lease term.
Fifth Amendment to Credit Agreement: On August 14, 2018, we entered into the Fifth Amendment to Credit Agreement with Citicorp North America, Inc, as administrative agent and the other lenders party thereto, amending the Credit Agreement dated as of April 30, 2013. The Fifth Amendment made certain changes to certain covenants and related definitions. These amendments to the Senior Secured Credit Agreement were executed in order to facilitate an internal reorganization due to recent tax changes and to make modifications which clarified certain ambiguities in the Senior Secured Credit Agreement.
Senior Unsecured Convertible Notes due 2024: On September 14, 2018, we issued $600.0 million aggregate principal amount of our 2.95% Senior Unsecured Convertible Notes due 2024. The Convertible Notes due 2024 mature on September 15, 2024, subject to earlier conversion by the holders thereof, repurchase by AMC at the option of the holders or redemption by AMC upon the occurrence of certain contingencies, as discussed below. Upon maturity, the $600.0 million principal amount of the Convertible Notes due 2024 will be payable in cash. We will pay interest in cash
44
on the Convertible Notes due 2024 at 2.95% per annum, semi-annually in arrears on September 15th and March 15th, commencing on March 15, 2019. We used the net proceeds from the sale of the Convertible Notes due 2024 to repurchase and retire 24,057,143 shares of Class B common stock held by Wanda for $17.50 per share or approximately $421.0 million, associated legal fees of $2.6 million, and to pay a special dividend of $1.55 per share of Class A common stock and Class B common stock, or approximately $160.5 million on September 28, 2018 to shareholders of record on September 25, 2018. See Note 8 – Corporate Borrowings and Capital and Financing Lease Obligations in the Notes to Consolidated Financial Statements under Part II, Item 8, hereof for further information on the terms of the Convertible Notes due 2024.
AMC Shares Repurchased from Wanda: Using proceeds from the Convertible Notes due 2024, we repurchased 24,057,143 shares at a price of $17.50 per share or $421.0 million and associated legal fees of $2.6 million. As of December 31, 2018, Wanda owns 50.01% of AMC through its 51,769,784 shares of Class B common stock. With the 3 to 1 voting rights of Class B common shares, Wanda retains voting control of AMC.
Disposition of Open Road. On August 4, 2017, AMC and Regal Entertainment Group consummated a transaction for the sale of all the issued and outstanding ownership interests in Open Road for total proceeds of $28.8 million of which we received $14.0 million in net proceeds after transaction expenses for our 50% investment and for collection of amounts due from Open Road and recognized a gain on sale of $17.2 million.
Sale Leaseback Transaction. On September 14, 2017, we completed the sale and leaseback of the real estate assets associated with seven theatres for proceeds net of closing costs of $128.4 million. The gain on sale of $78.2 million has been deferred and will be amortized over the remaining lease term. On December 18, 2017, we completed the sale leaseback of the real estate assets of one theatre for net proceeds of $7.8 million resulting in a loss from the sale of $0.4 million.
Financing Activities. In 2017, we amended our Senior Secured Credit Agreement to reduce margins and increase the revolving loan commitment. We also incurred additional indebtedness in connection with our acquisitions. See “Liquidity and Capital Resources” below and Note 8 – Corporate Borrowings and Capital and Financing Obligations in the Notes to Consolidated Financial Statements under Part II, Item 8, hereof for further information.
Nordic Cinema Group Holding AB. On March 28, 2017, we completed the acquisition of Nordic for cash. The purchase price for Nordic was SEK 5,756 million ($654.9 million), which includes payment of interest on the equity value and repayment of shareholder loans. We also assumed indebtedness of Nordic of SEK 1,269 million ($144.4 million) and indebtedness of approximately €156 million ($169.5 million) as of March 28, 2017, which was refinanced subsequent to the acquisition. The Company also assumed approximately SEK 13.5 million ($1.6 million) and approximately €1.0 million ($1.1 million) of interest rate swaps related to the indebtedness which were repaid following the acquisition. All amounts have been converted into US Dollar amounts assuming an SEK/USD exchange rate of 0.11378 and an EUR/USD exchange rate of 1.0865, which were the exchange rates on March 27, 2017. Nordic operated 71 theatres, 467 screens, and approximately 67,000 seats in nearly 50 large and medium-sized cities in the Nordic and Baltic nations, and holds a substantial minority investment in another 51 associated theatres with 216 screens, to which Nordic provides a variety of shared services. Nordic is the largest theatre operator in Scandinavia and the Nordic and Baltic Regions of Europe.
Additional Public Offering. On February 13, 2017, we completed an additional public offering of 20,330,874 shares of Class A common stock at a price of $31.50 per share ($640.4 million), resulting in net proceeds of $616.8 million after underwriters commission and other professional fees. We used a portion of the net proceeds to repay the aggregate principal amount of the Interim Bridge Loan of $350.0 million and general corporate purposes.
NCM Agreement. We recorded in the line item, Equity in (earnings) loss of non-consolidated entities, an other-than-temporary impairment charge of $204.5 million in the year ended December 31, 2017, to reduce the carrying value of our equity interests in NCM, Inc. common shares and NCM common units to Level 1 fair value as of June 30, 2017. The other-than-temporary impairment charge reflects recording our units and shares at the publicly quoted per share price on June 30, 2017, of $7.42 based on our determination that the decline in the price per share during the respective quarter was other than temporary. Our equity interests in common shares and common units had been in an unrealized loss position for approximately three months at June 30, 2017. The impairment analysis requires significant judgment to identify events or circumstances that would likely have a significant adverse effect on the future value of the
45
investment. Consideration was given to financial condition and near-term prospects of the issuer and ability to retain the equity interests in the issuers for a period of time sufficient to allow for any anticipated recovery in market value.
Carmike Cinemas, Inc. In December 2016, we completed the acquisition of Carmike for cash and stock. The purchase price for Carmike was $858.2 million comprised of cash of $584.3 million and 8,189,808 shares of our Class A common stock with a fair value of $273.9 million (based on a closing share price of $33.45 per share on December 20, 2016). We also assumed $230.0 million aggregate principal amount of 6.00% Senior Secured Notes due June 15, 2023 (the “Senior Secured Notes due 2023”), in connection with the acquisition of Carmike. As of December 21, 2016, Carmike operated 271 theatres with 2,923 screens in small and mid-sized markets in 41 states, which further complements our U.S. markets segment. We expect to realize approximately $35.0 million of synergies and cost savings related to this acquisition as a result of purchasing and procurement economies of scale and general and administrative expense savings, particularly with respect to the consolidation of corporate related functions and elimination of redundancies.
Odeon and UCI Cinemas Holdings Limited. In November 2016, we completed the acquisition of Odeon for cash and stock. The purchase price for Odeon was $637.1 million, comprised of cash of $480.3 million and 4,536,466 shares of Class A common stock with a fair value of $156.7 million (based on a closing sale price of $34.55 per share on November 29, 2017). In addition, we repaid indebtedness of Odeon of approximately $593.2 million at closing. As of December 31, 2016, Odeon operated 245 theatres with 2,249 screens in four major markets: United Kingdom, Spain, Italy and Germany; and two smaller markets: Portugal and Ireland, and is included within our International markets segment. We expect to realize approximately $10.0 million of synergies and cost savings related to this acquisition as a result of purchasing and procurement economies of scale.
RealD Inc. We sold 1,222,780 shares of common stock in RealD Inc. during the year ended December 31, 2016 and recognized a gain on sale of $3.0 million.
Dreamscape and Central Services Studios. During 2017, we invested $5.0 million in Dreamscape and $5.0 million in Central Services Studios as a part of our virtual reality technologies strategy. During January 2018, we invested an additional $5.0 million in Dreamscape and an additional $5.0 million in Central Services Studios. We do not have significant influence over these entities and will follow the cost method of accounting.
Dividends. The following is a summary of dividends and dividend equivalents declared to stockholders:
|
|
|
|
|
|
|
Amount per |
|
Total Amount |
||
|
|
|
|
|
|
|
Share of |
|
Declared |
||
|
Declaration Date |
|
Record Date |
|
Date Paid |
|
Common Stock |
|
(In millions) |
||
|
February 28, 2018 |
|
March 12, 2018 |
|
March 26, 2018 |
|
$ |
0.20 |
|
$ |
26.0 |
|
May 3, 2018 |
|
June 11, 2018 |
|
June 25, 2018 |
|
|
0.20 |
|
|
26.0 |
|
July 24, 2018 |
|
September 10, 2018 |
|
September 24, 2018 |
|
|
0.20 |
|
|
25.8 |
|
September 14, 2018 |
|
September 25, 2018 |
|
September 28, 2018 |
|
|
1.55 |
|
|
162.9 |
|
November 1, 2018 |
|
December 10, 2018 |
|
December 26, 2018 |
|
|
0.20 |
|
|
21.2 |
|
February 14, 2017 |
|
March 13, 2017 |
|
March 27, 2017 |
|
|
0.20 |
|
|
26.2 |
|
April 27, 2017 |
|
June 5, 2017 |
|
June 19, 2017 |
|
|
0.20 |
|
|
26.5 |
|
August 3, 2017 |
|
September 11, 2017 |
|
September 25, 2017 |
|
|
0.20 |
|
|
26.5 |
|
October 27, 2017 |
|
December 4, 2017 |
|
December 18, 2017 |
|
|
0.20 |
|
|
25.9 |
Special Dividend: On September 14, 2018, our Board of Directors declared a special cash dividend in the amount of $1.55 per share of Class A and Class B common stock, payable on September 28, 2018 to stockholders of record on September 25, 2018.
During the years ended December 31, 2018, December 31, 2017 and December 31, 2016, we paid dividends and dividend equivalents of $258.1 million, $104.6 million and $79.6 million, respectively. At December 31, 2018, December 31, 2017 and December 31, 2016, we accrued $4.0 million, $1.1 million and $0.5 million, respectively, for the remaining unpaid dividends.
46
On February 15, 2019, we declared a cash dividend in the amount of $0.20 per share of Class A and Class B common stock, payable on March 25, 2019 to stockholders of record on March 11, 2019.
Stock Repurchases. On August 3, 2017, we announced that our Board of Directors had approved a $100.0 million share repurchase program to repurchase our Class A common stock over a two-year period.
Repurchases may be made at management's discretion from time to time through open-market transactions including block purchases, through privately negotiated transactions, or otherwise until August 2019 in accordance with all applicable securities laws and regulations. The extent to which AMC repurchases its shares, and the timing of such repurchases, will depend upon a variety of factors, including liquidity, capital needs of the business, market conditions, regulatory requirements, and other corporate considerations, as determined by AMC’s management team. Repurchases may be made under a Rule 10b5-1 plan, which would permit common stock to be repurchased when our management might otherwise be precluded from doing so under insider trading laws. The repurchase program does not obligate us to repurchase any minimum dollar amount or number of shares and may be suspended for periods or discontinued at any time. During the year ended December 31, 2018, we repurchased 500,000 shares of Class A common stock at a cost of $8.2 million. As of December 31, 2018, we had $44.3 million remaining available for repurchases under this plan.
Critical Accounting Policies and Estimates
Our Consolidated Financial Statements are prepared in accordance with U.S. GAAP. In connection with the preparation of our financial statements, we are required to make assumptions and estimates about future events, and apply judgments that affect the reported amounts of assets, liabilities, revenue, expenses and the related disclosures. We base our assumptions, estimates, and judgments on historical experience, current trends and other factors that management believes to be relevant at the time our Consolidated Financial Statements are prepared. On a regular basis, we review the accounting policies, assumptions, estimates, and judgments to ensure that our financial statements are presented fairly and in accordance with U.S. GAAP. However, because future events and their effects cannot be determined with certainty, actual results could differ from our assumptions and estimates, and such differences could be material. We have identified several policies as being critical because they require management to make particularly difficult, subjective and complex judgments about matters that are inherently uncertain, and there is a likelihood that materially different amounts would be reported under different conditions or using different assumptions.
All of our significant accounting policies are discussed in Note 1 – The Company and Significant Accounting Policies to our Consolidated Financial Statements included elsewhere in this Annual Report on Form 10-K.
Derivative Asset and Liability. We remeasure the derivative asset related to our contingent call option to acquire shares of our Class B Common Stock at no additional cost and the derivative liability related to the conversion feature in our Convertible Notes due 2024 at fair value each reporting period with changes in fair value recorded in the consolidated statement of operations. We have obtained independent third-party valuation studies to assist us in determining fair value. Our valuation studies use a Monte Carlo simulation approach and are based on significant inputs not observable in the market and thus represent level 3 measurements within the fair value measurement hierarchy. Our common stock price at the end of each reporting period as well as the remaining amount of time until expiration for the contingent call option and conversion feature are key inputs for the estimation of fair value that are expected to change each reporting period. We recorded other income related to increases in our derivative asset fair value of $45.0 million and other income related to decreases in our derivative liability fair value of $66.4 million during the year ended December 31, 2018. We expect there will be future changes in fair value for our derivative asset and liability and that the related amounts recorded as income or expense may be material. See Note 8 – Corporate Borrowings and Capital and Financing Lease Obligations, Note 9 – Stockholders’ Equity, and Note 15 – Fair Value Measurements in the Notes to Consolidated Financial Statements under Part II, Item 8 hereof.
Impairments. We evaluate goodwill and other indefinite-lived intangible assets for impairment annually or more frequently as specific events or circumstances dictate. We have invested material amounts of capital in goodwill and other intangible assets in addition to other long-lived assets. We operate in a very competitive business environment and our revenues are highly dependent on movie content supplied by film producers. In addition, it is common for us to closely monitor certain locations where operating performance may not meet our expectations.
We review long-lived assets, including definite-lived intangibles, investments in non-consolidated equity method investees, marketable equity securities and internal use software for impairment when events or changes in
47
circumstances indicate that the carrying amount of the asset group may not be fully recoverable. We identify impairments related to internal use software when management determines that the remaining carrying value of the software will not be realized through future use. We review internal management reports on a quarterly basis as well as monitor current and potential future competition in the markets where we operate for indicators of triggering events or circumstances that indicate potential impairment of individual theatre assets. We evaluate theatres using historical and projected data of theatre level cash flow as our primary indicator of potential impairment and consider the seasonality of our business when making these evaluations. Under these analyses, if the sum of the estimated future cash flows, undiscounted and without interest charges, are less than the carrying amount of the asset group, an impairment loss is recognized in the amount by which the carrying value of the asset group exceeds its estimated fair value. Assets are evaluated for impairment on an individual theatre basis, which management believes is the lowest level for which there are identifiable cash flows. The impairment evaluation is based on the estimated cash flows from continuing use until the expected disposal date for the fair value of furniture, fixtures and equipment. The expected disposal date does not exceed the remaining lease period unless it is probable existing renewal options will be exercised and may be less than the remaining lease period when we do not expect to operate the theatre to the end of its lease term. The fair value of assets is determined as either the expected selling price less selling costs (where appropriate) or the present value of the estimated future cash flows.
We have recorded impairment charges primarily related to long-lived assets of $13.8 million, $43.6 million, and $5.5 million during the years ended December 31, 2018, December 31, 2017, and December 31, 2016, respectively. There are a number of estimates and significant judgments that are made by management in performing these impairment evaluations. Such judgments and estimates include estimates of future revenues, cash flows, capital expenditures, and the cost of capital, among others. We believe we have used reasonable and appropriate business judgments. There is considerable management judgment with respect to cash flow estimates and appropriate multiples and discount rates to be used in determining fair value, and, accordingly, actual results could vary significantly from such estimates, which fall under Level 3 within the fair value measurement hierarchy. These estimates determine whether impairments have been incurred, and quantify the amount of any related impairment charge. Given the nature of our business and our recent history, future impairments are possible and they may be material, based upon business conditions that are constantly changing and the competitive business environment in which we operate.
During the fourth quarter of 2018, we recognized non-cash impairment losses of $13.8 million on 13 theatres in the U.S. markets with 150 screens (in Alabama, Arkansas, California, Colorado, Georgia, Iowa, Kentucky, Michigan, North Dakota, Ohio, Pennsylvania, Tennessee, and Wyoming) and on 15 theatres in the International markets with 118 screens (in Italy, Spain, and United Kingdom). During the fourth quarter of 2017, we recorded impairment charges of $43.6 million on 12 theatres in the U.S. markets with 179 screens (in Illinois, Texas, Virginia, Michigan, Oklahoma, New York and Maryland).
Goodwill. We evaluate goodwill for impairment annually as of the beginning of the fourth fiscal quarter or more frequently as specific events or circumstances dictate. Based on declines during 2018 in the operating results of our International markets which include the Odeon Theatres and Nordic Theatres reporting units, we performed a step 1 quantitative goodwill impairment test as of October 1, 2018. We believe the decline in operating results compared to the prior year and our budget for 2018 was precipitated by poor box office performance during 2018 in our International markets.
The impairment test for goodwill involves estimating the fair value of the reporting unit and comparing that value to its carrying value. If the estimated fair value of the reporting unit is less than its carrying value, the difference is recorded as a goodwill impairment charge, not to exceed the total amount of goodwill allocated to that reporting unit.
We determined the fair value of our two reporting units in our International markets (Odeon Theatres and Nordic Theatres) by using an enterprise valuation methodology and an equally weighted combination of the income approach which utilizes discounted cash flows and the market approach which utilizes market comparable multiples of cash flows. There was considerable management judgment with respect to cash flow estimates and appropriate multiples and discount rates to be used in estimating fair value, which are classified as Level 3 in the fair value hierarchy. The income approach provides an estimate of fair value by measuring estimated annual cash flows over a discrete projection period and applying a present value discount rate to the cash flows. The present value of the cash flows is then added to the present value equivalent of the residual value of the business to arrive at an estimated fair value of the reporting units. The residual value represents the present value of the projected cash flows beyond the discrete projection period. The discount rates were determined using a rate of return deemed appropriate for the risk of achieving the projected cash
48
flows. The market approach used cash flow multiples based on a comparison of growth and profitability of the reporting units and publicly traded peer companies and a 25% control premium based on analysis of comparable transactions.
Key rates used in the income and market approach were as follows:
|
|
|
Odeon |
|
Nordic |
|
|
|
Theatres |
|
Theatres |
|
Description |
|
October 1, 2018 |
||
|
Weighted average cost of capital/discount rate |
|
10.5% |
|
8.5% |
|
Long-term growth rate |
|
2.0% |
|
2.0% |
|
Control premium |
|
25% |
|
25% |
|
Selected cash flow multiple |
|
10.5 x |
|
11.0 x |
The fair value of the Odeon Theatres and Nordic Theatres reporting units exceeded their carrying values by approximately 24.1%, and 2.9%, respectively. Accordingly, there was no goodwill impairment recorded as of October 1, 2018.
Prior to completing the goodwill impairment test, we tested the recoverability of long-lived assets and indefinite-lived intangible assets in our International markets, and we recorded an impairment charge of $5.7 million during the year ended December 31, 2018 related to Property, net at our Odeon Theatres.
While the fair values of our reporting units exceed the carrying values at the present time, the performance of the reporting units may require continued improvement in future periods to sustain their carrying values. Continued declines in the operating performance of our International markets or declines in the trading price of our Class A common stock and/or small changes in certain key input assumptions could have a significant impact on estimated fair value, and therefore, a future impairment could result for a portion of the goodwill, long-lived assets or intangible assets. For illustrative purposes, the following table presents the percentages at which estimated fair value exceeds (less than) the carrying value assuming hypothetical changes in key assumptions for the income approach and market approach:
|
|
|
|
|
|
|
|
|
% Fair Value |
|
|
|
|
|
|
|
|
|
|
|
Carrying |
|
|
|
|
Exceeds |
|
Increase In |
|
Decrease in |
|
Decrease in |
|
Decrease in |
|
|
|
|
Value |
|
Estimated Fair |
|
Carrying Value |
|
WACC |
|
Growth Rate |
|
Control Premium |
|
Multiple |
||
|
|
|
of Equity |
|
Value of Equity |
|
of Equity |
|
0.50% |
|
0.50% |
|
5.00% |
|
0.5 x |
||
|
Odeon Theatres |
|
$ |
543.6 |
|
$ |
674.8 |
|
24.1% |
|
13.6% |
|
16.0% |
|
21.9% |
|
17.3% |
|
Nordic Theatres |
|
|
690.2 |
|
|
710.4 |
|
2.9% |
|
-1.9% |
|
-0.7% |
|
0.9% |
|
0.5% |
|
Total |
|
$ |
1,233.8 |
|
$ |
1,385.2 |
|
12.3% |
|
|
|
|
|
|
|
|
Given the temporary decline in our stock price as of December 31, 2018, we considered if that circumstance would require a further evaluation of impairment in any of our reporting units. We have considered the potential for changes in projected financial information from our quantitative analysis as of October 1, 2018. We have also observed improved operating performance compared to the prior year and budget for the three months ended December 31, 2018. Therefore, we did not perform a step 1 quantative analysis as of December 31, 2018.
If the performance of our International markets further declines from current levels, or if other events or circumstances change that would more likely than not reduce the fair value of our reporting units below their respective carrying value, all or a portion of our goodwill may be impaired in future periods. Examples of such adverse events or circumstances that could change include (i) an adverse change in macroeconomic conditions; (ii) increased cost factors that have a negative effect on our earnings and cash flows; (iii) negative or overall declining financial performance compared with our actual and projected results of relevant prior periods; and (iv) a sustained decrease in our share price resulting in an estimated fair value of our equity that is less than the carrying value of our equity. Any impairment charges that we may take in the future could be material to our results of operations and financial condition.
Income and operating taxes. Income and operating taxes are inherently difficult to estimate and record. This is due to the complex nature of the U.S. and International tax codes and also because our returns are routinely subject to examination by government tax authorities, including federal, state and local officials. Most of these examinations take place a few years after we have filed our tax returns. Our tax audits in many instances raise questions regarding our tax filing positions, the timing and amount of deductions claimed and the allocation of income among various tax
49
jurisdictions. At December 31, 2018, our federal income tax loss carry forward of approximately $212.8 million, which will begin to expire in 2019, our state income tax loss carryforwards of $243.5 million, which may be used over various periods ranging from 1 to 20 years, and our foreign income tax loss carryforwards of $652.6 million, which all but $6.8 million can be used indefinitely, requires us to estimate the amount of carry forward losses that we can reasonably be expected to realize. During 2017, we recorded the impact of the change in the U.S. enacted federal income tax rate from 35% to 21% which reduced our deferred tax assets. During 2017, we also determined that realization of our deferred tax assets in the U.S. tax jurisdictions was not more likely than not, primarily as a result of cumulative net losses recorded for three years and we recorded a full valuation allowance for our deferred tax assets. As a result of the change in enacted tax rate and recording a full valuation allowance for our deferred tax assets, we recorded a charge to income tax provision in 2017 of approximately $310.0 million. Future changes in conditions and in the tax code may change these strategies and thus change the amount of carry forward losses that we expect to realize and the amount of valuation allowances we have recorded. Accordingly future reported results could be materially impacted by changes in tax matters, positions, rules and estimates and these changes could be material. See Note 10 – Income Taxes in the Notes to Consolidated Financial Statements under Part II, Item 8, hereof for further information.
50
Operating Results
The following table sets forth our revenues, operating costs and expenses attributable to our theatrical exhibition operations. Reference is made to Note 16 – Operating Segments to the Consolidated Financial Statements included elsewhere in this Annual Report on Form 10-K for additional information therein:
|
|
|
Year Ended |
|||||||
|
(In millions) |
|
December 31, 2018 |
|
December 31, 2017 |
|
December 31, 2016 |
|||
|
Revenues |
|
|
|
|
|
|
|
|
|
|
Admissions |
|
$ |
3,385.0 |
|
$ |
3,229.5 |
|
$ |
2,049.4 |
|
Food and beverage |
|
|
1,671.5 |
|
|
1,548.4 |
|
|
1,019.1 |
|
Other theatre |
|
|
404.3 |
|
|
301.3 |
|
|
167.4 |
|
Total revenues |
|
|
5,460.8 |
|
|
5,079.2 |
|
|
3,235.9 |
|
Operating Costs and Expenses |
|
|
|
|
|
|
|
|
|
|
Film exhibition costs |
|
|
1,710.2 |
|
|
1,604.3 |
|
|
1,089.5 |
|
Food and beverage costs |
|
|
270.9 |
|
|
252.1 |
|
|
142.2 |
|
Operating expense, excluding depreciation and amortization below |
|
|
1,654.7 |
|
|
1,548.0 |
|
|
873.5 |
|
Rent |
|
|
797.8 |
|
|
794.4 |
|
|
505.5 |
|
General and administrative: |
|
|
|
|
|
|
|
|
|
|
Merger, acquisition and transaction costs |
|
|
31.3 |
|
|
63.0 |
|
|
47.9 |
|
Other, excluding depreciation and amortization below |
|
|
179.3 |
|
|
133.2 |
|
|
90.0 |
|
Depreciation and amortization |
|
|
537.8 |
|
|
538.6 |
|
|
268.2 |
|
Impairment of long-lived assets |
|
|
13.8 |
|
|
43.6 |
|
|
5.5 |
|
Operating costs and expenses |
|
|
5,195.8 |
|
|
4,977.2 |
|
|
3,022.3 |
|
Operating income (loss) |
|
|
265.0 |
|
|
102.0 |
|
|
213.6 |
|
Other expense (income): |
|
|
|
|
|
|
|
|
|
|
Other (income) expense |
|
|
(108.1) |
|
|
(1.5) |
|
|
0.3 |
|
Interest expense: |
|
|
|
|
|
|
|
|
|
|
Corporate borrowings |
|
|
262.3 |
|
|
231.6 |
|
|
110.7 |
|
Capital and financing lease obligations |
|
|
38.5 |
|
|
42.4 |
|
|
10.8 |
|
Non-cash NCM exhibitor service agreement |
|
|
41.5 |
|
|
— |
|
|
— |
|
Equity in (earnings) loss of non-consolidated entities (1) |
|
|
(86.7) |
|
|
185.2 |
|
|
(47.7) |
|
Investment income |
|
|
(6.2) |
|
|
(22.6) |
|
|
(10.2) |
|
Total other expense |
|
|
141.3 |
|
|
435.1 |
|
|
63.9 |
|
Loss before income taxes |
|
|
123.7 |
|
|
(333.1) |
|
|
149.7 |
|
Income tax provision (benefit) |
|
|
13.6 |
|
|
154.1 |
|
|
38.0 |
|
Net earnings (loss) |
|
$ |
110.1 |
|
$ |
(487.2) |
|
$ |
111.7 |
|
|
|
Year Ended |
||||
|
Operating Data: |
|
December 31, 2018 |
|
December 31, 2017 |
|
December 31, 2016 |
|
Screen additions |
|
89 |
|
96 |
|
17 |
|
Screen acquisitions |
|
39 |
|
736 |
|
5,201 |
|
Screen dispositions |
|
211 |
|
258 |
|
38 |
|
Construction openings (closures), net |
|
5 |
|
37 |
|
(48) |
|
Average screens (1) |
|
10,696 |
|
10,675 |
|
5,592 |
|
Number of screens operated |
|
11,091 |
|
11,169 |
|
10,558 |
|
Number of theatres operated |
|
1,006 |
|
1,014 |
|
906 |
|
Screens per theatre |
|
11.0 |
|
11.0 |
|
11.7 |
|
Attendance (in thousands) (1) |
|
358,901 |
|
346,763 |
|
215,145 |
(1)Includes consolidated theatres only.
51
Segment Operating Results
|
|
|
U.S. Markets |
|
International Markets |
|
Consolidated |
|||||||||||||||||||||
|
|
|
Year Ended |
|
Year Ended |
|
Year Ended |
|||||||||||||||||||||
|
|
|
December 31, |
|
December 31, |
|
December 31, |
|||||||||||||||||||||
|
(In millions) |
|
2018 |
|
2017 |
|
2016 |
|
2018 |
|
2017 |
|
2016 |
|
2018 |
|
2017 |
|
2016 |
|||||||||
|
Revenues |
|
|
|
|
|
|
|
|
|
|
|
|
|
|
|
|
|
|
|
|
|
|
|
|
|
|
|
|
Admissions |
|
$ |
2,441.5 |
|
$ |
2,330.9 |
|
$ |
1,972.7 |
|
$ |
943.5 |
|
$ |
898.6 |
|
$ |
76.7 |
|
$ |
3,385.0 |
|
$ |
3,229.5 |
|
$ |
2,049.4 |
|
Food and beverage |
|
|
1,321.2 |
|
|
1,220.1 |
|
|
991.1 |
|
|
350.3 |
|
|
328.3 |
|
|
28.0 |
|
|
1,671.5 |
|
|
1,548.4 |
|
|
1,019.1 |
|
Other theatre |
|
|
250.5 |
|
|
172.5 |
|
|
153.2 |
|
|
153.8 |
|
|
128.8 |
|
|
14.2 |
|
|
404.3 |
|
|
301.3 |
|
|
167.4 |
|
Total revenues |
|
|
4,013.2 |
|
|
3,723.5 |
|
|
3,117.0 |
|
|
1,447.6 |
|
|
1,355.7 |
|
|
118.9 |
|
|
5,460.8 |
|
|
5,079.2 |
|
|
3,235.9 |
|
Operating Costs and Expenses |
|
|
|
|
|
|
|
|
|
|
|
|
|
|
|
|
|
|
|
|
|
|
|
|
|
|
|
|
Film exhibition costs |
|
|
1,323.1 |
|
|
1,224.7 |
|
|
1,055.7 |
|
|
387.1 |
|
|
379.6 |
|
|
33.8 |
|
|
1,710.2 |
|
|
1,604.3 |
|
|
1,089.5 |
|
Food and beverage costs |
|
|
190.2 |
|
|
176.6 |
|
|
135.7 |
|
|
80.7 |
|
|
75.5 |
|
|
6.5 |
|
|
270.9 |
|
|
252.1 |
|
|
142.2 |
|
Operating expense, excluding depreciation and amortization below |
|
|
1,162.2 |
|
|
1,100.6 |
|
|
837.8 |
|
|
492.5 |
|
|
447.4 |
|
|
35.7 |
|
|
1,654.7 |
|
|
1,548.0 |
|
|
873.5 |
|
Rent |
|
|
584.4 |
|
|
594.0 |
|
|
493.9 |
|
|
213.4 |
|
|
200.4 |
|
|
11.6 |
|
|
797.8 |
|
|
794.4 |
|
|
505.5 |
|
General and administrative expense: |
|
|
|
|
|
|
|
|
|
|
|
|
|
|
|
|
|
|
|
|
|
|
|
|
|
|
|
|
Merger, acquisition and transaction costs |
|
|
16.8 |
|
|
58.3 |
|
|
47.1 |
|
|
14.5 |
|
|
4.7 |
|
|
0.8 |
|
|
31.3 |
|
|
63.0 |
|
|
47.9 |
|
Other, excluding depreciation and amortization below |
|
|
112.6 |
|
|
83.8 |
|
|
86.0 |
|
|
66.7 |
|
|
49.4 |
|
|
4.0 |
|
|
179.3 |
|
|
133.2 |
|
|
90.0 |
|
Depreciation and amortization |
|
|
384.0 |
|
|
404.2 |
|
|
256.1 |
|
|
153.8 |
|
|
134.4 |
|
|
12.1 |
|
|
537.8 |
|
|
538.6 |
|
|
268.2 |
|
Impairment of long-lived assets |
|
|
8.1 |
|
|
43.6 |
|
|
5.5 |
|
|
5.7 |
|
|
— |
|
|
— |
|
|
13.8 |
|
|
43.6 |
|
|
5.5 |
|
Operating costs and expenses |
|
|
3,781.4 |
|
|
3,685.8 |
|
|
2,917.8 |
|
|
1,414.4 |
|
|
1,291.4 |
|
|
104.5 |
|
|
5,195.8 |
|
|
4,977.2 |
|
|
3,022.3 |
|
Operating income (loss) |
|
|
231.8 |
|
|
37.7 |
|
|
199.2 |
|
|
33.2 |
|
|
64.3 |
|
|
14.4 |
|
|
265.0 |
|
|
102.0 |
|
|
213.6 |
|
Other expense (income): |
|
|
|
|
|
|
|
|
|
|
|
|
|
|
|
|
|
|
|
|
|
|
|
|
|
|
|
|
Other (income) expense |
|
|
(108.7) |
|
|
(1.0) |
|
|
0.4 |
|
|
0.6 |
|
|
(0.5) |
|
|
(0.1) |
|
|
(108.1) |
|
|
(1.5) |
|
|
0.3 |
|
Interest expense: |
|
|
|
|
|
|
|
|
|
|
|
|
|
|
|
|
|
|
|
|
|
|
|
|
|
|
|
|
Corporate borrowings |
|
|
256.4 |
|
|
230.3 |
|
|
110.7 |
|
|
5.9 |
|
|
1.3 |
|
|
— |
|
|
262.3 |
|
|
231.6 |
|
|
110.7 |
|
Capital and financing lease obligations |
|
|
17.2 |
|
|
20.0 |
|
|
8.9 |
|
|
21.3 |
|
|
22.4 |
|
|
1.9 |
|
|
38.5 |
|
|
42.4 |
|
|
10.8 |
|
Non-cash NCM exhibitor service agreement |
|
|
41.5 |
|
|
— |
|
|
— |
|
|
— |
|
|
— |
|
|
— |
|
|
41.5 |
|
|
— |
|
|
— |
|
Equity in (earnings) loss of non-consolidated entities |
|
|
(81.5) |
|
|
187.9 |
|
|
(47.2) |
|
|
(5.2) |
|
|
(2.7) |
|
|
(0.5) |
|
|
(86.7) |
|
|
185.2 |
|
|
(47.7) |
|
Investment (income) expense |
|
|
(6.2) |
|
|
(23.1) |
|
|
(10.2) |
|
|
— |
|
|
0.5 |
|
|
— |
|
|
(6.2) |
|
|
(22.6) |
|
|
(10.2) |
|
Total other expense |
|
|
118.7 |
|
|
414.1 |
|
|
62.6 |
|
|
22.6 |
|
|
21.0 |
|
|
1.3 |
|
|
141.3 |
|
|
435.1 |
|
|
63.9 |
|
Earnings (loss) before income taxes |
|
|
113.1 |
|
|
(376.4) |
|
|
136.6 |
|
|
10.6 |
|
|
43.3 |
|
|
13.1 |
|
|
123.7 |
|
|
(333.1) |
|
|
149.7 |
|
Income tax provision (benefit) |
|
|
16.1 |
|
|
154.3 |
|
|
40.5 |
|
|
(2.5) |
|
|
(0.2) |
|
|
(2.5) |
|
|
13.6 |
|
|
154.1 |
|
|
38.0 |
|
Net earnings (loss) |
|
$ |
97.0 |
|
$ |
(530.7) |
|
$ |
96.1 |
|
$ |
13.1 |
|
$ |
43.5 |
|
$ |
15.6 |
|
$ |
110.1 |
|
$ |
(487.2) |
|
$ |
111.7 |
|
|
|
U.S. Markets |
|
International Markets |
|
Consolidated |
||||||||||||
|
|
|
Year Ended |
|
Year Ended |
|
Year Ended |
||||||||||||
|
|
|
December 31, |
|
December 31, |
|
December 31, |
||||||||||||
|
|
|
2018 |
|
2017 |
|
2016 |
|
2018 |
|
2017 |
|
2016 |
|
2018 |
|
2017 |
|
2016 |
|
Operating Data: |
|
|
|
|
|
|
|
|
|
|
|
|
|
|
|
|
|
|
|
Screen additions |
|
26 |
|
51 |
|
16 |
|
63 |
|
45 |
|
1 |
|
89 |
|
96 |
|
17 |
|
Screen acquisitions |
|
31 |
|
53 |
|
2,958 |
|
8 |
|
683 |
|
2,243 |
|
39 |
|
736 |
|
5,201 |
|
Screen dispositions |
|
172 |
|
218 |
|
38 |
|
39 |
|
40 |
|
— |
|
211 |
|
258 |
|
38 |
|
Construction openings (closures), net |
|
5 |
|
45 |
|
(48) |
|
— |
|
(8) |
|
— |
|
5 |
|
37 |
|
(48) |
|
Average screens(1) |
|
8,028 |
|
8,084 |
|
5,350 |
|
2,668 |
|
2,591 |
|
242 |
|
10,696 |
|
10,675 |
|
5,592 |
|
Number of screens operated |
|
8,114 |
|
8,224 |
|
8,293 |
|
2,977 |
|
2,945 |
|
2,265 |
|
11,091 |
|
11,169 |
|
10,558 |
|
Number of theatres operated |
|
637 |
|
649 |
|
660 |
|
369 |
|
365 |
|
246 |
|
1,006 |
|
1,014 |
|
906 |
|
Screens per theatre |
|
12.7 |
|
12.7 |
|
12.6 |
|
8.1 |
|
8.1 |
|
9.2 |
|
11.0 |
|
11.0 |
|
11.7 |
|
Attendance (in thousands)(1) |
|
255,736 |
|
240,974 |
|
205,611 |
|
103,165 |
|
105,789 |
|
9,534 |
|
358,901 |
|
346,763 |
|
215,145 |
(1)Includes consolidated theatres only.
Adjusted EBITDA
We present Adjusted EBITDA as a supplemental measure of our performance. We define Adjusted EBITDA as net earnings (loss) plus (i) income tax provision (benefit), (ii) interest expense and (iii) depreciation and amortization, as further adjusted to eliminate the impact of certain items that we do not consider indicative of our ongoing operating
52
performance and to include any cash distributions of earnings from our equity method investees. These further adjustments are itemized below. You are encouraged to evaluate these adjustments and the reasons we consider them appropriate for supplemental analysis. In evaluating Adjusted EBITDA, you should be aware that in the future we may incur expenses that are the same as or similar to some of the adjustments in this presentation. Our presentation of Adjusted EBITDA should not be construed as an inference that our future results will be unaffected by unusual or non-recurring items. The following table sets forth our Adjusted EBITDA by reportable operating segment and our reconciliation of Adjusted EBITDA:
|
|
|
Year Ended |
|||||||
|
Adjusted EBITDA (1) (In millions) |
|
December 31, 2018 |
|
December 31, 2017 |
|
December 31, 2016 |
|||
|
U.S. markets (2) |
|
$ |
700.5 |
|
$ |
610.0 |
|
$ |
573.6 |
|
International markets |
|
|
228.7 |
|
|
212.5 |
|
|
28.4 |
|
Total Adjusted EBITDA |
|
$ |
929.2 |
|
$ |
822.5 |
|
$ |
602.0 |
Adjusted EBITDA increased by $106.7 million or 13.0% during the twelve months ended December 31, 2018 compared to the twelve months ended December 31, 2017. Adjusted EBITDA in U.S. markets increased by $90.5 million or 14.8% primarily due to increases in attendance, increases in food and beverage per patron, decreases in rent expense related to a lease modification and increases in advertising revenues for the NCM ESA related to the adoption of ASC 606 offset by increases in G&A: Other, declines in average ticket price due to increased attendance for our A-list loyalty program and declines in cash distributions from equity method investees. Adjusted EBITDA in international markets increased $16.2 million or 7.6% primarily due to increases in attendance from the Nordic acquisition on March 28, 2017, increases in food and beverage per patron, offset by decreases in attendance at Odeon and declines in foreign currency translation rates.
|
|
|
Year Ended |
|||||||
|
(In millions) |
|
December 31, 2018 |
|
December 31, 2017 |
|
December 31, 2016 |
|||
|
Net earnings (loss) |
|
$ |
110.1 |
|
$ |
(487.2) |
|
$ |
111.7 |
|
Plus: |
|
|
|
|
|
|
|
|
|
|
Income tax provision (benefit) |
|
|
13.6 |
|
|
154.1 |
|
|
38.0 |
|
Interest expense |
|
|
342.3 |
|
|
274.0 |
|
|
121.5 |
|
Depreciation and amortization |
|
|
537.8 |
|
|
538.6 |
|
|
268.2 |
|
Impairment of long-lived assets |
|
|
13.8 |
|
|
43.6 |
|
|
5.5 |
|
Certain operating expenses (1) |
|
|
24.0 |
|
|
20.6 |
|
|
20.2 |
|
Equity in (earnings) loss of non-consolidated entities (2) |
|
|
(86.7) |
|
|
185.2 |
|
|
(47.7) |
|
Cash distributions from non-consolidated entities (3) |
|
|
35.2 |
|
|
45.4 |
|
|
40.1 |
|
Attributable EBITDA (4) |
|
|
7.3 |
|
|
3.4 |
|
|
— |
|
Investment income |
|
|
(6.2) |
|
|
(22.6) |
|
|
(10.2) |
|
Other expense (income) (5) |
|
|
(108.2) |
|
|
(1.3) |
|
|
— |
|
General and administrative — unallocated: |
|
|
|
|
|
|
|
|
|
|
Merger, acquisition and transaction costs (6) |
|
|
31.3 |
|
|
63.0 |
|
|
47.9 |
|
Stock-based compensation expense (7) |
|
|
14.9 |
|
|
5.7 |
|
|
6.8 |
|
Adjusted EBITDA |
|
$ |
929.2 |
|
$ |
822.5 |
|
$ |
602.0 |
|
(1) |
Amounts represent preopening expense related to temporarily closed screens under renovation, theatre and other closure expense for the permanent closure of screens including the related accretion of interest, non-cash deferred digital equipment rent expense, and disposition of assets and other non-operating gains or losses included in operating expenses. We have excluded these items as they are non-cash in nature, include components of interest cost for the time value of money or are non-operating in nature. |
|
(2) |
During the year ended December 31, 2018, we recorded equity in earnings related to our sale of all remaining NCM units of $28.9 million and a gain of $30.1 million related to the Screenvision merger. Equity in earnings of non-consolidated entities also includes loss on the surrender (disposition) of a portion of our investment in NCM of $1.1 million during the year ended December 31, 2018. Equity in (earnings) loss of non-consolidated entities includes a lower of carrying value or fair value impairment loss of the held-for sale portion of our investment in NCM of $16.0 million for the year ended December 31, 2018. Equity in (earnings) loss of non-consolidated entities includes an other-than-temporary impairment charge of $208.0 million to reduce the carrying value of our investment in NCM to Level 1 fair value during the year ended December 31, 2017. An |
53
other-than-temporary impairment charge of $204.5 million was recorded on our units and shares at the publicly quoted per share price on June 30, 2017, of $7.42 and an other-than-temporary impairment charge of $3.5 million was recorded on our units and shares at the publicly quoted per share price on December 31, 2017 of $6.86, based on our determination that the decline in the price per share during the respective quarters was other than temporary. Equity in (earnings) loss of non-consolidated entities includes loss on the sale of a portion of our investment in NCM of $22.2 million during the year ended December 31, 2017. |
|
(3) |
Includes U.S. non-theatre distributions from equity method investments and International non-theatre distributions from equity method investments to the extent received. We believe including cash distributions is an appropriate reflection of the contribution of these investments to our operations. |
|
(4) |
Attributable EBITDA includes the EBITDA from minority equity investments in theatre operators in certain international markets. See below for a reconciliation of our equity earnings of non-consolidated entities to attributable EBITDA. Because these equity investments are in theatre operators in regions where we hold a significant market share, we believe attributable EBITDA is more indicative of the performance of these equity investments and management uses this measure to monitor and evaluate these equity investments. We also provide services to these theatre operators including information technology systems, certain on-screen advertising services and our gift card and package ticket program. As these investments relate only to our Nordic acquisition, the second quarter of 2017 represents the first time we have made this adjustment and does not impact prior historical presentations of Adjusted EBITDA. |
|
|
|
Year Ended |
|||||||
|
(In millions) |
|
December 31, 2018 |
|
December 31, 2017 |
|
December 31, 2016 |
|||
|
Equity in (earnings) loss of non-consolidated entities |
|
$ |
(86.7) |
|
$ |
185.2 |
|
$ |
(47.7) |
|
Less: |
|
|
|
|
|
|
|
|
|
|
Equity in (earnings) loss of non-consolidated entities excluding international theatre JV's |
|
|
(81.9) |
|
|
187.0 |
|
|
(47.7) |
|
Equity in earnings (loss) of International theatre JV's |
|
|
4.8 |
|
|
1.8 |
|
|
— |
|
Income tax provision |
|
|
0.4 |
|
|
— |
|
|
— |
|
Investment income |
|
|
(0.5) |
|
|
— |
|
|
— |
|
Depreciation and amortization |
|
|
2.6 |
|
|
1.6 |
|
|
— |
|
Attributable EBITDA |
|
$ |
7.3 |
|
$ |
3.4 |
|
$ |
— |
|
(5) |
Other expense (income) for the year ended December 31, 2018 includes financing gains and financing related foreign currency transaction losses. During the year ended December 31, 2018, we recorded gain of $111.4 million as a result of a decrease in fair value of our derivative liability and an increase in fair value of our derivative asset for the Convertible Notes due 2024. Other income for the year ended December 31, 2017 includes $3.0 million financing related foreign currency transaction gains, partially offset by $1.3 million in fees relating to third-party fees related to the Third Amendment to our Senior Secured Credit Agreement, and a $0.4 million loss on the redemption of the Bridge Loan Facility. |
|
(6) |
Merger, acquisition and transition costs are excluded as they are non-operating in nature. |
|
(7) |
Non-cash or non-recurring expense included in general and administrative: other |
Adjusted EBITDA is a non-GAAP financial measure commonly used in our industry and should not be construed as an alternative to net earnings (loss) as an indicator of operating performance (as determined in accordance with U.S. GAAP). Adjusted EBITDA may not be comparable to similarly titled measures reported by other companies. We have included Adjusted EBITDA because we believe it provides management and investors with additional information to measure our performance and estimate our value.
Adjusted EBITDA has important limitations as an analytical tool, and you should not consider it in isolation, or as a substitute for analysis of our results as reported under U.S. GAAP. For example, Adjusted EBITDA:
|
· |
does not reflect our capital expenditures, future requirements for capital expenditures or contractual commitments; |
54
|
· |
does not reflect changes in, or cash requirements for, our working capital needs; |
|
· |
does not reflect the significant interest expenses, or the cash requirements necessary to service interest or principal payments, on our debt; |
|
· |
excludes income tax payments that represent a reduction in cash available to us; and |
|
· |
does not reflect any cash requirements for the assets being depreciated and amortized that may have to be replaced in the future; and |
|
· |
does not reflect the impact of divestitures that may be required in connection with recently completed acquisitions. |
Segment Information
Our historical results of operations for the years ended December 31, 2018, December 31, 2017, and December 31, 2016 reflect the results of operations for our two Theatrical Exhibition reportable segments, U.S. markets and International markets.
Prior to the acquisition of Odeon on November 30, 2016, we reported one operating segment, Theatrical Exhibition. Our results of operations for the years ended December 31, 2018 and December 31, 2017 include the acquisition of Nordic on March 28, 2017 and Odeon in our International markets segment.
Results of Operations— For the Years Ended December 31, 2018 and December 31, 2017
Consolidated Results of Operations
Revenues. Total revenues increased 7.5% or $381.6 million during the year ended December 31, 2018 compared to the year ended December 31, 2017. Admissions revenues increased 4.8%, or $155.5 million during the year ended December 31, 2018 compared to the year ended December 31, 2017, primarily due to a 3.5% increase in attendance, and a 1.3% increase in average ticket price. The increase in attendance was primarily due to the popularity of films (for U.S. Markets) released as compared to the same period a year ago and the acquisition of Nordic on March 28, 2017 (for International Markets), partially offset by a lack of popular film product, temporary screen closures for theatre refurbishments and increased competition in International markets. The increase in average ticket price was primarily due to strategic pricing initiatives put in place over the last year, improvements in attendance and popularity of IMAX and other PLF premium content and declines in GBP foreign currency translation rates.
Food and beverage revenues increased 8.0%, or $123.1 million, during the year ended December 31, 2018 compared to the year ended December 31, 2017, primarily due to a 4.3% increase in food and beverage revenues per patron and the increase in attendance. Food and beverage revenues per patron increased as a result of our food and beverage initiatives including our Feature Fare menu that was introduced in 2017 and is available in 418 of our U.S. theatres, offering our guests a broader selection of items to choose from, price increases and declines in GBP foreign currency translation rates.
Total other theatre revenues increased 34.2%, or $103.0 million during the year ended December 31, 2018 compared to the year ended December 31, 2017, primarily due to increases in advertising revenues, ticket fees and income from gift cards and package tickets. The adoption of ASC 606 as of January 1, 2018 resulted in increases to revenue related to presenting third party ticket fees gross of $20.3 million and increases from non-cash NCM ESA interest, a significant financing component included in the transaction price of $41.8 million, offset by a $15.2 million reduction in NCM ESA principal amortization. Other revenues also increased due to the acquisition of Nordic. See Note 1 – The Company and Significant Accounting Policies for a further discussion of the increases in other revenues related to ASC 606.
Operating costs and expenses. Operating costs and expenses increased 4.4%, or $218.6 million during the year ended December 31, 2018 compared to the year ended December 31, 2017. Film exhibition costs increased 6.6%, or $105.9 million, during the year ended December 31, 2018 compared to the year ended December 31, 2017, primarily due
55
to the increase in admissions revenues. As a percentage of admissions revenues, film exhibition costs were 50.5% for the year ended December 31, 2018 and 49.7% for the year ended December 31, 2017.
Food and beverage costs increased 7.5%, or $18.8 million during the year ended December 31, 2018 compared to the year ended December 31, 2017. The increase in food and beverage costs was primarily due to the increase in food and beverage revenues. As a percentage of food and beverage revenues, food and beverage costs were 16.2% for the year ended December 31, 2018 and 16.3% for the year ended December 31, 2017. Food and beverage gross profit per patron increased 4.4% and is calculated as food and beverage revenues less food and beverage costs divided by attendance.
As a percentage of revenues, operating expense was 30.3% for the year ended December 31, 2018 and 30.5% for the year ended December 31, 2017. Rent expense increased 0.4%, or $3.4 million during the year ended December 31, 2018 compared to the year ended December 31, 2017, primarily due to the Nordic acquisition, partially offset by the modification of a theatre lease in the U.S. markets which reduced rent expense by $35.0 million and declines in foreign currency translation rates.
Merger, acquisition and transaction costs. Merger, acquisition and transaction costs were $31.3 million during the year ended December 31, 2018 compared to $63.0 million during the year ended December 31, 2017, primarily due to expenses incurred in connection with the Carmike, Odeon and Nordic acquisitions in the prior year. The current year includes the write-off of $8.0 million of deferred costs related to an Odeon proposed public offering and $6.3 million of expense related to an arbitration ruling on a pre-acquisition date rent dispute for Odeon. The merger, acquisition and transaction costs are a corporate function primarily recorded in the U.S. markets operating segment.
In conjunction with the Carmike acquisition and the DOJ Final Judgment, we returned 1,807,220 additional NCM common units (valued at $22.6 million) in exchange for a waiver of exclusivity by NCM which resulted in $22.6 million of expense during the year ended December 31, 2017.
Other. Other general and administrative expense increased $46.1 million during the year ended December 31, 2018 compared to the year ended December 31, 2017, primarily due to the acquisition of Nordic, increases in legal settlement fees, increases in bonus expense related to improved performance and increases in stock-based compensation expense.
Depreciation and amortization. Depreciation and amortization decreased $0.8 million during the year ended December 31, 2018 compared to the year ended December 31, 2017, primarily due to the prior year impairment charges and adjustments to the estimated fair value of property, net acquired in the Carmike acquisition and declines in foreign currency translation rates, partially offset by depreciation on capital expenditures of $576.3 million during the year ended December 31, 2018 and $626.7 million during the year ended December 31, 2017 and the acquisition of Nordic in 2017.
Impairment of long-lived assets. During the year ended December 31, 2018 we recognized non-cash impairment losses of $8.1 million on 13 theatres in the U.S. markets with 150 screens (in Alabama, Arkansas, California, Colorado, Georgia, Iowa, Kentucky, Michigan, North Dakota, Ohio, Pennsylvania, Tennessee, and Wyoming) which were related to property, net and $5.7 million on 15 theatres in the International markets with 118 screens (in Italy, Spain, and United Kingdom) which were related to property, net. During the year ended December 31, 2017 we recognized non-cash impairment losses of $43.6 million on 12 theatres in the U.S. markets with 179 screens (in Illinois, Maryland Michigan, New York, Oklahoma, Texas, and Virginia), which were related to property, net.
Other Expense (income):
Other expense (income). Other income of $108.1 million during the year ended December 31, 2018 is primarily due to $66.4 million of income for the derivative liability related to the embedded conversion feature for the Convertible Notes due 2024 and $45.0 million of income for the derivative asset related to the contingent call option for the cancellation of additional shares of Class B common stock in the Stock Purchase and Cancellation Agreement with Wanda. See “Significant Events—Senior Unsecured Convertible Notes due 2024” above for further information regarding the call option for the cancellation of additional shares of Class B common stock in the Stock Purchase and Cancellation Agreement with Wanda.
56
Interest expense. Interest expense increased $68.3 million to $342.3 million for the year ended December 31, 2018 compared to $274.0 million for the year ended December 31, 2017 primarily due to non-cash NCM ESA expense of $41.5 million recorded due to adoption of ASC 606 – Revenue Recognition, that required us to reflect an interest component for our long-term performance obligation. On March 17, 2017, we issued $475.0 million of our 6.125% Notes due 2027 and £250.0 million ($313.4 million) of our 6.375% Sterling Notes due 2024. On September 14, 2018, we issued $600.0 million of our 2.95% Convertible Notes due 2024.
Equity in (earnings) losses of non-consolidated entities. Equity in earnings of non-consolidated entities increased $271.9 million to $86.7 million in earnings for the year ended December 31, 2018 compared to equity losses of $185.2 million for the year ended December 31, 2017. Equity in earnings for the year ended December 31, 2018 includes a $2.3 million gain on the sale of NCM common shares, and a $28.9 million gain on the sale of all of our remaining interests in NCM, partially offset by a $17.1 million lower of carrying value or fair value impairment loss. Equity in earnings also includes a $30.1 million gain related to the Screenvision merger during the year ended December 31, 2018. During the year ended December 31, 2017, the loss was primarily due to an other-than-temporary impairment loss on NCM of $208.0 million, loss on sales of NCM shares of $22.2 million and a recognition of previously suspended losses on our investment in Open Road of $8.9 million in the prior year. See Note 6 – Investments of the Notes to the Consolidated Financial Statements under Part II, Item 8 hereof.
Investment income. Investment income was $6.2 million for the year ended December 31, 2018 compared to $22.6 million for the year ended December 31, 2017. Investment income includes payments received related to the NCM tax receivable agreement of $5.4 million and $6.0 million for the year ended December 31, 2018 and December 31, 2017, respectively. Investment income for the year ended December 31, 2018 includes a $1.5 million gain on the sale of a joint venture managed theatre. Investment income for the year ended December 31, 2017 includes a $17.2 million gain on the sale of Open Road.
Income tax (benefit) provision. The income tax provision was $13.6 million for the year ended December 31, 2018 and $154.1 million for the year ended December 31, 2017. In 2017, we recorded the impact of the change in the U.S. enacted federal income tax rate from 35% to 21% which reduced our deferred tax assets. In 2017, we also determined that realization of our deferred tax assets in the U.S. tax jurisdictions was not more likely than not, primarily as a result of cumulative net losses recorded for three years and our limited ability to use as a factor in this determination any projections of future taxable income as a source of recovery for deferred tax assets. Accordingly, we recorded a full valuation allowance on our deferred tax assets. As a result of the change in enacted tax rate and recording a full valuation allowance on our deferred tax assets, we recorded a charge to income tax provision in 2017 of approximately $310.0 million. See Note 10 – Income Taxes in the Notes to Consolidated Financial Statements under Part II, Item 8 hereof.
Net earnings (loss). Net earnings (loss) was $110.1 million and $(487.2) million during the year ended December 31, 2018 and December 31, 2017, respectively. Net earnings during the year ended December 31, 2018 compared to the year ended December 31, 2017 were positively impacted by improvements in equity in earnings of non-consolidated entities related to the prior year impairment charge of $208.0 million for our investment in NCM, the decrease in the income tax provision, higher revenues, lower merger, acquisition and transaction costs, a $35.0 million rent reduction due to a lease modification, $66.4 million of income for the derivative liability related to the embedded conversion feature for the Convertible Notes due 2024, $45.0 million of income for the derivative asset related to the contingent call option for the cancellation of additional shares of Class B common stock in the Stock Purchase and Cancellation Agreement with Wanda, offset by decreases in investment income, increases in interest expense and increases in general and administrative expense (other).
Theatrical Exhibition–U.S. Markets
Revenues. Total revenues increased 7.8% or $289.7 million during the year ended December 31, 2018 compared to the year ended December 31, 2017. Admissions revenues increased 4.7%, or $110.6 million during the year ended December 31, 2018 compared to the year ended December 31, 2017, primarily due to a 6.1% increase in attendance partially offset by a 1.2% decrease in average ticket price. The increase in attendance was due to the popularity of film product during the current year as compared to the prior year. The decrease in average ticket price was primarily due to decreased popularity and related decrease in attendance for 3D, increased attendance for our A-list loyalty program partially offset by increased attendance for our other PLF and IMAX premium content and Traditional content.
57
Food and beverage revenues increased 8.3%, or $101.1 million during the year ended December 31, 2018 compared to the year ended December 31, 2017, primarily due to the increase in attendance, and an increase in food and beverage revenues per patron of 2.0%. Food and beverage revenues per patron increased as a result of price increases and our food and beverage initiatives including our Feature Fare menu that was introduced in 2017 and is available in 418 of our U.S. theatres, offering our guests a broader selection of items to choose from and price increases.
Total other theatre revenues increased 45.2%, or $78.0 million during the year ended December 31, 2018 compared to the year ended December 31, 2017, primarily due to the adoption of ASC 606 as of January 1, 2018 which resulted in presenting third party ticket fees gross for an increase in revenue of $20.3 million and increases from non-cash NCM ESA interest, a significant financing component included in the transaction price of $26.6 million. See Note 1 – The Company and Significant Accounting Policies for a further discussion of increases in other revenues related to ASC 606.
Operating costs and expenses. Operating costs and expenses increased 2.6%, or $95.6 million during the year ended December 31, 2018 compared to the year ended December 31, 2017. Film exhibition costs increased 8.0%, or $98.4 million, during the year ended December 31, 2018 compared to the year ended December 31, 2017, primarily due to the increase in admissions revenues. As a percentage of admissions revenues, film exhibition costs were 54.2% and 52.5% for the year ended December 31, 2018 and December 31, 2017, respectively. The increase in film exhibition cost percentage is primarily due to the concentration of box office revenues in higher grossing films in the current year which typically results in higher film terms and increased attendance from our A-list loyalty program and AMC Stubs members.
Food and beverage costs increased 7.7%, or $13.6 million, during the year ended December 31, 2018 compared to the year ended December 31, 2017. As a percentage of food and beverage revenues, food and beverage costs were 14.4% for the year ended December 31, 2018 and 14.5% for the year ended December 31, 2017. Food and beverage gross profit per patron increased 2.1% and is calculated as food and beverage revenues less food and beverage costs divided by attendance.
As a percentage of revenues, operating expense was 29.0% for the year ended December 31, 2018 and 29.6% for the year ended December 31, 2017. Rent expense decreased 1.6%, or $9.6 million during the year ended December 31, 2018 compared to the year ended December 31, 2017, primarily from the modification of a theatre lease which reduced rent expense by $35.0 million and partially offset by higher snow removal costs in the current year.
General and Administrative Expense:
Merger, acquisition and transaction costs. Merger, acquisition and transaction costs were $16.8 million during the year ended December 31, 2018 compared to $58.3 million during the year ended December 31, 2017, primarily due to expenses incurred in connection with the Carmike, Odeon and Nordic acquisitions in the prior year. The current year includes the write-off of $8.0 million of deferred charges related to an Odeon proposed public offering. The merger, acquisition and transaction costs are a corporate function primarily recorded in the U.S. markets operating segment.
Other. Other general and administrative expense increased $28.8 million, during the year ended December 31, 2018 compared to the year ended December 31, 2017, primarily due to increases in legal settlement fees, bonus expense due to improved operating performance and stock-based compensation expense.
Depreciation and amortization. Depreciation and amortization decreased $20.2 million during the year ended December 31, 2018 compared to the year ended December 31, 2017, primarily due to the prior year impairment charges and adjustments to the estimated fair value of property, net acquired in the Carmike acquisition, partially offset by depreciation on capital expenditures of $395.5 million during the year ended December 31, 2018 and $543.7 million during the year ended December 31, 2017.
Impairment of long-lived assets. During the year ended December 31, 2018 we recognized non-cash impairment losses of $8.1 million on 13 theatres in the U.S. markets with 150 screens (in Alabama, Arkansas, California, Colorado, Georgia, Iowa, Kentucky, Michigan, North Dakota, Ohio, Pennsylvania, Tennessee, and Wyoming) which were related to property, net. During the year ended December 31, 2017 we recognized non-cash impairment losses of
58
$43.6 million on 12 theatres in the U.S. markets with 179 screens (in Illinois, Texas, Virginia, Michigan, Oklahoma, New York and Maryland), which were related to property, net.
Other Expense (income):
Other expense (income). Other income of $108.7 million during the year ended December 31, 2018 is primarily due to $66.4 million of income for the derivative liability related to the embedded conversion feature for the Convertible Notes due 2024 and $45.0 million of income for the derivative asset related to the contingent call option for the cancellation of additional shares of Class B common stock in the Stock Purchase and Cancellation Agreement with Wanda. See “Significant Events—Senior Unsecured Convertible Notes due 2024” above and Note 8 – Corporate Borrowings for further information regarding the call option for the cancellation of additional shares of Class B common stock in the Stock Purchase and Cancellation Agreement with Wanda.
Interest expense. Interest expense increased $64.8 million to $315.1 million for the year ended December 31, 2018 compared to $250.3 million the year ended December 31, 2017 primarily due to a non-cash NCM ESA expense of $41.5 million recorded due to adoption of ASC 606 – Revenue Recognition, that required us to reflect an interest component for our long-term performance obligation. On March 17, 2017, we issued $475.0 million of our 6.125% Notes due 2027 and £250.0 million ($313.4 million) of our 6.375% Sterling Notes due 2024. On September 14, 2018, we issued $600.0 million of our 2.95% Convertible Notes due 2024.
Equity in (earnings) losses of non-consolidated entities. Equity in earnings of non-consolidated entities increased $269.4 million to $81.5 million of earnings for the year ended December 31, 2018 compared to equity losses of $187.9 million for the year ended December 31, 2017. Equity in earnings for the year ended December 31, 2018 includes a $2.3 million gain on the sale of NCM common shares, and a $28.9 million gain on the sale of all of our interest in NCM, partially offset by a $17.1 million lower of carrying value or fair value impairment loss. Equity in earnings includes a $30.1 million gain related to the Screenvision merger during the year ended December 31, 2018. During the year ended December 31, 2017, the loss was primarily due to an other-than-temporary impairment loss on NCM of $208.0 million, loss on sales of NCM shares of $22.2 million and a recognition of previously suspended losses on our investment in Open Road of $8.9 million in the prior year. See Note 6 – Investments of the Notes to the Consolidated Financial under Part II, Item 8 hereof.
Investment income. Investment income was $6.2 million for the year ended December 31, 2018 compared to investment income of $23.1 million for the year ended December 31, 2017. Investment income includes payments received related to the NCM tax receivable agreement of $5.4 million and $6.0 million for the year ended December 31, 2018 and December 31, 2017, respectively. Investment income for the year ended December 31, 2018 includes a $1.5 million gain on the sale of a joint venture managed theatre. Investment income for the year ended December 31, 2017 includes a $17.0 million gain on the sale of our investment in Open Road.
Income tax (benefit) provision. The income tax provision was $16.1 million for the year ended December 31, 2018 and income tax provision was $154.3 million for the year ended December 31, 2017. In 2017, we recorded the impact of the change in the U.S. enacted federal income tax rate from 35% to 21% which reduced our deferred tax assets. In 2017, we also determined that realization of our deferred tax assets in the U.S. tax jurisdictions was not more likely than not, primarily as a result of cumulative net losses recorded for three years and our limited ability to use as a factor in this determination any projections of future taxable income as a source of recovery for deferred tax assets. Accordingly, we recorded a full valuation allowance on our deferred tax assets. As a result of the change in enacted tax rate and recording a full valuation allowance our deferred tax assets, we recorded a charge to income tax provision in 2017 of approximately $310.0 million. See Note 10 – Income Taxes in the Notes to Consolidated Financial Statements under Part II, Item 8 hereof.
Net earnings (loss). Net earnings were $97.0 million and $530.7 million of net losses during the year ended December 31, 2018 and December 31, 2017, respectively. Net earnings during the year ended December 31, 2018 compared to the year ended December 31, 2017 were positively impacted by improvements in equity in earnings of non-consolidated entities related to the prior year impairment charge of $208.0 million for our investment in NCM, the decrease in the income tax provision, decrease in depreciation expense, higher revenues, lower merger, acquisition and transaction costs, a $35.0 million rent reduction due to a lease modification, $66.4 million of income for the derivative liability related to the embedded conversion feature for the Convertible Notes due 2024, $45.0 million of income for the derivative asset related to the contingent call option for the cancellation of additional shares of Class B common stock in
59
the Stock Purchase and Cancellation Agreement with Wanda offset by decreases in investment income, increases in interest expense and increases in general and administrative expense (other).
Theatrical Exhibition - International Markets
Revenues. Total revenues increased 6.8% or $91.9 million during the year ended December 31, 2018 compared to the year ended December 31, 2017. Admissions revenues increased 5.0% or $44.9 million during the year ended December 31, 2018 compared to the year ended December 31, 2017, primarily due to a 7.8% increase in average ticket price, partially offset by a 2.5% decrease in attendance. The increase in average ticket price is due to increased ticket prices for Odeon offset by declines in foreign currency translation rates. Attendance decreased primarily due to declines at Odeon due to the lack of popular films as compared to the prior year, increased competition and temporary screen closures for theatre refurbishments, partially offset by the acquisition of Nordic on March 28, 2017.
Food and beverage revenues increased 6.7% or $22.0 million, during the year ended December 31, 2018 compared to the year ended December 31, 2017, primarily due to a food and beverage per patron increase of 9.7%. Food and beverage per patron increased primarily due to price increases offset by declines in foreign currency translation rates.
Total other theatre revenues increased 19.4% or $25.0 million during the year ended December 31, 2018 compared to the year ended December 31, 2017, primarily due to the acquisition of Nordic, increases in ticket fees and gift card and package ticket income offset by declines in foreign currency translation rates.
Operating costs and expenses. Operating costs and expenses increased $123.0 million during the year ended December 31, 2018 compared to the year ended December 31, 2017. Film exhibition costs increased $7.5 million during the year ended December 31, 2018 compared to the year ended December 31, 2017, primarily due to the increase in admissions revenues. As a percentage of admissions revenues, film exhibition costs were 41.0% for the year ended December 31, 2018 and 42.2% for the year ended December 31, 2017.
Food and beverage costs increased $5.2 million during the year ended December 31, 2018 compared to the year ended December 31, 2017. The increase in food and beverage costs was primarily due to the increase in food and beverage revenues. As a percentage of food and beverage revenues, food and beverage costs were 23.0% for the year ended December 31, 2018 and the year ended December 31, 2017.
As a percentage of revenues, operating expense was 34.0% for the year ended December 31, 2018 and 33.0% during the year ended December 31, 2017. Rent expense increased $13.0 million during the year ended December 31, 2018 compared to the year ended December 31, 2017 due primarily to the acquisition of Nordic on March 28, 2017 offset by declines in foreign currency translation rates.
General and Administrative Expense:
Merger, acquisition and transaction costs. Merger, acquisition and transaction costs were $14.5 million during the year ended December 31, 2018 compared to $4.7 million during the year ended December 31, 2017, primarily due to expenses incurred in connection with the Odeon and Nordic acquisitions. We recorded expense during the current year of $6.3 million for an arbitration ruling related to a pre-acquisition date rent dispute.
Other. Other general and administrative expense increased $17.3 million during the year ended December 31, 2018 compared to the year ended December 31, 2017 primarily due to the Nordic acquisition and stock-based compensation.
Depreciation and amortization. Depreciation and amortization increased $19.4 million during the year ended December 31, 2018 compared to the year ended December 31, 2017 primarily due to the acquisition of Nordic on March 28, 2017, depreciation on capital expenditures of $180.8 million during the year ended December 31, 2018 and $83.0 million during the year ended December 31, 2017, offset by declines in foreign currency translation rates.
Impairment of long-lived assets. During the year ended December 31, 2018 we recognized non-cash impairment losses of $5.7 million on 15 theatres in the International markets with 118 screens (in Italy, Spain, and United Kingdom) which were related to property, net.
60
Interest expense. Interest expense increased $3.5 million for the year ended December 31, 2018 compared to the year ended December 31, 2017, primarily due to penalty interest of $2.1 million for an arbitration ruling related to a pre-acquisition date rent dispute.
Income tax benefit. The income tax benefit was $2.5 million for the year ended December 31, 2018 as compared to income tax benefit of $0.2 million for the year ended December 31, 2017. See Note 10 – Income Taxes in the Notes to Consolidated Financial Statements under Part II, Item 8 hereof.
Net earnings. Net earnings decreased $30.4 million during the year ended December 31, 2018 as a result of increased merger, acquisition and transaction costs, general and administrative: other expenses, depreciation and amortization and offset by the acquisition of Nordic, higher income tax benefit and declines in foreign currency translation rates.
Results of Operations—For the Years Ended December 31, 2017 and December 31, 2016
Consolidated Results of Operations
Revenues. Total revenues increased 57.0% or $1,843.3 million during the year ended December 31, 2017 compared to the year ended December 31, 2016. Admissions revenues increased 57.6%, or $1,180.1 million during the year ended December 31, 2017 compared to the year ended December 31, 2016, primarily due to a 61.2% increase in attendance partially offset by a 2.2% decrease in average ticket price. The increase in attendance was primarily due to the acquisition of Odeon in November 2016, the acquisition of Carmike in December 2016 and the acquisition of Nordic in March 2017. The decrease in average ticket price was primarily due to the acquisition of Odeon where the average ticket price in their markets is lower than in our U.S. markets. Total admissions revenues were increased (decreased) by rewards redeemed, net of deferrals of $3.2 million and $(1.6) million during the years ended December 31, 2017 and December 31, 2016, respectively. The rewards accumulated under AMC Stubs® are deferred and recognized in future periods upon redemption or expiration of customer rewards.
Food and beverage revenues increased 51.9%, or $529.3 million, during the year ended December 31, 2017 compared to the year ended December 31, 2016, primarily due to the increase in attendance due to the acquisitions, partially offset by a 5.7% decrease in food and beverage revenues per patron. The decrease in food and beverage revenues per patron was primarily due to the acquisitions of Odeon and Nordic where food and beverage revenues per patron in International markets is much lower than in our U.S. markets. Total food and beverage revenues were increased (decreased) by rewards redeemed, net of deferrals, of $2.7 million and $(0.8) million during the years ended December 31, 2017 and December 31, 2016, respectively.
Total other theatre revenues increased 80.0%, or $133.9 million during the year ended December 31, 2017 compared to the year ended December 31, 2016, primarily due to increases from the Odeon, Carmike, and Nordic acquisitions.
Operating costs and expenses. Operating costs and expenses increased 64.7%, or $1,954.9 million during the year ended December 31, 2017 compared to the year ended December 31, 2016. Film exhibition costs increased 47.3%, or $514.8 million, during the year ended December 31, 2017 compared to the year ended December 31, 2016, primarily due to the increase in admissions revenues as a result of the acquisitions. As a percentage of admissions revenues, film exhibition costs were 49.7% for the year ended December 31, 2017 and 53.2% for the year ended December 31, 2016. Film exhibition costs as a percentage of admissions revenues in our International markets are much lower than in our U.S. markets.
Food and beverage costs increased 77.3%, or $109.9 million during the year ended December 31, 2017 compared to the year ended December 31, 2016. As a percentage of food and beverage revenues, food and beverage costs were 16.3% for the year ended December 31, 2017 and 14.0% for the year ended December 31, 2016 due to the acquisition of Odeon and Nordic where food and beverage costs as a percentage of food and beverage revenues are much higher in our International markets than in our U.S. markets. The increase in food and beverage costs was primarily due to the increase in food and beverage revenues. Food and beverage gross profit per patron decreased 8.3%, and is calculated as food and beverage revenues less food and beverage costs divided by attendance. The decrease is primarily due to lower gross profit per patron in our International markets.
61
As a percentage of revenues, operating expense was 30.5% for the year ended December 31, 2017 and 27.0% for the year ended December 31, 2016. Rent expense increased 57.2%, or $288.9 million during the year ended December 31, 2017 compared to the year ended December 31, 2016, primarily from the increase in the number of theatres operated due to the acquisitions of Odeon, Carmike, and Nordic.
Merger, acquisition and transaction costs. Merger, acquisition and transaction costs were $63.0 million during the year ended December 31, 2017 compared to $47.9 million during the year ended December 31, 2016. This increase was primarily due to expenses incurred in connection with the DOJ Final Judgment for the Carmike acquisition. The merger, acquisition and transaction costs are costs and expenses incurred principally at the corporate office in the investigation, negotiation, financing and transition of acquisitions.
In conjunction with the Carmike acquisition and the DOJ Final Judgment, we returned 1,807,220 additional NCM LLC common units (valued at $22.6 million) in exchange for a waiver of exclusivity by NCM which resulted in $22.6 million of expense during the year ended December 31, 2017.
Other. Other general and administrative expense increased $43.2 million during the year ended December 31, 2017 compared to the year ended December 31, 2016, due primarily to the acquisitions of Odeon and Nordic and increases in development costs, salaries and benefits.
Depreciation and amortization. Depreciation and amortization increased $270.4 million during the year ended December 31, 2017 compared to the year ended December 31, 2016, primarily due to the increase in depreciable assets resulting from the acquisitions of Odeon, Carmike, and Nordic, as well as capital expenditures of $626.8 million during the year ended December 31, 2017 and $421.7 million during the year ended December 31, 2016.
Impairment of long-lived assets. We recognized non-cash impairment losses of $43.6 million on 12 theatres in the U.S. markets with 179 screens (in Illinois, Texas, Virginia, Michigan, Oklahoma, New York and Maryland), which were related to property, net. During the year ended December 31, 2016, we recognized non-cash impairment losses of $5.5 million on two theatres with 22 screens (in California and Missouri), which were related to property, net.
Other Expense (Income):
Other income. Other income of $1.5 million during the year ended December 31, 2017 is primarily due to financing related foreign currency transaction gains of $3.0 million and a $0.4 million recovery for business interruption, offset by $1.0 million of third-party fees related to the Third Amendment to our Senior Secured Credit Agreement and a $0.4 million loss on the repayment of the Bridge Loan Facility.
Interest expense. Interest expense increased $152.5 million to $274.0 million for the year ended December 31, 2017 compared to $121.5 million for the year ended December 31, 2016 primarily due to issuance of $595.0 million of our 5.875% Notes due 2026 and £250.0 million ($337.6 million) of our 6.375% Sterling Notes due 2024 on November 8, 2016 for the Odeon acquisition, issuance of $500.0 million of new Term loans due 2023 on November 30, 2016, issuance of our 7.0% Bridge Loan due 2017 of $350.0 million on December 21, 2016 (repaid in February 2017), and the assumption from Carmike of $230.0 million of 6.0% Notes due 2023 on December 21, 2016 for the Carmike acquisition, issuance of $475.0 million of our 6.125% Notes due 2027 on March 17, 2017, and the issuance of additional £250.0 million ($337.6 million) of our 6.375% Sterling Notes due 2024 on March 17, 2017 for the Nordic acquisition. The interest rate on the new Term Loans due 2023 was 3.727% as of December 31, 2017. We also assumed $223.7 million of capital and financing lease obligations from Carmike, $367.3 million of capital and financing lease obligations from Odeon, and $11.7 million of capital and financing lease obligations from Nordic with interest rates ranging from 5.1% to 6.4%.
Equity in (earnings) loss of non-consolidated entities. Equity in loss of non-consolidated entities was $185.2 million for the year ended December 31, 2017 compared to equity earnings of $47.7 million for the year ended December 31, 2016. The decrease in equity in earnings of non-consolidated entities of $232.9 million was primarily due to an other-than-temporary impairment loss on NCM of $208.0 million, loss on sales of NCM shares of $22.2 million and increase in loss from Open Road of $8.9 million. See “Significant Events—NCM Agreement” above for further information regarding the other-than-temporary impairment loss and loss on sale of NCM shares.
62
Investment income. Investment income was $22.5 million for the year ended December 31, 2017 compared to investment income of $10.2 million for the year ended December 31, 2016. The increase in investment income was primarily due to the $17.2 million gain on the sale of Open Road. Investment income includes income related to the NCM tax receivable agreement of $6.0 million and $7.8 million for the years ended December 31, 2017 and December 31, 2016, respectively. Investment income includes a $3.0 million gain on the sale of RealD during the year ended December 31, 2016.
Income tax provision (benefit). The income tax provision was $154.1 million and $38.0 million for the years ended December 31, 2017 and December 31, 2016, respectively. In 2017, we recorded the impact of the change in the U.S. enacted federal income tax rate from 35% to 21% which reduced our deferred tax assets. In 2017, we also determined that realization of our deferred tax assets in the U.S. tax jurisdictions was not more likely than not, primarily as a result of cumulative net losses recorded for three years and our limited ability to use as a factor in this determination any projections of future taxable income as a source of recovery for deferred tax assets in 2017. Accordingly, we recorded a full valuation allowance on our deferred tax assets. As a result of the change in enacted tax rate and recording a full valuation allowance on our deferred tax assets, we recorded a charge to income tax provision in 2017 approximately $310.0 million. See Note 10 – Income Taxes in the Notes to Consolidated Financial Statements under Part II, Item 8 hereof.
Net earnings (loss). Net loss was $487.2 million and net earnings was $111.7 million during the years ended December 31, 2017 and December 31, 2016, respectively. Net loss during the year ended December 31, 2017 compared to net earnings during the year ended December 31, 2016 was negatively impacted by the income tax charge, an other-than-temporary impairment loss on NCM of $208.0 million and loss on sale of NCM shares of $22.2 million, impairment charges of $43.6 million, decreases in average ticket price, food and beverage revenues per patron, and increases in rent, depreciation and amortization expense, interest expense, and general and administrative expense (other and merger, acquisition and transaction costs), partially offset by the increase in attendance related to the Odeon, Carmike, and Nordic acquisitions, and the $17.2 million gain on sale of Open Road.
Theatrical Exhibition–U.S. Markets
Revenues. Total revenues increased 19.5% or $606.5 million during the year ended December 31, 2017 compared to the year ended December 31, 2016. Admissions revenues increased 18.2%, or $358.2 million during the year ended December 31, 2017 compared to the year ended December 31, 2016, primarily due to a 17.2% increase in attendance and a 0.8% increase in average ticket price. The increase in attendance was primarily due to the acquisition of Carmike in December 2016. Total admissions revenues were increased (decreased) by rewards redeemed, net of deferrals of $3.2 million and $(1.6) million during the year ended December 31, 2017 and December 31, 2016, respectively. The rewards accumulated under AMC Stubs® are deferred and recognized in future periods upon redemption or expiration of customer rewards.
Food and beverage revenues increased 23.1%, or $229.0 million during the year ended December 31, 2017 compared to the year ended December 31, 2016, primarily due to the increase in attendance due to the Carmike acquisition and the increase in food and beverage revenues per patron of 5.1% due to price increases and the introduction of enhanced menu offerings. Total food and beverage revenues were increased (decreased) by rewards redeemed, net of deferrals, of $2.7 million and $(0.8) million during the year ended December 31, 2017 and December 31, 2016, respectively.
Total other theatre revenues increased 12.6%, or $19.3 million during the year ended December 31, 2017 compared to the year ended December 31, 2016, primarily due to increases from the Carmike acquisition for internet ticketing fees and advertising revenues, partially offset by a decline in membership fees for AMC Stubs® and declines in income from exchange tickets due to declines in sales volume and estimated non-presentment rates.
Operating costs and expenses. Operating costs and expenses increased 26.3%, or $768.0 million during the year ended December 31, 2017 compared to the year ended December 31, 2016. Film exhibition costs increased 16.0%, or $169.0 million, during the year ended December 31, 2017 compared to the year ended December 31, 2016. This increase was primarily due to the increase in admissions revenues due to the Carmike acquisition. As a percentage of admissions revenues, film exhibition costs were 52.5% for the year ended December 31, 2017 and 53.5% for the year ended December 31, 2016.
63
Food and beverage costs increased 30.1%, or $40.9 million, during the year ended December 31, 2017 compared to the year ended December 31, 2016. As a percentage of food and beverage revenues, food and beverage costs were 14.5% for the year ended December 31, 2017 and 13.7% for the year ended December 31, 2016. The increase in food and beverage costs was primarily due to the increase in food and beverage revenues. Food and beverage gross profit per patron increased 4.1%, and is calculated as food and beverage revenues less food and beverage costs divided by attendance.
As a percentage of revenues, operating expense was 29.6% for the year ended December 31, 2017 and 26.9% for the year ended December 31, 2016. Rent expense increased 20.3%, or $100.1 million during the year ended December 31, 2017 compared to the year ended December 31, 2016, primarily from the increase in the number of theatres operated including the acquisition of Carmike.
General and Administrative Expense:
Merger, acquisition and transaction costs. Merger, acquisition and transaction costs were $58.3 million during the year ended December 31, 2017 compared to $47.1 million during the year ended December 31, 2016, primarily due to our return of NCM LLC common units in connection with the Carmike acquisition, offset by declines in professional and consulting costs related to the Carmike acquisition, Odeon acquisition, and Nordic acquisition. The merger, acquisition and transaction costs are costs and expenses incurred principally at the corporate office in the investigation, negotiation, financing and transition of acquisitions.
In conjunction with the Carmike acquisition and the DOJ Final Judgment, we returned 1,807,220 additional NCM LLC common units (valued at $22.6 million) in exchange for a waiver of exclusivity by NCM which resulted in $22.6 million of expense during the year ended December 31, 2017.
Other. Other general and administrative expense declined $2.2 million during the year ended December 31, 2017 compared to the year ended December 31, 2016. Legal expenses declined $9.3 million primarily due to the settlement of a lawsuit in the prior year of $7.0 million and costs related to the settlement offset by increases in salaries and benefits and advertising expense.
Depreciation and amortization. Depreciation and amortization increased $148.1 million during the year ended December 31, 2017 compared to the year ended December 31, 2016, primarily due to the increase in depreciable assets resulting from the acquisition of Carmike, as well as capital expenditures of $543.8 million during the year ended December 31, 2017 and $412.8 million during the year ended December 31, 2016.
Impairment of long-lived assets. During the year ended December 31, 2017, we recognized non-cash impairment losses of $43.6 million on 12 theatres with 179 screens (in Illinois, Texas, Virginia, Michigan, Oklahoma, New York and Maryland), which were related to property, net. During the year ended December 31, 2016, we recognized non-cash impairment losses of $5.5 million on two theatres with 22 screens (in California and Missouri), which were related to property, net.
Other Expense (Income):
Other income. Other income of $1.0 million during the year ended December 31, 2017 is primarily due to financing related foreign currency transaction gains of $3.0 million and a $0.4 million recovery for business interruption, partially offset by $1.0 million of third-party fees related to the Third Amendment to our Senior Secured Credit Agreement, $1.0 million in other net periodic benefit costs, and a $0.4 million loss on the repayment of the Bridge Loan Facility.
Interest expense. Interest expense increased $130.7 million to $250.3 million for the year ended December 31, 2017 compared to $121.5 million for the year ended December 31, 2016 primarily due to issuance of $595.0 million of our 5.875% Notes due 2026 and £250.0 million ($337.6 million) of our 6.375% Sterling Notes due 2024 on November 8, 2016 for the Odeon acquisition, issuance of $500.0 million of new Term loans due 2023 on November 30, 2016, issuance of our 7.0% Bridge Loan due 2017 of $350.0 million on December 21, 2016 (repaid in February 2017), the assumption from Carmike of $230.0 million of 6.0% Notes due 2023 on December 21, 2016 for the Carmike acquisition, issuance of $475.0 million of our 6.125% Notes due 2027 on March 17, 2017, and the issuance of additional £250.0 million ($337.6 million) of our 6.375% Sterling Notes due 2024 on March 17, 2017 for the Nordic acquisition.
64
The interest rate on the new Term Loans due 2023 was 3.727% as of December 31, 2017. We also assumed $223.7 million of capital and financing lease obligations from Carmike with interest rates ranging from 5.75% to 6.25%.
Equity in (earnings) loss of non-consolidated entities. Equity in loss of non-consolidated entities were $187.9 million for the year ended December 31, 2017 compared to equity earnings of $47.2 million for the year ended December 31, 2016. The decrease in equity in earnings of non-consolidated entities of $235.1 million was primarily due to an other-than-temporary impairment loss on NCM of $208.0 million, loss on sales of NCM shares of $22.2 million and recognition of previously suspended loss from Open Road of $8.9 million. See “Significant Events—NCM Agreement” above for further information regarding the other-than-temporary impairment loss.
Investment income. Investment income was $23.1 million for the year ended December 31, 2017 compared to investment income of $10.2 million for the year ended December 31, 2016. The primary increase in investment income was primarily due to the $17.2 million gain on the sale of Open Road. Investment income includes income related to the NCM tax receivable agreement of $6.0 million and $7.8 million for the years ended December 31, 2017 and December 31, 2016, respectively. Investment income also includes a $3.0 million gain on the sale of RealD during the year ended December 31, 2016.
Income tax provision. The income tax provision was $154.3 million for the year ended December 31, 2017 and $40.5 million for the year ended December 31, 2016. In 2017, we recorded the impact of the change in the U.S. enacted federal income tax rate from 35% to 21% which reduced our deferred tax assets. In 2017, we also determined that realization of our deferred tax assets in the U.S. tax jurisdictions was not more likely than not, primarily as a result of cumulative net losses recorded for three years and our limited ability to use as a factor in this determination any projections of future taxable income as a source of recovery for deferred tax assets. Accordingly, we recorded a full valuation allowance on our deferred tax assets in 2017. As a result of the change in enacted tax rate and recording a full valuation allowance our deferred tax assets, we recorded a charge to income tax provision in 2017 of approximately $310.0 million. See Note 10 – Income Taxes in the Notes to Consolidated Financial Statements under Part II, Item 8 hereof.
Net earnings (loss). Net loss was $530.7 million and net earnings were $96.1 million during the year ended December 31, 2017 and December 31, 2016, respectively. Net loss during the year ended December 31, 2017 compared to net earnings during the year ended December 31, 2016 was negatively impacted by the income tax provision change, an other-than-temporary impairment loss on NCM of $208.0 million, loss on sale of NCM, Inc. shares of $22.2 million, impairment of $43.6 million, increases in rent, depreciation and amortization expense, interest expense, and general and administrative expense (other and merger, acquisition and transaction costs), partially offset by the increase in attendance related to the Carmike acquisition, increases in average ticket price and food and beverage revenue per patron, and the $17.2 million gain on sale of Open Road.
Theatrical Exhibition - International Markets
Revenues. Total revenues increased $1,236.8 million during the year ended December 31, 2017 compared to the year ended December 31, 2016. Admissions revenues increased $821.9 million during the year ended December 31, 2017 compared to the year ended December 31, 2016, primarily due to an increase in attendance due to the acquisitions of Odeon on November 30, 2016 and Nordic on March 28, 2017.
Food and beverage revenues increased $300.3 million during the year ended December 31, 2017 compared to the year ended December 31, 2016, primarily due to the increase in attendance as a result of the acquisitions of Odeon and Nordic.
Total other theatre revenues increased $114.6 million during the year ended December 31, 2017 compared to the year ended December 31, 2016, primarily due to the acquisition of Odeon and Nordic. Total other theatre revenues include revenues for advertising and theatre rentals.
Operating costs and expenses. Operating costs and expenses increased $1,186.9 million during the year ended December 31, 2017 compared to the year ended December 31, 2016. Film exhibition costs increased $345.8 million during the year ended December 31, 2017 compared to the year ended December 31, 2016, primarily due to the increase in admissions revenues as a result of the acquisitions. As a percentage of admissions revenues, film exhibition costs were 42.2% for the year ended December 31, 2017 and 44.1% for the year ended December 31, 2016.
65
Food and beverage costs increased $69.0 million during the year ended December 31, 2017 compared to the year ended December 31, 2016. The increase in food and beverage costs was primarily due to the increase in food and beverage revenues. As a percentage of food and beverage revenues, food and beverage costs were 23.0% for the year ended December 31, 2017 and 23.2% for the year ended December 31, 2016.
As a percentage of revenues, operating expense was 33.0% for the year ended December 31, 2017 and 30.0% during the year ended December 31, 2016. Rent expense increased $187.0 million during the year ended December 31, 2017 compared to the year ended December 31, 2016 due to the increase in the number of theatres operated as a result of the Odeon and Nordic acquisitions.
General and Administrative Expense:
Merger, acquisition and transaction costs. Merger, acquisition and transaction costs increased $3.9 million during the year ended December 31, 2017 compared to the year ended December 31, 2016, primarily due to costs associated with the Nordic acquisition. The majority of our consolidated merger, acquisition and transaction costs related to Odeon and Nordic are included in our Theatrical Exhibition – U.S. markets operating segment. The merger, acquisition and transactions costs are costs and expenses incurred principally at the corporate office in the investigation, negotiation, financing and transition of acquisitions.
Other. Other general and administrative expense increased $45.4 million during the year ended December 31, 2017 compared to the year ended December 31, 2016 due to the Odeon and Nordic acquisitions.
Depreciation and amortization. Depreciation and amortization increased $122.3 million during the year ended December 31, 2017 compared to the year ended December 31, 2016 due to the increase in depreciable assets resulting from the Odeon and Nordic acquisitions.
Interest expense. Interest expense increased $21.8 million for the year ended December 31, 2017 compared to the year ended December 31, 2016, primarily due to interest expense related to approximately $367.3 million of capital and financing lease obligations from Odeon and $11.7 million of capital and financing lease obligations from Nordic with interest rates ranging from 5.1% to 6.4%.
Income tax provision. The income tax benefit was $0.2 million for the year ended December 31, 2017. See Note 10 – Income Taxes in the Notes to Consolidated Financial Statements under Part II, Item 8 hereof.
Net earnings. Net earnings increased $27.9 million during the year ended December 31, 2017 as a result of the Odeon and Nordic acquisitions.
Liquidity and Capital Resources
Our consolidated revenues are primarily collected in cash, principally through box office admissions and food and beverage sales. We have an operating “float” which partially finances our operations and which generally permits us to maintain a smaller amount of working capital capacity. This float exists because admissions revenues are received in cash, while exhibition costs (primarily film rentals) are ordinarily paid to distributors from 20 to 45 days following receipt of box office admissions revenues. Film distributors generally release the films which they anticipate will be the most successful during the summer and year-end holiday seasons. Consequently, we typically generate higher revenues during such periods.
We had working capital deficits (excluding restricted cash) as of December 31, 2018 and December 31, 2017 of $(557.5 million) and $(545.3 million), respectively. Working capital includes $414.8 million and $401.0 million of deferred revenue as of December 31, 2018 and December 31, 2017, respectively. We have the ability to borrow under our Senior Secured Credit Facility to meet obligations as they come due (subject to limitations on the incurrence of indebtedness in our various debt instruments). As of December 31, 2018, we had $211.2 million available for borrowing, net of letters of credit, under our Revolving Credit Facility. We also maintain a £100.0 million ($126.8 million based on the foreign currency translation rate of 1.268 on December 31, 2018) revolving credit facility at our Odeon subsidiary. As of December 31, 2018, we had drawn down on the revolving credit facility by £9.4 million ($11.9 million) and had issued £16.7 million ($21.2 million) standby letters of credit in the ordinary course of business, leaving £73.9 million
66
($93.7 million) available for borrowing. Reference is made to Note 8 – Corporate Borrowings and Capital and Financing Lease Obligations in the Notes to Consolidated Financial Statements under Part II, Item 8, hereof for further information about our outstanding indebtedness.
We believe that cash generated from operations, existing cash and cash equivalents, availability under our Revolving Credit Facility and Odeon’s Revolving Credit Facility Agreement will be sufficient to fund operations, planned capital expenditures, dividends and repurchases of our common stock currently and for at least the next 12 months and enable us to maintain compliance with all financial debt covenants.
Each indenture relating to our notes (Notes due 2022, Sterling Notes due 2024, Convertible Notes due 2024, Notes due 2025 and Notes due 2026) allows us to incur specified permitted indebtedness (as defined therein) without restriction. Each indenture also allows us to incur any amount of additional debt as long as it can satisfy the coverage ratio of each indenture, after giving effect to the indebtedness on a pro forma basis. Under the indentures for the Notes due 2022, Sterling Notes due 2024, Convertible Notes due 2024, Notes due 2025 and Notes due 2026, at December 31, 2018, AMC could borrow approximately $621.1 million including amounts discussed above, available under our Revolving Credit Facility and Odeon’s revolving credit facility. If we cannot satisfy the coverage ratios of the indentures, generally we can borrow an additional amount under our Senior Secured Credit Facility.
As of December 31, 2018, we were in compliance with all financial debt covenants.
See Note 8 – Corporate Borrowings and Capital and Financing Obligations to our Consolidated Financial Statements in Part II Item 8 of hereof for further information on the agreements governing our indebtedness.
Cash Flows from Operating Activities
Cash flows provided by operating activities, as reflected in the Consolidated Statements of Cash Flows, were $523.2 million, $537.4 million and $431.7 million during the years ended December 31, 2018, December 31, 2017 and December 31, 2016, respectively. Operating cashflows in 2018 compared to 2017 were negatively affected by higher cash interest payments and higher cash taxes related to the sale of assets, offset by improved operating results from the increase in attendance.
Cash Flows from Investing Activities
Cash used in investing activities, as reflected in the Consolidated Statement of Cash Flows, were $317.2 million, $959.3 million and $1,331.5 million during the years ended December 31, 2018, December 31, 2017, and December 31, 2016, respectively. Cash outflows from investing activities for capital expenditures during the years ended December 31, 2018, December 31, 2017, and December 31, 2016 that were $576.3 million, $626.8 million and $421.7 million, respectively. Our capital expenditures primarily consisted of strategic growth initiatives and remodels, maintaining our theatre circuit, and technology upgrades. During the year ended December 31, 2018, cash inflows from investing activities included the proceeds from the Screenvision merger of $45.8 million, proceeds from sale leaseback transactions of $50.1 million, and proceeds from the disposition of NCM units of $162.5 million. During the year ended December 31, 2017, cash outflows from investing activities included the acquisition of Nordic, net of cash and restricted cash, of $577.6 million, proceeds from sale leaseback transactions of $136.2 million and proceeds from disposition of NCM units of $89.0 million. We expect that our net cash outflows for capital expenditures will be approximately $450.0 million for calendar 2019.
In November 2016, we paid $415.6 million for our acquisition of Odeon and UCI Cinemas, net of cash acquired. In December 2016, we paid $497.8 million for our acquisition of Carmike Cinemas, net of cash acquired.
During the year ended December 31, 2017, we received proceeds from divestitures of $25.1 million for the sale of theatres as required by the Department of Justice related to the Carmike acquisition, $4.0 million for the sale of an aircraft acquired with the Carmike acquisition, $2.9 million for the sale of administrative buildings acquired with the Carmike acquisition, partially offset by disbursements of $11.0 million for the sale of one theatre acquired with the Odeon acquisition as required by the United Kingdom’s Competition and Markets Authority. We also received net proceeds of $14.0 million from the sale of our investment in Open Road of which $9.2 million is classified as an investing activity and $4.8 million is classified as an operating activity for collection of amounts due from Open Road.
67
During the year ended December 31, 2016, we received proceeds from the sale of our shares in RealD Inc. of $13.5 million and proceeds from the sale of two Starplex divestiture theatres of $5.4 million.
During the year ended December 31, 2018, we received proceeds from the sale of a theatre partnership of $4.1 million and proceeds from the disposition of two theatres of $7.9 million.
We fund the costs of constructing, maintaining and remodeling our theatres through existing cash balances, cash generated from operations, landlord contributions, or borrowed funds, as necessary. We generally lease our theatres pursuant to long-term, non-cancelable operating leases which may require the developer, who owns the property, to reimburse us for the construction costs. We may decide to own the real estate assets of new theatres and following construction, sell and leaseback the real estate assets pursuant to long-term non-cancelable operating leases.
Cash Flows from Financing Activities
Cash flows provided by (used in) financing activities, as reflected in the Consolidated Statement of Cash Flows, were $(194.8) million, $492.3 million, and $918.2 million during the years ended December 31, 2018, December 31, 2017, and December 31, 2016, respectively.
Stock Repurchase. During the year ended December 31, 2018, we repurchased 500,000 shares of our Class A common stock under our share repurchase program for a total consideration of $8.3 million. We paid $13.5 million for treasury stock purchased at the end of 2017 and settled during January 2018. As of December 31, 2018, $44.3 million remains available for repurchase under the program authorized by our Board of Directors in August 2017. We intend to continue to repurchase shares under this program, which will be dependent on a number of factors, including the price of our common stock. Although we may continue to repurchase shares, there is no assurance that we will repurchase up to the full amount remaining under the program. During the year ended December 31, 2018, we repurchased 3,232,625 shares of our Class A common stock under our share repurchase program for a total consideration of $47.5 million.
We made tax payments for restricted stock units withholdings of $1.7 million and $6.5 million during the year ended December 31, 2018 and December 31, 2017, respectively.
Convertible Notes due 2024. On September 14, 2018, we issued $600.0 million aggregate principal amount of our 2.95% Senior Unsecured Convertible Notes due 2024. We capitalized deferred financing costs of approximately $13.6 million, related to the issuance of the Convertible Notes due 2024. The Convertible Notes due 2024 mature on September 15, 2024, unless earlier converted, repurchased or redeemed. We will pay interest on the Convertible Notes due 2024 at 2.95% per annum, semi-annually in arrears on March 15th and September 15th, commencing on March 15, 2019. We used the net proceeds from the Notes due 2027 to repurchase and retire 24,057,143 shares of Class B common stock from Wanda and to pay a special dividend.
Wanda Class B Common Shares Repurchase. On September 14, 2018, we used the net proceeds from the Convertible Notes due 2024 private offering to repurchase and retire 24,057,143 shares of Class B common stock for $423.6 million.
Special Dividend. On September 14, 2018, we declared a special dividend which was paid on September 28, 2018 to shareholders of record on September 25, 2018 of $1.55 per share, or approximately $160.5 million.
Additional Public Offering. On February 13, 2017, we completed an additional public offering of 20,330,874 shares of Class A common stock at a price of $31.50 per share ($640.4 million), resulting in net proceeds of $616.8 million after underwriters commission and other professional fees. We used a portion of the net proceeds to repay the aggregate principal amount of the Interim Bridge Loan of $350.0 million and general corporate purposes.
Notes due 2027. On March 17, 2017, we completed an offering of $475.0 million aggregate principal amount of our Senior Subordinated Notes due 2027 (the “Notes due 2027”). We capitalized deferred financing costs of approximately $19.8 million, related to the issuance of the Notes due 2027. The Notes due 2027 mature on May 15, 2027. We will pay interest on the Notes due 2027 at 6.125% per annum, semi-annually in arrears on May 15th and November 15th, commencing on November 15, 2017. We used the net proceeds from the Notes due 2027, together with a portion of the net proceeds from the Sterling Notes due 2024 (see below) to pay a portion of the consideration for the acquisition of Nordic plus related transaction fees and expenses.
68
Additional Sterling Notes due 2024. On March 17, 2017, we completed an offering of £250.0 million ($327.8 million) additional aggregate principal amount of our Sterling Notes due 2024 at 106% plus accrued interest from November 8, 2016. We capitalized deferred financing costs of approximately $12.7 million, related to the issuance of the additional Sterling Notes due 2024. The Sterling Notes due 2024 mature on November 15, 2024. We will pay interest on the Sterling Notes due 2024 at 6.375% per annum, semi-annually in arrears on May 15th and November 15th, commencing on May 15, 2017. We used the net proceeds from the Sterling Notes due 2024, together with a portion of the net proceeds from the Notes due 2027 to pay a portion of the consideration for the acquisition of Nordic plus related transaction fees and expenses.
On March 28, 2017, we paid the Nordic SEK Term Loan of $144.4 million and we paid the Nordic EUR Term Loan of $169.5 million aggregate principal amount in connection with the acquisition of Nordic using proceeds from our Senior Subordinated Notes due 2027 and Sterling Notes due 2024.
Notes due 2026. On November 8, 2016, we completed an offering of $595.0 million aggregate principal amount of our Senior Subordinated Notes due 2026 (the “Notes due 2026”). We paid financing costs of approximately $27.0 million, related to the issuance of the Notes due 2026. The Notes due 2026 mature on November 15, 2026. We will pay interest on the Notes due 2026 at 5.875% per annum, semi-annually in arrears on May 15th and November 15th, commencing on May 15, 2017. We used the net proceeds from the Notes due 2026, together with a portion of the net proceeds from the Sterling Notes due 2024 and New Term Loan to pay the consideration for Odeon plus any related transaction fees and expenses.
Sterling Notes due 2024. On November 8, 2016, we completed an offering of £250.0 million ($310.0 million) aggregate principal amount of our Senior Subordinated Notes due 2024 (the “Sterling Notes due 2024”) in a private offering. We paid deferred financing costs of approximately $15.0 million, related to the issuance of the Sterling Notes due 2024. The Sterling Notes due 2024 mature on November 15, 2024. We will pay interest on the Sterling Notes due 2024 at 6.375% per annum, semi-annually in arrears on May 15th and November 15th, commencing on May 15, 2017. We used the net proceeds from the Sterling Notes due 2024 private offering, together with a portion of the net proceeds from the Sterling Notes due 2024 and New Term Loan to pay the consideration for Odeon and UCI Cinemas Holdings Limited plus any related transaction fees and expenses.
Senior Secured Credit Agreement. On November 8, 2016, we amended our Senior Secured Credit Agreement dated April 30, 2013, as previously amended, to among other things, lower the applicable margin on base rate borrowings from 2.25% to 2.00% and the applicable margin on LIBOR borrowings from 3.25% to 2.75%, to reduce the minimum rate for base rate borrowings from 1.75% to 1.00% and the minimum rate for LIBOR rate borrowings and to allow for additional term loan borrowings of $500.0 million. On November 29, 2016, we borrowed $500.0 million additional Term loans issued at a discount of 0.25% due on December 15, 2023 (“Term Loan due 2023”). We paid deferred financing costs of approximately $18.8 million and a discount of 0.25%, or $1.3 million, related to the Term Loan due 2023. We used the net proceeds from the Term Loan due 2023 to pay the consideration for the Odeon acquisition and the related refinancing of Odeon debt assumed in the acquisition.
During 2016, we paid $75.0 million on our revolving credit facility. On December 11, 2015, AMC issued $125.0 million principal amount of additional term loans due 2022 at a discount under our amended Senior Secured Credit Agreement and borrowed $75.0 million on our revolving credit facility on December 16, 2015. Deferred financing costs paid related to the amendment to the Senior Secured Credit Agreement were $9.9 million.
Interim Bridge Loan. On December 21, 2016, we entered into a bridge loan agreement with Citicorp North America, Inc., as administrative agent and the other lenders party thereto (the “Bridge Loan Agreement”). We borrowed $350.0 million of interim bridge loans (the “Interim Bridge Loans”) on December 21, 2016 under the Bridge Loan Agreement and paid approximately $5.3 million in deferred financing costs. The proceeds of the Interim Bridge Loans were used to finance the acquisition of Carmike. We repaid the Interim Bridge Loans on February 13, 2017, with a portion of the net proceeds from our additional public offering.
Senior Secured Notes due 2023. On December 21, 2016, we assumed $230.0 million aggregate principal amount of 6.00% Senior Secured Notes due June 15, 2023 (the “Senior Secured Notes due 2023”) in connection with the acquisition of Carmike. Interest is payable on the Senior Secured Notes due 2023 on June 15th and December 15th of
69
each year beginning December 15, 2015. We recorded the debt at estimated fair value of $240.1 million based on a closing price for the Senior Secured Notes due 2023 of 105.25 on December 21, 2016.
On November 30, 2016, we paid the Odeon Notes of $380.7 million and $212.5 million aggregate principal amount in connection with the acquisition of Odeon using the proceeds from our Senior Secured Credit Agreement Term Loan due 2022 and the Sterling Notes due 2024.
As of December 31, 2018, we had no borrowings outstanding under our Revolving Credit Facility and $13.4 million in outstanding standby letters of credit in the ordinary course of business and we had $11.9 million of borrowings outstanding under our Odeon revolving credit facility and $21.2 million in outstanding standby letters of credit in the ordinary course of business.
See Note 8 – Corporate Borrowings and Capital and Financing Lease Obligations in the Notes to Consolidated Financial Statements under Part II, Item 8, hereof for further information.
Dividends
The following is a summary of dividends and dividend equivalents declared to stockholders:
|
|
|
|
|
|
|
Amount per |
|
Total Amount |
||
|
|
|
|
|
|
|
Share of |
|
Declared |
||
|
Declaration Date |
|
Record Date |
|
Date Paid |
|
Common Stock |
|
(In millions) |
||
|
February 28, 2018 |
|
March 12, 2018 |
|
March 26, 2018 |
|
$ |
0.20 |
|
$ |
26.0 |
|
May 3, 2018 |
|
June 11, 2018 |
|
June 25, 2018 |
|
|
0.20 |
|
|
26.0 |
|
July 24, 2018 |
|
September 10, 2018 |
|
September 24, 2018 |
|
|
0.20 |
|
|
25.8 |
|
September 14, 2018 |
|
September 25, 2018 |
|
September 28, 2018 |
|
|
1.55 |
|
|
162.9 |
|
November 1, 2018 |
|
December 10, 2018 |
|
December 26, 2018 |
|
|
0.20 |
|
|
21.2 |
|
February 14, 2017 |
|
March 13, 2017 |
|
March 27, 2017 |
|
|
0.20 |
|
|
26.2 |
|
April 27, 2017 |
|
June 5, 2017 |
|
June 19, 2017 |
|
|
0.20 |
|
|
26.5 |
|
August 3, 2017 |
|
September 11, 2017 |
|
September 25, 2017 |
|
|
0.20 |
|
|
26.5 |
|
October 27, 2017 |
|
December 4, 2017 |
|
December 18, 2017 |
|
|
0.20 |
|
|
25.9 |
On February 28, 2018, our Board of Directors declared a cash dividend in the amount of $0.20 per share of Class A and Class B common stock, paid on March 26, 2018 to stockholders of record on March 12, 2018. On May 3, 2018, our Board of Directors declared a cash dividend in the amount of $0.20 per share of Class A and Class B common stock, paid on June 25, 2018 to stockholders of record on June 11, 2018. On July 24, 2018, our Board of Directors declared a cash dividend in the amount of $0.20 per share of Class A and Class B common stock, paid on September 24, 2018 to stockholders of record on September 10, 2018. On September 14, 2018, our Board of Directors declared a cash dividend in the amount of $1.55 per share of Class A and Class B common stock, paid on September 28, 2018 to stockholders of record on September 25, 2018. On November 1, 2018, our Board of Directors declared a cash dividend in the amount of $0.20 per share of Class A and Class B common stock, paid on December 26, 2018 to stockholders of record on December 10, 2018.
During the years ended December 31, 2018, December 31, 2017, and December 31, 2016 we paid dividends and dividend equivalents of $258.1 million, $104.6 million, and $79.6 million, respectively. As of December 31, 2018, we accrued $4.0 million for the remaining unpaid dividends.
On February 15, 2019, we declared a cash dividend in the amount of $0.20 per share of Class A and Class B common stock, payable on March 25, 2019 to stockholders of record on March 11, 2019.
70
Commitments and Contingencies
Minimum annual cash payments required under existing capital and financing lease obligations, maturities of corporate borrowings, future minimum rental payments under existing operating leases, committed capital expenditures, investments and betterments, including furniture, fixtures, equipment and leasehold betterments and ADA related betterments and pension funding that have initial or remaining non-cancelable terms in excess of one year as of December 31, 2018 are as follows:
|
|
|
Minimum |
|
|
|
|
|
|
|
|
|
|
|
|
|
|
|
|
|
|
|
|
|
|
|
Capital and |
|
Principal |
|
Interest |
|
Minimum |
|
|
|
|
|
|
|
|
|
|
||||
|
|
|
Financing |
|
Amount of |
|
Payments on |
|
Operating |
|
Capital |
|
|
|
|
|
|
|
|||||
|
(In millions) |
|
Lease |
|
Corporate |
|
Corporate |
|
Lease |
|
Related |
|
Pension |
|
Total |
|
|||||||
|
Calendar Year |
|
Payments |
|
Borrowings(1) |
|
Borrowings(2) |
|
Payments |
|
Betterments(3) |
|
Funding(4) |
|
Commitments |
|
|||||||
|
2019 |
|
$ |
100.7 |
|
$ |
15.2 |
|
$ |
255.9 |
|
$ |
810.2 |
|
$ |
122.2 |
|
$ |
4.2 |
|
$ |
1,308.4 |
|
|
2020 |
|
|
96.6 |
|
|
13.8 |
|
|
255.1 |
|
|
801.9 |
|
|
— |
|
|
— |
|
|
1,167.4 |
|
|
2021 |
|
|
87.8 |
|
|
13.8 |
|
|
254.5 |
|
|
748.9 |
|
|
— |
|
|
— |
|
|
1,105.0 |
|
|
2022 |
|
|
82.7 |
|
|
1,219.7 |
|
|
234.8 |
|
|
687.5 |
|
|
— |
|
|
— |
|
|
2,224.7 |
|
|
2023 |
|
|
70.4 |
|
|
701.3 |
|
|
183.2 |
|
|
597.1 |
|
|
— |
|
|
— |
|
|
1,552.0 |
|
|
Thereafter |
|
|
331.5 |
|
|
2,904.1 |
|
|
297.0 |
|
|
3,367.6 |
|
|
— |
|
|
— |
|
|
6,900.2 |
|
|
Total |
|
$ |
769.7 |
|
$ |
4,867.9 |
|
$ |
1,480.5 |
|
$ |
7,013.2 |
|
$ |
122.2 |
|
$ |
4.2 |
|
$ |
14,257.7 |
|
|
(1) |
Represents cash requirements for the payment of principal on corporate borrowings. Total amount does not equal carrying amount due to unamortized discounts, premiums and deferred charges. |
|
(2) |
Interest expense on our Senior Secured Credit Facility Term Loans due 2022 and Term Loans due 2023 was estimated at 4.7051% based on the interest rate in effect as of December 31, 2018. |
|
(3) |
Includes committed capital expenditures, investments, and betterments to our circuit. Does not include planned, but non-committed capital expenditures. |
|
(4) |
We fund our U.S. pension plans such that the plans are in compliance with Employee Retirement Income Security Act (“ERISA”) and the plans are not considered “at risk” as defined by ERISA guidelines. The U.S. plans have been frozen effective December 31, 2006. |
As of December 31, 2018, our recorded obligation for unrecognized tax benefits is $22.0 million. There are currently unrecognized tax benefits which we anticipate will be resolved in the next 12 months; however, we are unable at this time to estimate what the impact on our effective tax rate will be. See Note 10 – Income Taxes in the Notes to Consolidated Financial Statements under Part II, Item 8, hereof for further information.
We remain contingently liable for lease payments under certain leases of theatres that we previously divested, in the event that such assignees are unable to fulfill their future lease payment obligations. Due to the variety of remedies available, we believe that if the current tenant defaulted on the leases it would not have a material effect on our financial condition, results of operations or cash flows.
Impact of Inflation
Historically, the principal impact of inflation and changing prices upon us has been to increase the costs of the construction of new theatres, the purchase of theatre equipment, rent and the utility and labor costs incurred in connection with continuing theatre operations. Film exhibition costs, our largest cost of operations, are customarily paid as a percentage of admissions revenues and hence, while the film exhibition costs may increase on an absolute basis, the percentage of admissions revenues represented by such expense is not directly affected by inflation. Except as set forth above, inflation and changing prices have not had a significant impact on our total revenues and results of operations during the last three years.
Off-Balance Sheet Arrangements
We have no off-balance sheet arrangements.
71
New Accounting Pronouncements
See Note 1 – The Company and Significant Accounting Policies in Notes to the Consolidated Financial Statements under Part II, Item 8 hereof for information regarding recently issued accounting standards.
Item 7A. Quantitative and Qualitative Disclosures about Market Risk
In the ordinary course of business, our financial results are exposed to fluctuations in interest rates and foreign currency exchange rates. In accordance with applicable guidance, we presented a sensitivity analysis showing the potential impact to net income of changes in interest rates and foreign currency exchange rates. For the year ended December 31, 2018, our analysis utilized a hypothetical 100 basis-point increase or decrease to the average interest rate on our variable rate debt instruments to illustrate the potential impact to interest expense of changes in interest rates. For the year ended December 31, 2018, our analysis utilized a hypothetical 100 basis-point increase or decrease to market interest rates on our fixed rate debt instruments to illustrate the potential impact to fair value of changes in interest rates.
Similarly, for the same period, our analysis used a uniform and hypothetical 10% strengthening of the U.S. dollar versus the average exchange rates of applicable currencies to depict the potential impact to net income of changes in foreign exchange rates. These market risk instruments and the potential impacts to the consolidated statements of operations for the current year, have not materially fluctuated, individually or in the aggregate from the preceding year; thus, only current year information is presented below.
Market risk on variable-rate financial instruments. At December 31, 2018, we maintained a Senior Secured Credit Facility comprised of a $225.0 million revolving credit facility, $854.2 million of Senior Secured Term Loans due 2022 and $491.2 million of Senior Secured Term Loans due 2023. The Senior Secured Credit Facility provides for borrowings at a rate equal to an applicable margin plus, at our option, either a base rate or LIBOR + 2.25%. The rate in effect at December 31, 2018 for the outstanding Senior Secured Term Loans due 2022 and 2023 was 4.7051% per annum. Increases in market interest rates would cause interest expense to increase and earnings before income taxes to decrease. The change in interest expense and earnings before income taxes would be dependent upon the weighted average outstanding borrowings during the reporting period following an increase in market interest rates. At December 31, 2018, we had $11.9 million variable-rate borrowings outstanding under our revolving credit facilities and had an aggregate principal balance of $1,345.4 million outstanding under the Senior Secured Term Loans due 2022 and 2023. A 100-basis point change in market interest rates would have increased or decreased interest expense on the Senior Secured Credit Facility by $13.5 million during the year ended December 31, 2018.
Market risk on fixed-rate financial instruments. Included in long-term corporate borrowings at December 31, 2018 were principal amounts of $600.0 million of our Convertible Notes due 2024, $230.0 million of our Senior Secured Notes due 2023, $600.0 million of our Notes due 2025, $375.0 million of our Notes due 2022, $595.0 million of our Notes due 2026, $475.0 million of our Notes due 2027, and £500.0 million ($634.1 million) of our Sterling Notes due 2024. A 100-basis point change in market interest rates would have caused an increase or (decrease) in the fair value of our fixed rate financial instruments of approximately $166.8 million and ($156.6) million, respectively.
Foreign Currency Exchange Rate Risk. We are also exposed to market risk arising from changes in foreign currency exchange rates as a result of our ownership of Odeon and Nordic. Odeon’s revenues and operating expenses are transacted in British Pounds and Euros, and Nordic’s revenues and operating expenses are transacted primarily in Swedish Krona and Euros. U.S. GAAP requires that our subsidiaries use the currency of the primary economic environment in which they operate as their functional currency. If Odeon and Nordic operate in a highly inflationary economy, U.S. GAAP requires that the U.S. dollar be used as the functional currency for Odeon and Nordic. Currency fluctuations in the countries in which we operate result in us reporting exchange gains (losses) or foreign currency translation adjustments. Based upon our ownership in Odeon and Nordic as of December 31, 2018, holding everything else constant, a 10% immediate, simultaneous, favorable change in all of the foreign currency exchange rates to which we are exposed, would increase the aggregate net earnings of our International markets reportable segment for the year ended December 31, 2018 by approximately $1.3 million.
Our foreign currency translation rates decreased by approximately 3.1% for the year ended December 31, 2018 as compared to the year ended December 31, 2017, which did not significantly impact our net earnings for the year ended December 31, 2018.
72
Item 8. Financial Statements and Supplementary Data
MANAGEMENT’S ANNUAL REPORT ON INTERNAL CONTROL OVER FINANCIAL REPORTING
AMC Entertainment Holdings, Inc.
TO THE STOCKHOLDERS OF AMC ENTERTAINMENT HOLDINGS, INC.
Management is responsible for establishing and maintaining adequate internal control over financial reporting for the Company as defined in Rule 13a-15(f) of the Exchange Act. With management’s participation, an evaluation of the effectiveness of internal control over financial reporting was conducted as of December 31, 2018, based on the framework and criteria established in Internal Control—Integrated Framework (2013) issued by the Committee of Sponsoring Organizations of the Treadway Commission. Based on this evaluation, management has concluded that the Company’s internal control over financial reporting was effective as of December 31, 2018. The effectiveness of our internal control over financial reporting has been audited by KPMG LLP, an independent registered public accounting firm, as stated in their attestation report that follows this report.
|
/s/ Adam M. Aron |
|
|
Chief Executive Officer, Director and President |
|
|
|
|
|
|
|
|
/s/ Craig R. Ramsey |
|
|
Executive Vice President and Chief Financial Officer |
|
73
Report of Independent Registered Public Accounting Firm
To the Stockholders and Board of Directors
AMC Entertainment Holdings, Inc.:
Opinion on Internal Control Over Financial Reporting
We have audited AMC Entertainment Holdings, Inc. and subsidiaries’ (the “Company”) internal control over financial reporting as of December 31, 2018, based on criteria established in Internal Control – Integrated Framework (2013) issued by the Committee of Sponsoring Organizations of the Treadway Commission. In our opinion, the Company maintained, in all material respects, effective internal control over financial reporting as of December 31, 2018, based on criteria established in Internal Control – Integrated Framework (2013) issued by the Committee of Sponsoring Organizations of the Treadway Commission.
We also have audited, in accordance with the standards of the Public Company Accounting Oversight Board (United States) (“PCAOB”), the consolidated balance sheets of the Company as of December 31, 2018 and 2017, the related consolidated statements of operations, comprehensive income (loss), cash flows, and stockholders’ equity (deficit) for each of the years in the three-year period ended December 31, 2018 and the related notes (collectively, the “consolidated financial statements”), and our report dated February 28, 2019 expressed an unqualified opinion on those consolidated financial statements.
Basis for Opinion
The Company’s management is responsible for maintaining effective internal control over financial reporting and for its assessment of the effectiveness of internal control over financial reporting, included in the accompanying “Management’s Annual Report on Internal Control over Financial Reporting”. Our responsibility is to express an opinion on the Company’s internal control over financial reporting based on our audit. We are a public accounting firm registered with the PCAOB and are required to be independent with respect to the Company in accordance with the U.S. federal securities laws and the applicable rules and regulations of the Securities and Exchange Commission and the PCAOB.
We conducted our audit in accordance with the standards of the PCAOB. Those standards require that we plan and perform the audit to obtain reasonable assurance about whether effective internal control over financial reporting was maintained in all material respects. Our audit of internal control over financial reporting included obtaining an understanding of internal control over financial reporting, assessing the risk that a material weakness exists, and testing and evaluating the design and operating effectiveness of internal control based on the assessed risk. Our audit also included performing such other procedures as we considered necessary in the circumstances. We believe that our audit provides a reasonable basis for our opinion.
Definition and Limitations of Internal Control Over Financial Reporting
A company’s internal control over financial reporting is a process designed to provide reasonable assurance regarding the reliability of financial reporting and the preparation of financial statements for external purposes in accordance with generally accepted accounting principles. A company’s internal control over financial reporting includes those policies and procedures that (1) pertain to the maintenance of records that, in reasonable detail, accurately and fairly reflect the transactions and dispositions of the assets of the company; (2) provide reasonable assurance that transactions are recorded as necessary to permit preparation of financial statements in accordance with generally accepted accounting principles, and that receipts and expenditures of the company are being made only in accordance with authorizations of management and directors of the company; and (3) provide reasonable assurance regarding prevention or timely detection of unauthorized acquisition, use, or disposition of the company’s assets that could have a material effect on the financial statements.
Because of its inherent limitations, internal control over financial reporting may not prevent or detect misstatements. Also, projections of any evaluation of effectiveness to future periods are subject to the risk that controls may become
74
inadequate because of changes in conditions, or that the degree of compliance with the policies or procedures may deteriorate.
/s/ KPMG LLP
Kansas City, Missouri
February 28, 2019
75
Report of Independent Registered Public Accounting Firm
To the Stockholders and Board of Directors
AMC Entertainment Holdings, Inc.:
Opinion on the Consolidated Financial Statements
We have audited the accompanying consolidated balance sheets of AMC Entertainment Holdings, Inc. and subsidiaries (the “Company”) as of December 31, 2018 and 2017, the related consolidated statements of operations, comprehensive income (loss), cash flows, and stockholders’ equity (deficit) for each of the years in the three‑year period ended December 31, 2018, and the related notes (collectively, the “consolidated financial statements”). In our opinion, the consolidated financial statements present fairly, in all material respects, the financial position of the Company as of December 31, 2018 and 2017, and the results of its operations and its cash flows for each of the years in the three‑year period ended December 31, 2018, in conformity with U.S. generally accepted accounting principles.
We also have audited, in accordance with the standards of the Public Company Accounting Oversight Board (United States) (“PCAOB”), the Company’s internal control over financial reporting as of December 31, 2018, based on criteria established in Internal Control – Integrated Framework (2013) issued by the Committee of Sponsoring Organizations of the Treadway Commission, and our report dated February 28, 2019 expressed an unqualified opinion on the effectiveness of the Company’s internal control over financial reporting.
Change in Accounting Principle
As discussed in Note 1 to the consolidated financial statements, the Company has changed its method of accounting for the recognition of revenue and certain costs in the 2018 consolidated financial statements due to the adoption of Accounting Standards Codification 606, Revenue from Contracts with Customers.
Basis for Opinion
These consolidated financial statements are the responsibility of the Company’s management. Our responsibility is to express an opinion on these consolidated financial statements based on our audits. We are a public accounting firm registered with the PCAOB and are required to be independent with respect to the Company in accordance with the U.S. federal securities laws and the applicable rules and regulations of the Securities and Exchange Commission and the PCAOB.
We conducted our audits in accordance with the standards of the PCAOB. Those standards require that we plan and perform the audit to obtain reasonable assurance about whether the consolidated financial statements are free of material misstatement, whether due to error or fraud. Our audits included performing procedures to assess the risks of material misstatement of the consolidated financial statements, whether due to error or fraud, and performing procedures that respond to those risks. Such procedures included examining, on a test basis, evidence regarding the amounts and disclosures in the consolidated financial statements. Our audits also included evaluating the accounting principles used and significant estimates made by management, as well as evaluating the overall presentation of the consolidated financial statements. We believe that our audits provide a reasonable basis for our opinion.
/s/ KPMG LLP
We have served as the Company’s auditor since 2009.
Kansas City, Missouri
February 28, 2019
76
AMC ENTERTAINMENT HOLDINGS, INC.
CONSOLIDATED STATEMENTS OF OPERATIONS
|
|
|
Year Ended |
|||||||
|
(in millions, except share and per share amounts) |
|
December 31, 2018 |
|
December 31, 2017 |
|
December 31, 2016 |
|||
|
|
|
|
|
|
|
|
|
|
|
|
Revenues |
|
|
|
|
|
|
|
|
|
|
Admissions |
|
$ |
3,385.0 |
|
$ |
3,229.5 |
|
$ |
2,049.4 |
|
Food and beverage |
|
|
1,671.5 |
|
|
1,548.4 |
|
|
1,019.1 |
|
Other theatre |
|
|
404.3 |
|
|
301.3 |
|
|
167.4 |
|
Total revenues |
|
|
5,460.8 |
|
|
5,079.2 |
|
|
3,235.9 |
|
Operating costs and expenses |
|
|
|
|
|
|
|
|
|
|
Film exhibition costs |
|
|
1,710.2 |
|
|
1,604.3 |
|
|
1,089.5 |
|
Food and beverage costs |
|
|
270.9 |
|
|
252.1 |
|
|
142.2 |
|
Operating expense, excluding depreciation and amortization below |
|
|
1,654.7 |
|
|
1,548.0 |
|
|
873.5 |
|
Rent |
|
|
797.8 |
|
|
794.4 |
|
|
505.5 |
|
General and administrative: |
|
|
|
|
|
|
|
|
|
|
Merger, acquisition and transaction costs |
|
|
31.3 |
|
|
63.0 |
|
|
47.9 |
|
Other, excluding depreciation and amortization below |
|
|
179.3 |
|
|
133.2 |
|
|
90.0 |
|
Depreciation and amortization |
|
|
537.8 |
|
|
538.6 |
|
|
268.2 |
|
Impairment of long-lived assets |
|
|
13.8 |
|
|
43.6 |
|
|
5.5 |
|
Operating costs and expenses |
|
|
5,195.8 |
|
|
4,977.2 |
|
|
3,022.3 |
|
Operating income |
|
|
265.0 |
|
|
102.0 |
|
|
213.6 |
|
Other expense (income): |
|
|
|
|
|
|
|
|
|
|
Other expense (income) |
|
|
(108.1) |
|
|
(1.5) |
|
|
0.3 |
|
Interest expense: |
|
|
|
|
|
|
|
|
|
|
Corporate borrowings |
|
|
262.3 |
|
|
231.6 |
|
|
110.7 |
|
Capital and financing lease obligations |
|
|
38.5 |
|
|
42.4 |
|
|
10.8 |
|
Non-cash NCM exhibitor services agreement |
|
|
41.5 |
|
|
— |
|
|
— |
|
Equity in (earnings) loss of non-consolidated entities |
|
|
(86.7) |
|
|
185.2 |
|
|
(47.7) |
|
Investment income |
|
|
(6.2) |
|
|
(22.6) |
|
|
(10.2) |
|
Total other expense |
|
|
141.3 |
|
|
435.1 |
|
|
63.9 |
|
Earnings (loss) before income taxes |
|
|
123.7 |
|
|
(333.1) |
|
|
149.7 |
|
Income tax provision |
|
|
13.6 |
|
|
154.1 |
|
|
38.0 |
|
Net earnings (loss) |
|
$ |
110.1 |
|
|
(487.2) |
|
|
111.7 |
|
Earnings (loss) per share: |
|
|
|
|
|
|
|
|
|
|
Basic |
|
$ |
0.91 |
|
$ |
(3.80) |
|
$ |
1.13 |
|
Diluted |
|
$ |
0.41 |
|
$ |
(3.80) |
|
$ |
1.13 |
|
Average shares outstanding: |
|
|
|
|
|
|
|
|
|
|
Basic (in thousands) |
|
|
120,621 |
|
|
128,246 |
|
|
98,838 |
|
Diluted (in thousands) |
|
|
130,105 |
|
|
128,246 |
|
|
98,872 |
See Notes to Consolidated Financial Statements.
77
AMC ENTERTAINMENT HOLDINGS, INC.
CONSOLIDATED STATEMENTS OF COMPREHENSIVE INCOME (LOSS)
|
|
|
Year Ended |
|||||||
|
(in millions) |
|
December 31, 2018 |
|
December 31, 2017 |
|
December 31, 2016 |
|||
|
Net earnings (loss) |
|
$ |
110.1 |
|
$ |
(487.2) |
|
$ |
111.7 |
|
Other comprehensive income (loss) |
|
|
|
|
|
|
|
|
|
|
Unrealized foreign currency translation adjustment |
|
|
(127.7) |
|
|
131.7 |
|
|
(3.9) |
|
Realized loss on foreign currency transactions, net of tax |
|
|
1.0 |
|
|
— |
|
|
— |
|
Pension and other benefit adjustments: |
|
|
|
|
|
|
|
|
|
|
Net gain (loss) arising during the period, net of tax |
|
|
4.2 |
|
|
(3.0) |
|
|
(0.3) |
|
Marketable securities: |
|
|
|
|
|
|
|
|
|
|
Unrealized net holding gain arising during the period, net of tax |
|
|
— |
|
|
0.7 |
|
|
0.6 |
|
Realized net gain reclassified into investment income, net of tax |
|
|
— |
|
|
(0.4) |
|
|
(1.8) |
|
Equity method investees' cash flow hedge: |
|
|
|
|
|
|
|
|
|
|
Unrealized net holding gain (loss) arising during the period, net of tax |
|
|
0.2 |
|
|
— |
|
|
(0.3) |
|
Realized net loss (gain) reclassified into equity in earnings of non-consolidated entities, net of tax |
|
|
(2.2) |
|
|
(0.9) |
|
|
0.4 |
|
Other comprehensive income (loss) |
|
|
(124.5) |
|
|
128.1 |
|
|
(5.3) |
|
Total comprehensive income (loss) |
|
$ |
(14.4) |
|
$ |
(359.1) |
|
$ |
106.4 |
See Notes to Consolidated Financial Statements.
78
AMC ENTERTAINMENT HOLDINGS, INC.
|
(In millions, except share data) |
|
December 31, 2018 |
|
December 31, 2017 |
|
||
|
ASSETS |
|
|
|
|
|
|
|
|
Current assets: |
|
|
|
|
|
|
|
|
Cash and cash equivalents |
|
$ |
313.3 |
|
$ |
310.0 |
|
|
Restricted cash |
|
|
10.7 |
|
|
8.3 |
|
|
Receivables, net |
|
|
259.5 |
|
|
271.5 |
|
|
Assets held for sale |
|
|
— |
|
|
80.0 |
|
|
Other current assets |
|
|
197.8 |
|
|
202.6 |
|
|
Total current assets |
|
|
781.3 |
|
|
872.4 |
|
|
Property, net |
|
|
3,039.6 |
|
|
3,116.5 |
|
|
Intangible assets, net |
|
|
352.1 |
|
|
380.5 |
|
|
Goodwill |
|
|
4,788.7 |
|
|
4,931.7 |
|
|
Deferred tax asset, net |
|
|
28.6 |
|
|
28.9 |
|
|
Other long-term assets |
|
|
505.5 |
|
|
475.9 |
|
|
Total assets |
|
$ |
9,495.8 |
|
$ |
9,805.9 |
|
|
LIABILITIES AND STOCKHOLDERS’ EQUITY |
|
|
|
|
|
|
|
|
Current liabilities: |
|
|
|
|
|
|
|
|
Accounts payable |
|
$ |
452.6 |
|
$ |
569.6 |
|
|
Accrued expenses and other liabilities |
|
|
378.5 |
|
|
351.1 |
|
|
Deferred revenues and income |
|
|
414.8 |
|
|
401.0 |
|
|
Current maturities of corporate borrowings and capital and financing lease obligations |
|
|
82.2 |
|
|
87.7 |
|
|
Total current liabilities |
|
|
1,328.1 |
|
|
1,409.4 |
|
|
Corporate borrowings |
|
|
4,707.8 |
|
|
4,220.1 |
|
|
Capital and financing lease obligations |
|
|
493.2 |
|
|
578.9 |
|
|
Exhibitor services agreement |
|
|
564.0 |
|
|
530.9 |
|
|
Deferred tax liability, net |
|
|
41.6 |
|
|
49.6 |
|
|
Other long-term liabilities |
|
|
963.1 |
|
|
903.8 |
|
|
Total liabilities |
|
|
8,097.8 |
|
|
7,692.7 |
|
|
Commitments and contingencies |
|
|
|
|
|
|
|
|
Class A common stock (temporary equity) ($.01 par value, 75,712 shares issued; 38,943 shares outstanding as of December 31, 2018 and 112,817 shares issued; 76,048 shares outstanding as of December 31, 2017) |
|
|
0.4 |
|
|
0.8 |
|
|
Stockholders’ equity: |
|
|
|
|
|
|
|
|
Class A common stock ($.01 par value, 524,173,073 shares authorized; 55,401,325 shares issued and 51,705,469 outstanding as of December 31, 2018; 55,010,160 shares issued and 51,814,304 outstanding as of December 31, 2017) |
|
|
0.5 |
|
|
0.5 |
|
|
Class B common stock ($.01 par value, 75,826,927 shares authorized; 51,769,784 shares issued and outstanding as of December 31, 2018 and 75,826,927 shares authorized; 75,826,927 shares issued and outstanding as of December 31, 2017) |
|
|
0.5 |
|
|
0.8 |
|
|
Additional paid-in capital |
|
|
1,998.4 |
|
|
2,241.6 |
|
|
Treasury stock (3,732,625 shares as of December 31, 2018 and 3,232,625 shares as of December 31, 2017, at cost) |
|
|
(56.4) |
|
|
(48.2) |
|
|
Accumulated other comprehensive income |
|
|
5.5 |
|
|
125.6 |
|
|
Accumulated deficit |
|
|
(550.9) |
|
|
(207.9) |
|
|
Total stockholders’ equity |
|
|
1,397.6 |
|
|
2,112.4 |
|
|
Total liabilities and stockholders’ equity |
|
$ |
9,495.8 |
|
$ |
9,805.9 |
|
See Notes to Consolidated Financial Statements.
79
AMC ENTERTAINMENT HOLDINGS, INC.
CONSOLIDATED STATEMENTS OF CASH FLOWS
|
|
|
Year Ended |
|||||||
|
|
|
December 31, |
|
December 31, |
|
December 31, |
|||
|
|
|
2018 |
|
2017 |
|
2016 |
|||
|
Cash flows from operating activities: |
|
|
|
|
|
|
|
|
|
|
Net earnings (loss) |
|
$ |
110.1 |
|
$ |
(487.2) |
|
$ |
111.7 |
|
Adjustments to reconcile net earnings (loss) to net cash provided by operating activities: |
|
|
|
|
|
|
|
|
|
|
Depreciation and amortization |
|
|
537.8 |
|
|
538.6 |
|
|
268.2 |
|
Loss on NCM charged to merger, acquisition and transaction costs |
|
|
— |
|
|
22.6 |
|
|
— |
|
Loss on extinguishment of debt |
|
|
— |
|
|
0.5 |
|
|
— |
|
Deferred income taxes |
|
|
(6.4) |
|
|
157.8 |
|
|
34.1 |
|
Impairment of long-lived assets |
|
|
13.8 |
|
|
43.6 |
|
|
5.5 |
|
Amortization of net premium on corporate borrowings |
|
|
0.2 |
|
|
(2.7) |
|
|
0.2 |
|
Amortization of deferred charges to interest expense |
|
|
16.0 |
|
|
12.7 |
|
|
6.1 |
|
Theatre and other closure expense |
|
|
2.7 |
|
|
3.0 |
|
|
5.2 |
|
Non-cash portion of stock-based compensation |
|
|
14.9 |
|
|
5.7 |
|
|
4.9 |
|
Gain on dispositions |
|
|
(3.2) |
|
|
(2.5) |
|
|
(2.4) |
|
(Gain) loss on disposition of NCM |
|
|
(30.6) |
|
|
22.6 |
|
|
— |
|
Gain on sale of Open Road |
|
|
— |
|
|
(17.2) |
|
|
— |
|
Gain on derivative asset and derivative liability |
|
|
(111.4) |
|
|
— |
|
|
— |
|
Repayment of Nordic interest rate swaps |
|
|
— |
|
|
(2.6) |
|
|
— |
|
Equity in earnings from non-consolidated entities, net of distributions |
|
|
(40.0) |
|
|
(3.9) |
|
|
(15.4) |
|
NCM held-for-sale impairment loss |
|
|
16.0 |
|
|
208.0 |
|
|
— |
|
Landlord contributions |
|
|
127.6 |
|
|
133.3 |
|
|
125.1 |
|
Deferred rent |
|
|
(101.6) |
|
|
(52.9) |
|
|
(33.7) |
|
Net periodic benefit cost |
|
|
1.1 |
|
|
0.6 |
|
|
0.7 |
|
Change in assets and liabilities, excluding acquisitions: |
|
|
|
|
|
|
|
|
|
|
Receivables |
|
|
(0.2) |
|
|
(36.6) |
|
|
(56.7) |
|
Other assets |
|
|
(0.4) |
|
|
(4.8) |
|
|
(29.1) |
|
Accounts payable |
|
|
(85.6) |
|
|
34.7 |
|
|
21.5 |
|
Accrued expenses and other liabilities |
|
|
68.5 |
|
|
(21.4) |
|
|
(18.4) |
|
Other, net |
|
|
(6.1) |
|
|
(14.5) |
|
|
4.2 |
|
Net cash provided by operating activities |
|
|
523.2 |
|
|
537.4 |
|
|
431.7 |
|
Cash flows from investing activities: |
|
|
|
|
|
|
|
|
|
|
Capital expenditures |
|
|
(576.3) |
|
|
(626.8) |
|
|
(421.7) |
|
Acquisition of Nordic Cinemas Group, net of cash and restricted cash acquired |
|
|
— |
|
|
(577.6) |
|
|
— |
|
Acquisition of Odeon and UCI Cinemas Limited, net of cash and restricted cash acquired |
|
|
— |
|
|
— |
|
|
(415.6) |
|
Acquisition of Carmike Cinemas, Inc., net of cash and restricted cash acquired |
|
|
— |
|
|
— |
|
|
(497.8) |
|
Acquisition of Starplex Cinemas |
|
|
— |
|
|
— |
|
|
0.7 |
|
Proceeds from sale leaseback transactions |
|
|
50.1 |
|
|
136.2 |
|
|
— |
|
Proceeds from disposition of NCM |
|
|
162.5 |
|
|
89.0 |
|
|
— |
|
Proceeds from Screenvision merger |
|
|
45.8 |
|
|
— |
|
|
— |
|
Proceeds from disposition of Open Road |
|
|
— |
|
|
9.2 |
|
|
— |
|
Proceeds from theatre partnership |
|
|
— |
|
|
|
|
|
|
|
Proceeds from disposition of long-term assets |
|
|
14.2 |
|
|
24.1 |
|
|
19.9 |
|
Investments in non-consolidated entities, net |
|
|
(11.4) |
|
|
(11.1) |
|
|
(10.5) |
|
Other, net |
|
|
(2.1) |
|
|
(2.3) |
|
|
(6.5) |
|
Net cash used in investing activities |
|
|
(317.2) |
|
|
(959.3) |
|
|
(1,331.5) |
|
Cash flows from financing activities: |
|
|
|
|
|
|
|
|
|
|
Proceeds from issuance of Term Loan due 2023 |
|
|
— |
|
|
— |
|
|
498.7 |
|
Proceeds from issuance of Senior Unsecured Convertible Notes due 2024 |
|
|
600.0 |
|
|
— |
|
|
— |
|
Proceeds from issuance of Senior Subordinated Sterling Notes due 2024 |
|
|
— |
|
|
327.8 |
|
|
310.0 |
80
|
Proceeds from issuance of Senior Subordinated Notes due 2026 |
|
|
— |
|
|
— |
|
|
595.0 |
|
Proceeds from issuance of Senior Subordinated Notes due 2027 |
|
|
— |
|
|
475.0 |
|
|
— |
|
Proceeds from issuance of bridge loan due 2017 |
|
|
— |
|
|
— |
|
|
350.0 |
|
Payment of Odeon Senior Subordinated GBP Notes due 2018 |
|
|
— |
|
|
— |
|
|
(380.7) |
|
Payment of Odeon Senior Subordinated EUR Notes due 2018 |
|
|
— |
|
|
— |
|
|
(212.5) |
|
Payment of Nordic SEK Term Loan |
|
|
— |
|
|
(144.4) |
|
|
— |
|
Payment of Nordic EUR Term Loan |
|
|
— |
|
|
(169.5) |
|
|
— |
|
Net proceeds from equity offering |
|
|
— |
|
|
616.8 |
|
|
— |
|
Borrowings (repayments) under revolving credit facilities |
|
|
12.1 |
|
|
— |
|
|
(75.0) |
|
Principal payment of Bridge Loan due 2017 |
|
|
— |
|
|
(350.0) |
|
|
— |
|
Payment of stock issuance offering costs |
|
|
— |
|
|
— |
|
|
(0.8) |
|
Principal payments under Term Loan |
|
|
(13.8) |
|
|
(12.6) |
|
|
(8.8) |
|
Principal payments under capital and financing lease obligations |
|
|
(71.0) |
|
|
(70.7) |
|
|
(10.8) |
|
Principal payments under promissory note |
|
|
(1.4) |
|
|
(1.4) |
|
|
(1.4) |
|
Cash used to pay for deferred financing costs |
|
|
(15.5) |
|
|
(33.6) |
|
|
(65.9) |
|
Cash used to pay dividends |
|
|
(258.1) |
|
|
(104.6) |
|
|
(79.6) |
|
Taxes paid for restricted unit withholdings |
|
|
(1.7) |
|
|
(6.5) |
|
|
— |
|
Retirement of Class B common stock |
|
|
(423.6) |
|
|
— |
|
|
— |
|
Purchase of treasury stock |
|
|
(21.8) |
|
|
(34.0) |
|
|
— |
|
Net cash provided by (used in) financing activities |
|
|
(194.8) |
|
|
492.3 |
|
|
918.2 |
|
Effect of exchange rate changes on cash and cash equivalents and restricted cash |
|
|
(5.5) |
|
|
17.7 |
|
|
0.6 |
|
Net increase in cash and cash equivalents and restricted cash |
|
|
5.7 |
|
|
88.1 |
|
|
19.0 |
|
Cash and cash equivalents and restricted cash at beginning of period |
|
|
318.3 |
|
|
230.2 |
|
|
211.2 |
|
Cash and cash equivalents and restricted cash at end of period |
|
$ |
324.0 |
|
$ |
318.3 |
|
$ |
230.2 |
|
SUPPLEMENTAL DISCLOSURES OF CASH FLOW INFORMATION: |
|
|
|
|
|
|
|
|
|
|
Cash paid during the period for: |
|
|
|
|
|
|
|
|
|
|
Interest (including amounts capitalized of $0.5 million, $0.3 million, and $0.2 million) |
|
$ |
278.3 |
|
$ |
226.7 |
|
$ |
105.4 |
|
Income taxes paid, net |
|
$ |
19.5 |
|
$ |
10.9 |
|
|
4.7 |
|
Schedule of non-cash activities: |
|
|
|
|
|
|
|
|
|
|
Investment in NCM (See Note 6 - Investments) |
|
$ |
(6.3) |
|
$ |
235.2 |
|
$ |
— |
|
Construction payables at period end |
|
$ |
100.8 |
|
$ |
82.7 |
|
$ |
86.9 |
|
Accrued treasury stock payable at period end |
|
$ |
— |
|
$ |
13.5 |
|
$ |
— |
See Notes to Consolidated Financial Statements.
81
AMC ENTERTAINMENT HOLDINGS, INC.
CONSOLIDATED STATEMENTS OF STOCKHOLDERS’ EQUITY (DEFICIT)
|
|
|
|
|
|
|
|
|
|
|
|
|
|
|
|
|
|
|
Accumulated |
|
|
|
|
|
|
|
|
|
|
Class A Voting |
|
Class B Voting |
|
Additional |
|
|
|
|
Other |
|
Accumulated |
|
Total |
||||||||||
|
|
|
Common Stock |
|
Common Stock |
|
Paid-in |
|
Treasury |
|
Comprehensive |
|
Earnings |
|
Stockholders’ |
|||||||||||
|
(In millions, except share and per share data) |
|
Shares |
|
Amount |
|
Shares |
|
Amount |
|
Capital |
|
Stock |
|
Income (Loss) |
|
(Deficit) |
|
Equity |
|||||||
|
Balance December 31, 2015 |
|
21,445,090 |
|
|
0.2 |
|
75,826,927 |
|
|
0.8 |
|
|
1,182.9 |
|
|
(0.7) |
|
|
2.8 |
|
|
352.7 |
|
|
1,538.7 |
|
Net earnings |
|
— |
|
|
— |
|
— |
|
|
— |
|
|
— |
|
|
— |
|
|
— |
|
|
111.7 |
|
|
111.7 |
|
Other comprehensive loss |
|
— |
|
|
— |
|
— |
|
|
— |
|
|
— |
|
|
— |
|
|
(5.3) |
|
|
— |
|
|
(5.3) |
|
Dividends declared |
|
|
|
|
|
|
|
|
|
|
|
|
|
|
|
|
|
|
|
|
|
|
|
|
|
|
Class A common stock, $0.20/share |
|
— |
|
|
— |
|
— |
|
|
— |
|
|
— |
|
|
— |
|
|
— |
|
|
(19.3) |
|
|
(19.3) |
|
Class B common stock, $0.20/share |
|
— |
|
|
— |
|
— |
|
|
— |
|
|
— |
|
|
— |
|
|
— |
|
|
(60.7) |
|
|
(60.7) |
|
RSUs surrendered to pay for payroll taxes |
|
— |
|
|
— |
|
— |
|
|
— |
|
|
(0.5) |
|
|
— |
|
|
— |
|
|
— |
|
|
(0.5) |
|
Stock-based compensation |
|
38,000 |
|
|
— |
|
— |
|
|
— |
|
|
4.9 |
|
|
— |
|
|
— |
|
|
— |
|
|
4.9 |
|
Reclassification from temporary equity |
|
27,197 |
|
|
— |
|
— |
|
|
— |
|
|
0.2 |
|
|
— |
|
|
— |
|
|
— |
|
|
0.2 |
|
Wanda capital contribution |
|
— |
|
|
— |
|
— |
|
|
— |
|
|
10.0 |
|
|
— |
|
|
— |
|
|
— |
|
|
10.0 |
|
Issuance of common stock related to Odeon and UCI Cinemas Holdings Limited acquisition, net of issuance costs |
|
4,536,466 |
|
|
— |
|
— |
|
|
— |
|
|
156.4 |
|
|
— |
|
|
— |
|
|
— |
|
|
156.4 |
|
Issuance of common stock related to Carmike Cinemas, Inc. acquisition, net of issuance costs |
|
8,189,808 |
|
|
0.1 |
|
— |
|
|
— |
|
|
273.4 |
|
|
— |
|
|
— |
|
|
— |
|
|
273.5 |
|
Balance December 31, 2016 |
|
34,236,561 |
|
$ |
0.3 |
|
75,826,927 |
|
$ |
0.8 |
|
$ |
1,627.3 |
|
$ |
(0.7) |
|
$ |
(2.5) |
|
$ |
384.4 |
|
$ |
2,009.6 |
|
Net loss |
|
— |
|
|
— |
|
— |
|
|
— |
|
|
— |
|
|
— |
|
|
— |
|
|
(487.2) |
|
|
(487.2) |
|
Other comprehensive income |
|
— |
|
|
— |
|
— |
|
|
— |
|
|
— |
|
|
— |
|
|
128.1 |
|
|
— |
|
|
128.1 |
|
Dividends declared |
|
|
|
|
|
|
|
|
|
|
|
|
|
|
|
|
|
|
|
|
|
|
|
|
|
|
Class A common stock, $0.20/share |
|
— |
|
|
— |
|
— |
|
|
— |
|
|
— |
|
|
— |
|
|
— |
|
|
(44.4) |
|
|
(44.4) |
|
Class B common stock, $0.20/share |
|
— |
|
|
— |
|
— |
|
|
— |
|
|
— |
|
|
— |
|
|
— |
|
|
(60.7) |
|
|
(60.7) |
|
Additional offering |
|
20,330,874 |
|
|
0.2 |
|
— |
|
|
— |
|
|
616.6 |
|
|
— |
|
|
— |
|
|
— |
|
|
616.8 |
|
RSUs surrendered to pay for payroll taxes |
|
— |
|
|
— |
|
— |
|
|
— |
|
|
(6.5) |
|
|
— |
|
|
— |
|
|
— |
|
|
(6.5) |
|
Stock-based compensation |
|
415,528 |
|
|
— |
|
— |
|
|
— |
|
|
3.9 |
|
|
— |
|
|
— |
|
|
— |
|
|
3.9 |
|
Share repurchases |
|
— |
|
|
— |
|
— |
|
|
— |
|
|
— |
|
|
(47.5) |
|
|
— |
|
|
— |
|
|
(47.5) |
|
Reclassification from temporary equity |
|
27,197 |
|
|
— |
|
— |
|
|
— |
|
|
0.3 |
|
|
— |
|
|
— |
|
|
— |
|
|
0.3 |
|
Balance December 31, 2017 |
|
55,010,160 |
|
$ |
0.5 |
|
75,826,927 |
|
$ |
0.8 |
|
$ |
2,241.6 |
|
$ |
(48.2) |
|
$ |
125.6 |
|
$ |
(207.9) |
|
$ |
2,112.4 |
|
Cumulative effect adjustments for the adoption of new accounting principles (AS 606, ASU 2016-01 and ASU 2018-02) |
|
— |
|
|
— |
|
— |
|
|
— |
|
|
— |
|
|
— |
|
|
4.4 |
|
|
(36.2) |
|
|
(31.8) |
|
Net earnings |
|
— |
|
|
— |
|
— |
|
|
— |
|
|
— |
|
|
— |
|
|
— |
|
|
110.1 |
|
|
110.1 |
|
Other comprehensive loss |
|
— |
|
|
— |
|
— |
|
|
— |
|
|
— |
|
|
— |
|
|
(124.5) |
|
|
— |
|
|
(124.5) |
|
Dividends declared: |
|
|
|
|
|
|
|
|
|
|
|
|
|
|
|
|
|
|
|
|
|
|
|
|
|
|
Class A common stock, $0.20/share |
|
— |
|
|
— |
|
— |
|
|
— |
|
|
— |
|
|
— |
|
|
— |
|
|
(42.9) |
|
|
(42.9) |
|
Class B common stock, $0.20/share |
|
— |
|
|
— |
|
— |
|
|
— |
|
|
— |
|
|
— |
|
|
— |
|
|
(55.9) |
|
|
(55.9) |
|
Reversed dividend accrual for nonvested PSU's |
|
— |
|
|
— |
|
— |
|
|
— |
|
|
— |
|
|
— |
|
|
— |
|
|
0.5 |
|
|
0.5 |
|
Special dividend declared: |
|
|
|
|
|
|
|
|
|
|
|
|
|
|
|
|
|
|
|
|
|
|
|
|
|
82
|
Class A common stock, $1.55/share |
|
— |
|
|
— |
|
— |
|
|
— |
|
|
— |
|
|
— |
|
|
— |
|
|
(82.7) |
|
|
(82.7) |
|
Class B common stock, $1.55/share |
|
— |
|
|
— |
|
— |
|
|
— |
|
|
— |
|
|
— |
|
|
— |
|
|
(80.3) |
|
|
(80.3) |
|
RSUs surrendered to pay for payroll taxes |
|
326,005 |
|
|
— |
|
— |
|
|
— |
|
|
(1.8) |
|
|
— |
|
|
— |
|
|
— |
|
|
(1.8) |
|
Stock-based compensation |
|
28,055 |
|
|
— |
|
— |
|
|
— |
|
|
14.9 |
|
|
— |
|
|
— |
|
|
— |
|
|
14.9 |
|
Share repurchases |
|
— |
|
|
— |
|
— |
|
|
— |
|
|
— |
|
|
(8.2) |
|
|
— |
|
|
— |
|
|
(8.2) |
|
Reclassification from temporary equity |
|
37,105 |
|
|
— |
|
— |
|
|
— |
|
|
0.4 |
|
|
— |
|
|
— |
|
|
— |
|
|
0.4 |
|
Class B common stock repurchase and cancellation |
|
— |
|
|
— |
|
(24,057,143) |
|
|
(0.3) |
|
|
(256.7) |
|
|
— |
|
|
— |
|
|
(155.6) |
|
|
(412.6) |
|
Balance December 31, 2018 |
|
55,401,325 |
|
$ |
0.5 |
|
51,769,784 |
|
$ |
0.5 |
|
$ |
1,998.4 |
|
$ |
(56.4) |
|
$ |
5.5 |
|
$ |
(550.9) |
|
$ |
1,397.6 |
See Notes to Consolidated Financial Statements
83
AMC ENTERTAINMENT HOLDINGS, INC.
NOTES TO CONSOLIDATED FINANCIAL STATEMENTS
Years Ended December 31, 2018, 2017, 2016
NOTE 1 – THE COMPANY AND SIGNIFICANT ACCOUNTING POLICIES
AMC Entertainment Holdings, Inc. (“Holdings”), through its direct and indirect subsidiaries, including American Multi-Cinema, Inc. and its subsidiaries, (collectively with Holdings, unless the context otherwise requires, the “Company” or “AMC”), is principally involved in the theatrical exhibition business and owns, operates or has interests in theatres located in the United States and Europe. Holdings is an indirect subsidiary of Dalian Wanda Group Co., Ltd. (“Wanda”), a Chinese private conglomerate.
On March 31, 2016, AMC Entertainment Inc. merged with and into Holdings, its direct parent company. In connection with the merger, Holdings assumed all of the obligations pursuant to the indentures to the 5.875% Senior Subordinated Notes due 2022 (“Notes due 2022”), the 5.75% Senior Subordinated Notes due 2025 (“Notes due 2025”) and the Credit Agreement, dated as of April 30, 2013 (as subsequently amended).
As of December 31, 2018, Wanda owned approximately 50.01% of Holdings’ outstanding common stock and 75.01% of the combined voting power of Holdings’ outstanding common stock and has the power to control Holdings’ affairs and policies, including with respect to the election of directors (and, through the election of directors, the appointment of management), entering into mergers, sales of substantially all of the Company’s assets and other extraordinary transactions.
Use of Estimates: The preparation of financial statements in conformity with U.S. generally accepted accounting principles requires management to make estimates and assumptions that affect the reported amounts of assets and liabilities and disclosure of contingent assets and liabilities at the date of the consolidated financial statements and the reported amounts of revenues and expenses during the reporting period. Actual results could differ from those estimates.
Principles of Consolidation: The consolidated financial statements include the accounts of Holdings and all subsidiaries, as discussed above. All significant intercompany balances and transactions have been eliminated in consolidation. There are no noncontrolling (minority) interests in the Company’s consolidated subsidiaries; consequently, all of its stockholders’ equity, net earnings (loss) and comprehensive income (loss) for the periods presented are attributable to controlling interests. The Company manages its business under two reportable segments for its theatrical exhibition operations, U.S. markets and International markets.
Revenues: The Company recognizes revenue, net of sales tax, when it satisfies a performance obligation by transferring control over a product or service to a customer. Admissions and food and beverage revenues are recognized at a point in time when a film is exhibited to a customer and when a customer takes possession of food and beverage offerings. The Company defers 100% of the revenue associated with the sales of gift cards and exchange tickets until such time as the items are redeemed or estimated income from non-redemption is recorded.
The Company recognizes income from non-redeemed or partially redeemed gift cards in proportion to the pattern of rights exercised by the customer (“proportional method”) where it applies an estimated non-redemption rate for its gift card sales channels, which range from 12% to 18% of the current month sales, and the Company recognizes in other theatre revenues the total amount of expected income for non-redemption for that current month’s sales as income over the next 24 months in proportion to the pattern of actual redemptions. The Company has determined its non-redeemed rates and redemption patterns using data accumulated over ten years. Prior to January 1, 2018, income for non-redeemed exchange tickets were recognized 18 months after purchase when the redemption of these items was determined to be remote. At January 1, 2018, the Company changed its method for recognizing income from non-redeemed exchange tickets to the proportional method, where it applies a non-redemption rate of 10% to the current month sales, and the Company recognizes the total amount of income for that current month’s sales as income over the next 24 months in proportion to the pattern of actual redemptions. Management believes the 24-month estimate is supported by its continued development of redemption history and that it is reflective of management’s current best
84
estimate. The adoption of the proportional method of recognizing income from non-redeemed exchange tickets did not have a material impact on the Company’s consolidated financial statements.
Prior to January 1, 2018, the Company recorded online ticket fee revenues net of third-party commission or service fees. In accordance with ASC 606 guidance, the Company believes that it is a principal (as opposed to agent) in the arrangement with third-party internet ticketing companies in regard to the sale of online tickets because the Company controls the online tickets before they are transferred to the customer. Upon adoption of ASC 606 on January 1, 2018, the Company recognizes ticket fee revenues based on a gross transaction price. The online ticket fee revenues and the third-party commission or service fees are recorded in the line items other theatre revenues and operating expense, respectively, in the consolidated statements of operations. These changes did not have any impact on net income or cash flows from operations.
Film Exhibition Costs: Film exhibition costs are accrued based on the applicable box office receipts and estimates of the final settlement to the film licensors. Film exhibition costs include certain advertising costs. As of December 31, 2018 and December 31, 2017, the Company recorded film payables of $168.6 million and $229.4 million, respectively, which are included in accounts payable in the accompanying Consolidated Balance Sheets.
Food and Beverage Costs: The Company records rebate payments from vendors as a reduction of food and beverage costs when earned.
Exhibitor Services Agreement: The Company recognizes advertising revenues, which are included in other theatre revenues in the consolidated statements of operations, when it satisfies a performance obligation by transferring a promised good or service to the customers. The advertising contracts with customers generally consist of a series of distinct periods of service, satisfied over time, to provide rights to advertising services. The Company’s ESA with NCM includes a significant financing component due to the significant length of time between receiving the non-cash consideration and fulfilling the performance obligation. The Company receives the non-cash consideration in the form of common membership units from NCM, in exchange for rights to exclusive access to the Company’s theatre screens and attendees through February 2037. Upon adoption of ASC 606, the Company’s advertising revenues have significantly increased with a similar offsetting increase in non-cash interest expense, which is recorded to non-cash NCM exhibitor service agreement in the consolidated statements of operations. Upon adoption of ASC 606 and pursuant to the calculation requirements for the time value of money, the amortization method reflects the front-end loading of the significant financing component where more interest expense is recognized earlier during the term of the agreement than the back-end recognition of the deferred revenue amortization where more revenue is recognized later in the term of the agreement. See Note 6 – Investments for further information regarding the common unit adjustment and the fair value measurement of the non-cash consideration. The interest expense was calculated using discount rates that ranged from 6.5% to 8.5%, which are the rates at which the Company believes it could borrow in separate financing transactions. The Company recognized a cumulative effect transition adjustment of initially applying ASC 606 by increasing accumulated deficit on January 1, 2018 by approximately $52.9 million, including income tax effect of $0, as a result of this change. These changes did not have any impact on the Company’s cash flows from operations.
Customer Frequency Program: AMC Stubs® is a customer loyalty program which allows members to earn rewards, receive discounts and participate in exclusive members-only offerings and services. It features both a traditional paid tier called AMC Stubs PremiereTM, with a $15.00 annual membership fee, and a non-paid tier called AMC Stubs InsiderTM. Both programs reward loyal guests for their patronage of AMC Theatres. Rewards earned are redeemable on future purchases at AMC locations. Once an AMC Stubs PremiereTM or AMC Stubs InsiderTM member accumulates 5,000 points they will earn a $5.00 virtual reward.
The portion of the admissions and food and beverage revenues attributed to the rewards is deferred as a reduction of admissions and food and beverage revenues and is allocated between admissions and food and beverage revenues based on expected member redemptions. Upon redemption, deferred rewards are recognized as revenues along with associated cost of goods. Converted rewards not redeemed within nine months are forfeited and recognized as admissions or food and beverage revenues. Prior to January 1, 2018, rewards for expired memberships were forfeited based upon specified periods of inactivity of the membership and recognized as admissions or food and beverage revenues. As of January 1, 2018, the Company changed its method for recognizing forfeited rewards from the remote method to the proportional method, where the Company estimates point breakage in assigning value to the points at the time of sale based on historical trends. The program’s annual membership fee is allocated to the material rights for discounted or free products and services and is initially deferred, net of estimated refunds, and recognized as the rights
85
are redeemed based on estimated utilization, over the one-year membership period in admissions, food and beverage, and other revenues. A portion of the revenues related to a material right are deferred as a virtual rewards performance obligation using the relative standalone selling price method and are recognized as the rights are redeemed or expire.
On June 20, 2018, the Company announced the launch of AMC Stubs® A-List, a new tier of our AMC Stubs® loyalty program. This program offers guests admission to movies at AMC up to three times per week including multiple movies per day and repeat visits to already seen movies from $19.95 to $23.95 per month depending upon geographic market. Revenue is recognized ratably over the enrollment period.
Advertising Costs: The Company expenses advertising costs as incurred and does not have any direct-response advertising recorded as assets. Advertising costs were $45.4 million, $39.9 million, and $10.1 million for the years ended December 31, 2018, December 31, 2017, and December 31, 2016, respectively, and are recorded in operating expense in the accompanying consolidated statements of operations.
Cash and Equivalents: All highly liquid debt instruments and investments purchased with an original maturity of three months or less are classified as cash equivalents.
Derivative Asset and Liability: The Company remeasures the derivative asset related to its contingent call option to acquire shares of its Class B Common Stock at no additional cost and the derivative liability related to the conversion feature in its Convertible Notes due 2024 at fair value each reporting period with changes in fair value recorded in the consolidated statement of operations. The Company has obtained independent third-party valuation studies to assist in determining fair value. The Company’s valuation studies use a Monte Carlo simulation approach and are based on significant inputs not observable in the market and thus represent level 3 measurements within the fair value measurement hierarchy. The Company’s common stock price at the end of each reporting period as well as the remaining amount of time until expiration for the contingent call option and conversion feature are key inputs for the estimation of fair value that are expected to change each reporting period. The Company recorded other income related to increases in its derivative asset fair value of $45.0 million and other income related to decreases in its derivative liability fair value of $66.4 million during the year ended December 31, 2018. See Note 8 – Corporate Borrowings and Capital and Financing Lease Obligations, Note 9 – Stockholders’ Equity and Note 15 – Fair Value Measurements for further discussions.
Intangible Assets: Intangible assets were recorded at fair value, in the case of intangible assets resulting from the acquisition of Holdings by Wanda on August 30, 2012 and other theatre acquisitions. Intangible assets are comprised of amounts assigned to theatre leases acquired under favorable terms, management contracts, a contract with an equity method investee, and a non-compete agreement, each of which are being amortized on a straight-line basis over the estimated remaining useful lives of the assets. Trademark and trade names are considered either definite or indefinite-lived intangible assets. Indefinite-lived intangible assets are not amortized but rather evaluated for impairment annually.
The Company first assesses the qualitative factors to determine whether the existence of events and circumstances indicate that it is more likely than not the fair value of an indefinite-lived intangible asset is less than its carrying amount as a basis for determining whether it is necessary to perform the quantitative impairment test. There were no intangible asset impairment charges incurred during the years ended December 31, 2018, December 31, 2017, and December 31, 2016.
Investments: The Company accounts for its investments in non-consolidated entities using either the cost or equity methods of accounting as appropriate, and has recorded the investments within other long-term assets in its Consolidated Balance Sheets. Equity earnings and losses are recorded when the Company’s ownership interest provides the Company with significant influence. The Company follows the guidance in ASC 323-30-35-3, which prescribes the use of the equity method for investments where the Company has significant influence. The Company classifies gains and losses on sales of investments or impairments accounted for using the cost method in investment income. Gains and losses on cash sales are recorded using the weighted average cost of all interests in the investments. Gains and losses related to non-cash negative common unit adjustments are recorded using the weighted average cost of those units in NCM. See Note 6 – Investments for further discussion of the Company’s investments in NCM. As of December 31, 2018, the Company holds equity method investments comprised of a 18.4% interest in SV Holdco LLC (“SV Holdco”), a joint venture that markets and sells cinema advertising and promotions through Screenvision; a 50% interest in Digital CineMedia Ltd. (“DCM”), a joint venture that provides advertising services in International markets; a 32.0% interest in AC JV, LLC (“AC JV”), a joint venture that owns Fathom Events offering alternative content for motion picture screens; a 29% interest in DCIP, a joint venture charged with implementing digital cinema in the Company’s theatres; a 14.6%
86
interest in DCDC, a satellite distribution network for feature films and other digital cinema content; a 50% ownership interest in four U.S. motion picture theatres and one IMAX® screen; and approximately 50% ownership interest in 58 theatres in Europe acquired in the Nordic acquisition. Indebtedness held by equity method investees is non-recourse to the Company.
Goodwill: Goodwill represents the excess of purchase price over fair value of net tangible and identifiable intangible assets related to the acquisition of Holdings by Wanda on August 30, 2012 and subsequent theatre business acquisitions. The Company is not required to amortize goodwill as a charge to earnings; however, the Company is required to conduct an annual review of goodwill for impairment.
The Company’s recorded goodwill was $4,788.7 million and $4,931.7 million as of December 31, 2018 and December 31, 2017, respectively. The Company evaluates goodwill and its indefinite-lived trademark and trade names for impairment annually as of the beginning of the fourth quarter or more frequently as specific events or circumstances dictate. The Company’s goodwill is recorded in each of its three reporting units for its Domestic Theatres, Odeon Theatres, and Nordic Theatres.
The Company performed its annual impairment analysis during the fourth quarter of calendar 2018 and the third quarter and fourth quarter of calendar 2017 and reached a determination that there was no goodwill or trademark and trade name impairment. According to Accounting Standards Codification (“ASC”) 350-20, the Company has an option to first assess the qualitative factors to determine whether it is more likely than not that the fair value of its reporting unit is less than its carrying amount as a basis for determining whether it is necessary to perform the two-step goodwill impairment test. As of October 1, 2018, the Company performed a step 1 quantitative goodwill impairment test on the Odeon and Nordic reporting units and reached a determination that it is not more likely than not that the fair value of the Company’s reporting units are less than their carrying values, and therefore, no impairment charge was incurred. As of December 31, 2018, the Company assessed qualitative factors for all three reporting units and reached a determination that it is not more likely than not that the fair value of the Company’s reporting units are less than their carrying values, and therefore no impairment charge was incurred. During the fourth quarter of calendar 2017, and as of December 31, 2017, the Company assessed qualitative factors of all three reporting units and reached a determination that it is not more likely than not that the fair value of the Company’s reporting units are less than their carrying values, and therefore, no impairment charge was incurred.
Other Long-term Assets: Other long-term assets are comprised principally of investments in partnerships and joint ventures, costs incurred in connection with the Company’s line-of-credit revolving credit arrangement, which is being amortized to interest expense using the effective interest rate method over the respective life of the issuance, and capitalized computer software, which is amortized over the estimated useful life of the software. See Note 7 – Supplemental Balance Sheet Information.
Accounts Payable: Under the Company’s cash management system, checks issued but not presented to banks frequently result in book overdraft balances for accounting purposes and are classified within accounts payable in the balance sheet. The change in book overdrafts are reported as a component of operating cash flows for accounts payable as they do not represent bank overdrafts. The amount of these checks included in accounts payable as of December 31, 2018 and December 31, 2017 was $42.6 million and $72.8 million, respectively.
Leases: The majority of the Company’s operations are conducted in premises occupied under lease agreements with initial base terms ranging generally from 12 to 15 years, with certain leases containing options to extend the leases for up to an additional 20 years. The Company typically does not believe that exercise of the renewal options are reasonably assured at the inception of the lease agreements and, therefore, considers the initial base term as the lease term. Lease terms vary but generally the leases provide for fixed and escalating rentals, contingent escalating rentals based on the Consumer Price Index not to exceed certain specified amounts and contingent rentals based on revenues.
The Company records rent expense for its operating leases on a straight-line basis over the initial base lease term commencing with the date the Company has “control and access” to the leased premises, which is generally a date prior to the “lease commencement date” in the lease agreement. Rent expense related to any “rent holiday” is recorded as operating expense, until construction of the leased premises is complete and the premises are ready for their intended use. Rent charges upon completion of the leased premises subsequent to the date the premises are ready for their intended use are expensed as a component of rent expense.
87
The Company often receives contributions from landlords for renovations at existing locations. The Company records the amounts received from landlords as deferred rent and amortizes the balance as a reduction to rent expense over the base term of the lease agreement.
The Company evaluates the classification of its leases following the guidance in ASC 840-10-25. Leases that qualify as capital leases are generally recorded at the present value of the future minimum rentals over the base term of the lease using the Company’s incremental borrowing rate. Capital lease assets are assigned an estimated useful life at the inception of the lease that generally corresponds with the base term of the lease.
Occasionally, the Company or other theatre operators it has acquired are responsible for the construction of new leased theatres (build-to-suit lease arrangements) and for paying project costs that are in excess of an agreed upon amount to be reimbursed from the developer. ASC 840-40-05-5 requires the Company to be considered the owner (for accounting purposes) of these types of projects during the construction period and therefore it is required to account for these projects as sale and leaseback transactions. As a result, the Company has recorded financing lease obligations for failed sale leaseback transactions of $427.4 million and $499.6 million in its Consolidated Balance Sheets related to these types of projects as of December 31, 2018 and December 31, 2017, respectively.
During the year ended December 31, 2018, the Company modified the terms of an existing operating lease to reduce the lease term. The Company received a $35.0 million incentive from the landlord to enter into the new lease agreement. The Company has recorded amortization of the lease incentive as a reduction to rent expense on a straight-line basis over the remaining lease term which reduced rent expense by $35.0 million during the year ended December 31, 2018.
Sale and Leaseback Transactions: The Company accounts for the sale and leaseback of real estate assets in accordance with ASC 840-40. Losses on sale leaseback transactions are recognized at the time of sale if the fair value of the property sold is less than the net book value of the property. Gains on sale and leaseback transactions are deferred and amortized over the remaining lease term. On June 18, 2018, the Company completed the sale and leaseback of the real estate assets associated with one theatre for proceeds, net of closing costs of $50.1 million. The gain on the sale of approximately $27.3 million has been deferred and will be amortized over the remaining lease term. On September 14, 2017, the Company completed the sale and leaseback of the real estate assets associated with seven theatres for proceeds net of closing costs of $128.4 million. The gain on sale of approximately $78.2 million has been deferred and will be amortized over the remaining lease term. On December 18, 2017, the Company completed the sale and leaseback of the real estate assets associated with one theatre for proceeds net of closing costs of $7.8 million. The loss on sale of $0.5 million was recognized immediately. Unamortized deferred gains related to these transactions were $98.0 million as of December 31, 2018.
Impairment of Long-lived Assets: The Company reviews long-lived assets, including definite-lived intangibles, investments in non-consolidated equity method investees, and internal use software for impairment whenever events or changes in circumstances indicate that the carrying amount of the asset group may not be fully recoverable. The Company identifies impairments related to internal use software when management determines that the remaining carrying value of the software will not be realized through future use. The Company reviews internal management reports on a quarterly basis as well as monitors current and potential future competition in the markets where it operates for indicators of triggering events or circumstances that indicate potential impairment of individual theatre assets. The Company evaluates theatres using historical and projected data of theatre level cash flow as its primary indicator of potential impairment and considers the seasonality of its business when making these evaluations. The Company performs its impairment analysis quarterly. Under these analyses, if the sum of the estimated future cash flows, undiscounted and without interest charges, are less than the carrying amount of the asset group, an impairment loss is recognized in the amount by which the carrying value of the asset group exceeds its estimated fair value. Assets are evaluated for impairment on an individual theatre basis, which management believes is the lowest level for which there are identifiable cash flows. The impairment evaluation is based on the estimated cash flows from continuing use until the expected disposal date for the fair value of Property, net. The expected disposal date does not exceed the remaining lease period unless it is probable existing renewal options will be exercised and may be less than the remaining lease period when the Company does not expect to operate the theatre to the end of its lease term. The fair value of assets is determined as either the expected selling price less selling costs (where appropriate) or the present value of the estimated future cash flows.
88
There is considerable management judgment necessary to determine the estimated future cash flows and fair values of the Company’s theatres and other long-lived assets, and, accordingly, actual results could vary significantly from such estimates, which fall under Level 3 within the fair value measurement hierarchy, see Note 15 – Fair Value Measurements.
During calendar 2018, the Company recognized an impairment loss of $13.8 million on 13 theatres in the U.S. markets with 150 screens and 15 theatres with 118 screens in the international markets which was related to property, net. During calendar 2017, the Company recognized an impairment loss of $43.6 million on 12 theatres in the U.S. markets with 179 screens which was related to property, net. During calendar 2016, the Company recognized an impairment loss of $5.5 million on two theatres in the U.S. markets with 22 screens, which was related to property, net.
Foreign Currency Translation: Operations outside the United States are generally measured using the local currency as the functional currency. Assets and liabilities are translated at the rates of exchange at the balance sheet date. Income and expense items are translated at average rates of exchange. The resultant translation adjustments are included in foreign currency translation adjustment, a separate component of accumulated other comprehensive income (loss). Gains and losses from foreign currency transactions, except those intercompany transactions of a long-term investment nature, and the Company’s £500.0 million, 6.375% Senior Subordinated Notes due 2024, which have been designated as a non-derivative net investment hedge of the Company’s investment in Odeon and UCI Cinemas Holdings Limited (“Odeon”) are not included in net earnings. If the Company substantially liquidates its investment in a foreign entity, any gain or loss on currency translation balance recorded in accumulated other comprehensive income (loss) is recognized as part of a gain or loss on disposition.
Income and Operating Taxes: The Company accounts for income taxes in accordance with ASC 740-10. Under ASC 740-10, deferred income tax effects of transactions reported in different periods for financial reporting and income tax return purposes are recorded by the asset and liability method. This method gives consideration to the future tax consequences of deferred income or expense items and recognizes changes in income tax laws in the period of enactment. The statement of operations effect is generally derived from changes in deferred income taxes on the balance sheet.
Holdings and its domestic subsidiaries file a consolidated U.S. federal income tax return and combined income tax returns in certain state jurisdictions. Foreign subsidiaries file income tax returns in foreign jurisdictions. Income taxes are determined based on separate Company computations of income or loss. Tax sharing arrangements are in place and utilized when tax benefits from affiliates in the consolidated group are used to offset what would otherwise be taxable income generated by Holdings or another affiliate.
Casualty Insurance: The Company is self-insured for general liability up to $1.0 million per occurrence and carries a $0.5 million deductible limit per occurrence for workers’ compensation claims. The Company utilizes actuarial projections of its ultimate losses to calculate its reserves and expense. The actuarial method includes an allowance for adverse developments on known claims and an allowance for claims which have been incurred but which have not yet been reported. As of December 31, 2018 and December 31, 2017, the Company recorded casualty insurance reserves of $24.9 million and $28.1 million. The Company recorded expenses related to general liability and workers’ compensation claims of $25.1 million, of $22.1 million, and $15.6 million for the years ended December 31, 2018, December 31, 2017, and December 31, 2016, respectively. Casualty insurance expense is recorded in operating expense.
89
Other Expense (Income): The following table sets forth the components of other expense (income):
|
|
|
Year Ended |
|||||||
|
|
|
December 31, |
|||||||
|
(In millions) |
|
2018 |
|
2017 |
|
2016 |
|||
|
Derivative liability fair value adjustment for embedded conversion feature in the Convertible Notes due 2024 |
|
$ |
(66.4) |
|
$ |
— |
|
$ |
— |
|
Derivative asset fair value adjustment for contingent call option related to the Class B common stock purchase and cancellation agreement |
|
|
(45.0) |
|
|
— |
|
|
— |
|
Business interruption insurance recoveries |
|
|
— |
|
|
(0.4) |
|
|
(0.4) |
|
Loss on GBP forward contract |
|
|
0.4 |
|
|
— |
|
|
— |
|
Foreign currency transactions (gains) losses |
|
|
1.4 |
|
|
(3.0) |
|
|
— |
|
Non-operating components of net periodic benefit cost |
|
|
0.8 |
|
|
0.2 |
|
|
0.7 |
|
Loss on extinguishment of Bridge Loan |
|
|
— |
|
|
0.4 |
|
|
— |
|
Fees related to modification of term loans |
|
|
0.4 |
|
|
— |
|
|
— |
|
Third party fees relating to Third Amendment to our Senior Secured Credit Agreement |
|
|
— |
|
|
1.0 |
|
|
— |
|
Other |
|
|
0.3 |
|
|
0.3 |
|
|
— |
|
Other expense (income) |
|
$ |
(108.1) |
|
$ |
(1.5) |
|
$ |
0.3 |
Accounting Pronouncements Recently Adopted
Revenue from Contracts with Customers. The Company adopted the guidance of Accounting Standards Codification (“ASC”) 606, Revenue from Contracts with Customers, (“ASC 606”) as of January 1, 2018 using the modified retrospective method. ASC 606 requires an entity to recognize the amount of revenue to which it expects to be entitled for the transfer of promised goods or services to customers. The Company recognized the cumulative effect of initially applying the new revenue standard as an adjustment to the opening balance of accumulated deficit. ASC 606 was applied only to contracts that were not completed at January 1, 2018. The comparative information in the prior year has not been adjusted and continues to be reported under ASC 605, Revenue Recognition, which was the accounting standard in effect for those periods. See Note 2 – Revenue Recognition for the required disclosures of the nature, amount, timing, and uncertainty of revenue and cash flows arising from contracts with customers per the guidance in ASC 606.
Reclassification of Certain Tax Effects. In February 2018, the FASB issued ASU No. 2018-02, Income Statement – Reporting Comprehensive Income (Topic 220): Reclassification of Certain Tax Effects from Accumulated Other Comprehensive Income (“ASU 2018-02”), which allows a reclassification from accumulated other comprehensive income to accumulated deficit for stranded tax effects resulting from the U.S. Tax Cuts and Jobs Act signed into law in December 2017. ASU 2018-02 is effective for the Company on January 1, 2019 and early adoption of the amendments is permitted, including adoption in any interim period. The Company early adopted ASU 2018-02, effective January 1, 2018, and recorded a reclassification related to the stranded tax effects that increased accumulated other comprehensive income and increased accumulated deficit by $5.0 million in the consolidated balance sheets as of January 1, 2018. See Note 17 – Accumulated other comprehensive income for further information.
Modification Accounting for Stock-Based Compensation. In May 2017, the FASB issued ASU No. 2017-09, Compensation—Stock Compensation (Topic 718): Scope of Modification Accounting (“ASU 2017-09”), which amends the scope of modification accounting for share-based payment arrangements and provides guidance on the types of changes to the terms or conditions of the share-based payment awards to which an entity would be required to apply modification accounting under ASC 718. The amendments in ASU 2017-09 should be applied prospectively to an award modified on or after the adoption date. The Company adopted ASU 2017-09 on January 1, 2018 and will apply the guidance in ASU 2017-09 to any future changes to the terms or conditions of stock-based payment awards should they occur. The Company’s adoption of ASU 2017-09 did not have an impact on its consolidated financial statements.
Improving Presentation of Net Benefit Costs. In March 2017, the FASB issued ASU No. 2017-07, Compensation – Retirement Benefits (Topic 715): Improving the Presentation of Net Periodic Pension Cost and Net Periodic Postretirement Benefit Cost (“ASU 2017-07”). The guidance requires the service cost component of defined benefit pension plans and other post-retirement benefit plans to be reported in the same line item as other compensation costs arising from the services rendered by the pertinent employees while the other components of net benefit cost are required to be presented in the income statement separately from the service cost component and reported outside a
90
subtotal of operating income. The amendments in this guidance should be applied retrospectively for the presentation of the service cost component and the other components of net benefit cost in the consolidated statements of operations. The Company adopted ASU 2017-07 effective January 1, 2018 and recorded a prior period adjustment for the year ended December 31, 2017 in the consolidated statements of operations to decrease general and administrative other by $0.2 million, related to the other components of net benefit cost, with a corresponding increase to other expense (income) and decrease to other income of $0.2 million, respectively. The adoption of this guidance did not have a material impact on the Company’s consolidated financial statements.
Restricted Cash in Statement of Cash Flows. In November 2016, the FASB issued ASU No. 2016-18, Statement of Cash Flows (Topic 230): Restricted Cash (A Consensus of the FASB Emerging Issues Task Force) (“ASU 2016-18”). ASU 2016-18 requires that restricted cash be included with cash and cash equivalents when reconciling the beginning and end-of-period total amounts shown on the statement of cash flows. This guidance must be applied retrospectively to all periods presented. The Company adopted ASU 2016-18 effective January 1, 2018 and the prior period has been adjusted to conform to the current period presentation. This guidance also requires a new disclosure to reconcile the cash balances within the consolidated statement of cash flows to the consolidated balance sheets. The following table provides a reconciliation of cash and cash equivalents and restricted cash reported within the consolidated balance sheets that sum to the total of the amounts shown in the consolidated statements of cash flows:
|
(In millions) |
|
December 31, 2018 |
|
December 31, 2017 |
|
December 31, 2016 |
|||
|
Cash and cash equivalents |
|
$ |
313.3 |
|
$ |
310.0 |
|
$ |
207.1 |
|
Restricted cash |
|
|
10.7 |
|
|
8.3 |
|
|
23.1 |
|
Total cash and cash equivalents and restricted cash shown in the consolidated statements of cash flows |
|
$ |
324.0 |
|
$ |
318.3 |
|
$ |
230.2 |
Classification of certain cash receipts and cash payments. In August 2016, the FASB issued ASU No. 2016-15, Statement of Cash Flows (Topic 230): Classification of Certain Cash Receipts and Cash Payments (“ASU 2016-15”). The amendments in this update provide guidance on eight specific cash flow classification issues. The update provides specific guidance on each of the eight issues, thereby reducing the diversity in practice in how certain transactions are classified in the statement of cash flows. The Company adopted ASU 2016-15 on January 1, 2018 and made an election to continue using the “nature of the distribution approach” to classify distributions received from equity method investments. The adoption of this guidance did not have an impact on the Company’s consolidated statements of cash flows.
Classification and measurement of financial instruments. In January 2016, the FASB issued ASU No. 2016-01, Financial Instruments – Overall (Subtopic 825-10): Recognition and Measurement of Financial Assets and Financial Liabilities (“ASU 2016-01”). ASU 2016-01 amends various aspects of the recognition, measurement, presentation, and disclosure of financial instruments. The amendments require that equity investments (except those accounted for under the equity method of accounting or those that result in consolidation of the investee) are to be measured at fair value with changes in fair value recognized in net income. However, an entity may choose to measure equity investments that do not have readily determinable fair values at cost minus impairment, if any, plus or minus changes resulting from observable price changes in orderly transactions for the identical or a similar investment of the same issuer. The Company adopted ASU 2016-01 on January 1, 2018 and recorded a decrease to accumulated other comprehensive income of $0.6 million, net of tax, related to the unrealized gains on available-for-sale securities that are equity instruments with a corresponding decrease to accumulated deficit in the consolidated balance sheets as of the beginning of the year. The adoption of this guidance did not have a material impact on the Company’s consolidated financial statements.
91
Accounting Pronouncements Issued Not Yet Adopted
Leases. In February 2016, the FASB issued ASU No. 2016-02, Leases, (“ASC 842”) which requires lessees to recognize leases on-balance sheet and disclose key information about leasing arrangements. The new standard establishes a right-of-use model (“ROU”) that requires a lessee to recognize a ROU asset and lease liability on the balance sheet for all leases with a term longer than 12 months. Leases will be classified as finance or operating, with classification affecting the pattern and classification of expense recognition in the income statement. The new standard is effective for the Company on January 1, 2019, with early adoption permitted. The Company adopted the guidance on January 1, 2019, using a modified retrospective transition approach with the cumulative effect recognized at the date of initial application, whereby comparative prior period financial information and disclosures will not be adjusted to reflect the new standard. In January 2018, the FASB issued ASU No. 2018-01, Leases, which permits an entity to elect an optional transition practical expedient to not evaluate under ASU 842 land easements that exist or expired before the entity’s adoption of ASC 842 and that were not previously accounted for as leases.
ASC 842 provides several optional practical expedients in transition. The Company expects to elect the package of practical expedients, which permits the Company not to reassess under the new standard its prior conclusions about lease identification, lease classification and initial direct costs. In addition, the Company expects to elect the practical expedient pertaining to land easements but does not expect to elect the use-of-hindsight practical expedient.
ASC 842 also provides practical expedients for an entity’s ongoing accounting. The Company expects to elect the practical expedient to not separate lease and non-lease components for all of its leases. The Company also expects to elect the short-term practical expedient for all leases that qualify. As a result, the Company will not recognize right-of-use assets or liabilities for short-term leases for leases that qualify for the short-term practical expedient, but instead will recognize the lease payments as lease cost on a straight-line basis over the lease term.
The Company expects that this standard will have a material effect on its consolidated financial statements. While the Company is finalizing the effect of adoption, the Company expects the most significant changes relate to (1) the recognition of new ROU assets and lease liabilities on its balance sheet for theatres currently subject to operating leases adjusted for the balances of prepaid rent, favorable lease assets and unfavorable lease liabilities, and deferred rent; (2) the derecognition of existing assets and liabilities for certain sale leaseback transactions (those arising from build-to-suit lease arrangements for which construction is complete and the Company is leasing the constructed asset) that currently do not qualify for sale accounting and the recognition of new ROU assets and operating lease liabilities on its balance sheet; (3) the derecognition of deferred gains from the sale and leaseback transactions; and (4) providing new disclosures about the Company’s leasing activities. On January 1, 2019, the Company expects to recognize additional operating lease liabilities ranging from an estimated $5 billion to $6 billion, with corresponding ROU assets based on the present value of the remaining minimum rental payments using preliminary estimates of discount rates for the Company’s existing operating leases. The Company has not finalized the effects of these expected changes from the new standard.
Financial Instruments. In June 2016, the FASB issued ASU 2016-13, Financial Instruments – Credit Losses (Topic 326): Measurement of Credit Losses on Financial Instruments (“ASU 2016-13”), which provides new guidance regarding the measurement and recognition of credit impairment for certain financial assets. Such guidance will impact how the Company determines its allowance for estimated uncollectible receivables and evaluates its available-for-sale investments for impairment. ASU 2016-13 is effective for the Company in the first quarter of 2020, with early adoption permitted in the first quarter of 2019. The Company is currently evaluating the effect that ASU 2016-13 will have on its consolidated financial statements and related disclosures.
Fair Value Measurement. In August 2018, the FASB issued ASU 2018-13, Fair Value Measurement (Topic 820): Disclosure Framework–Changes to the Disclosure Requirements for Fair Value Measurement (“ASU 2018-13”), which eliminates, adds, and modifies certain disclosure requirements for fair value measurements as part of its disclosure framework project. Entities will no longer be required to disclose the amount of and reasons for transfers between Level 1 and Level 2 of the fair value hierarchy, but will be required to disclose the range and weighted average used to develop significant unobservable inputs for Level 3 fair value measurements. ASU 2018-13 is effective for the Company in the first quarter of 2020. Early adoption is permitted. The Company is currently evaluating the effect that ASU 2018-13 will have on its fair value measurement disclosures.
92
Cloud Computing Arrangement. In August 2018, the FASB issued ASU 2018-15, Intangibles–Goodwill and Other–Internal-Use Software (Subtopic 350-40): Customer’s Accounting for Implementation Costs Incurred in a Cloud Computing Arrangement That Is a Service Contract (“ASU 2018-15”). ASU 2018-15 requires a customer in a cloud computing arrangement (i.e., hosting arrangement) that is a service contract to follow the internal-use software guidance in ASC 350-40 to determine which implementation, setup, and other upfront costs to capitalize as assets or expense as incurred. ASU 2018-15 is effective for the Company in the first quarter of 2020. Early adoption is permitted. Entities have the option to apply the guidance prospectively to all implementation costs incurred after the date of adoption or retrospectively in accordance with ASC 250-10-45. The Company is currently evaluating the effect that ASU 2018-15 will have on its consolidated financial statements.
NOTE 2 – REVENUE RECOGNITION
The Company adopted ASC 606 on January 1, 2018 using the modified retrospective method; and therefore, the comparative information has not been adjusted for the year ended December 31, 2017.
The cumulative effect of the changes made to the consolidated balance sheet at January 1, 2018 for the adoption of ASC 606, are included in the following table:
|
(In millions) |
|
Balance at |
|
Adjustments Due to ASC 606 |
|
Balance at |
|||
|
Assets: |
|
|
|
|
|
|
|
|
|
|
Other long-term assets |
|
$ |
475.9 |
|
$ |
11.1 |
|
$ |
487.0 |
|
Current liabilities: |
|
|
|
|
|
|
|
|
|
|
Deferred revenues and income |
|
|
401.0 |
|
|
(10.0) |
|
|
391.0 |
|
Long-term liabilities: |
|
|
|
|
|
|
|
|
|
|
Exhibitor services agreement |
|
|
530.9 |
|
|
52.9 |
|
|
583.8 |
|
Stockholders' equity: |
|
|
|
|
|
|
|
|
|
|
Accumulated deficit |
|
|
(207.9) |
|
|
(31.8) |
|
|
(239.7) |
The disclosure of the impact of the adoption of ASC 606 on the Company’s consolidated statement of operations is as follows:
|
|
|
Year Ended December 31, 2018 |
|||||||
|
(In millions) |
|
Without Adoption of ASC 606 |
|
Adjustments |
|
As Reported |
|||
|
Revenues: |
|
|
|
|
|
|
|
|
|
|
Admissions |
|
$ |
3,386.4 |
|
$ |
(1.4) |
|
$ |
3,385.0 |
|
Food and beverage |
|
|
1,671.9 |
|
|
(0.4) |
|
|
1,671.5 |
|
Other theatre |
|
|
356.8 |
|
|
47.5 |
|
|
404.3 |
|
Total revenues |
|
|
5,415.1 |
|
|
45.7 |
|
|
5,460.8 |
|
Operating costs and expenses: |
|
|
|
|
|
|
|
|
|
|
Operating expense, excluding depreciation and amortization |
|
|
1,636.7 |
|
|
18.0 |
|
|
1,654.7 |
|
Non-cash interest expense related to NCM exhibitor service agreement |
|
|
— |
|
|
41.5 |
|
|
41.5 |
|
Net earnings |
|
|
123.9 |
|
|
(13.8) |
|
|
110.1 |
93
Disaggregation of Revenue: Revenue is disaggregated in the following tables by major revenue types and by timing of revenue recognition:
|
|
|
Year Ended |
|
|
(In millions) |
|
December 31, 2018 |
|
|
Major revenue types |
|
|
|
|
Admissions |
|
$ |
3,385.0 |
|
Food and beverage |
|
|
1,671.5 |
|
Other theatre: |
|
|
|
|
Advertising |
|
|
142.2 |
|
Other theatre |
|
|
262.1 |
|
Other theatre |
|
|
404.3 |
|
Total revenues |
|
$ |
5,460.8 |
|
|
|
Year Ended |
|
|
(In millions) |
|
December 31, 2018 |
|
|
Timing of revenue recognition |
|
|
|
|
Products and services transferred at a point in time |
|
$ |
5,218.7 |
|
Products and services transferred over time (1) |
|
|
242.1 |
|
Total revenues |
|
$ |
5,460.8 |
|
(1) |
Amounts primarily include advertising revenues. |
The following tables provide the balances of receivables and deferred revenue income:
|
(In millions) |
|
December 31, 2018 |
|
December 31, 2017 |
||
|
Current assets: |
|
|
|
|
|
|
|
Receivables related to contracts with customers |
|
$ |
183.2 |
|
$ |
204.3 |
|
Miscellaneous receivables |
|
|
76.3 |
|
|
67.2 |
|
Receivables, net |
|
$ |
259.5 |
|
$ |
271.5 |
|
(In millions) |
|
December 31, 2018 |
|
December 31, 2017 |
||
|
Current liabilities: |
|
|
|
|
|
|
|
Deferred revenue related to contracts with customers |
|
$ |
412.8 |
|
$ |
376.1 |
|
Miscellaneous deferred income |
|
|
2.0 |
|
|
24.9 |
|
Deferred revenue and income |
|
$ |
414.8 |
|
$ |
401.0 |
The significant changes in contract liabilities with customers included in deferred revenues and income are as follows:
|
|
|
Deferred Revenues |
|
|
|
|
Related to Contracts |
|
|
(In millions) |
|
with Customers |
|
|
Balance as of December 31, 2017 |
|
$ |
376.1 |
|
Cumulative effect of initially applying ASC 606 |
|
|
(10.0) |
|
Cash received in advance (1) |
|
|
463.4 |
|
Customer loyalty rewards accumulated, net of expirations: |
|
|
|
|
Admission revenues (2) |
|
|
30.0 |
|
Food and beverage (2) |
|
|
55.2 |
|
Other theatre (2) |
|
|
8.9 |
|
Reclassification to revenue as the result of performance obligations satisfied: |
|
|
|
|
Admission revenues (3) |
|
|
(329.9) |
|
Food and beverage (3) |
|
|
(82.3) |
|
Other theatre (4) |
|
|
(97.0) |
|
Business combination - Nordic purchase price allocation (5) |
|
|
(2.3) |
|
Foreign currency translation adjustment |
|
|
0.7 |
|
Balance as of December 31, 2018 |
|
$ |
412.8 |
94
|
(1) |
Includes movie tickets, food and beverage, gift cards, exchange tickets, and AMC Stubs® loyalty membership fees. |
|
(2) |
Amount of rewards accumulated, net of expirations, that are attributed to AMC Stubs® and other loyalty programs. |
|
(3) |
Amount of rewards redeemed that are attributed to gift cards, exchange tickets, movie tickets, AMC Stubs® loyalty programs and other loyalty programs. |
|
(4) |
Amounts relate to income from non-redeemed or partially redeemed gift cards, non-redeemed exchange tickets, AMC Stubs® loyalty membership fees and other loyalty programs. |
|
(5) |
See Note 3 – Acquisitions for further information. |
The significant changes to contract liabilities included in the exhibitor services agreement, classified as long-term liabilities in the consolidated balance sheets, are as follows:
|
|
|
Exhibitor Services |
|
|
(In millions) |
|
Agreement |
|
|
Balance as of December 31, 2017 |
|
$ |
530.9 |
|
Cumulative effect of initially applying ASC 606 |
|
|
52.9 |
|
Common Unit Adjustment – surrender of common units (1) |
|
|
(5.2) |
|
Reclassification of the beginning balance to other theatre revenue, as the result of performance obligations satisfied |
|
|
(14.6) |
|
Balance as of December 31, 2018 |
$ |
564.0 |
|
|
(1) |
Represents the fair value amount of the NCM common units that were surrendered due to the annual Common Unit Adjustment. Such amount will reduce the deferred revenues that are being amortized to other theatre revenues over the remainder of the 30-year term of the ESA ending in February 2037. See Note 6 – Investments for further information. |
Transaction Price Allocated to the Remaining Performance Obligations: The following table includes the amount of NCM ESA, included in deferred revenues and income in the Company’s consolidated balance sheets, that is expected to be recognized as revenues in the future related to performance obligations that are unsatisfied as of December 31, 2018:
|
(In millions) |
|
Year Ended |
|
Year Ended |
|
Year Ended |
|
Year Ended |
|
Year Ended |
|
Years Ended |
||||||
|
Exhibitor services agreement |
|
$ |
15.7 |
|
$ |
16.8 |
|
$ |
18.1 |
|
$ |
19.4 |
|
$ |
20.9 |
|
$ |
473.1 |
The total amount of non-redeemed gifts cards and exchange tickets included in deferred revenues and income as of December 31, 2018 was $337.4 million. This will be recognized as revenues as the gift cards and exchange tickets are redeemed or as the non-redeemed gift card and exchange ticket revenues are recognized in proportion to the pattern of actual redemptions, which is estimated to occur over the next 24 months.
As of December 31, 2018, the amount of deferred revenue allocated to the AMC Stubs® loyalty programs included in deferred revenues and income was $47.7 million. The earned points will be recognized as revenue as the points are redeemed, which is estimated to occur over the next 24 months. The annual membership fee is recognized ratably over the one-year membership period.
The Company applies the practical expedient in ASC 606-10-50-14 and does not disclose information about remaining performance obligations that have original expected durations of one year or less.
NOTE 3 – ACQUISITIONS
Odeon and UCI Cinemas Holdings Limited.
On November 30, 2016, the Company completed the acquisition of Odeon for approximately £510.4 million ($637.1 million) comprised of cash of approximately £384.8 million ($480.3 million) and 4,536,466 shares of the
95
Company’s Class A common stock with a fair value of £125.6 million ($156.4 million) based on a closing share price of $34.55 per share on November 29, 2016. The amounts set forth above are based on a GBP/USD exchange rate of approximately 1.25 on November 30, 2016.
The acquisition was being treated as a purchase in accordance with ASC 805, Business Combinations, which required allocation of the purchase price to the estimated fair values of assets and liabilities acquired in the transaction. The allocation of purchase price is based on management’s judgment after evaluating several factors, including a valuation assessment. The following is a summary of the final allocation of the purchase price:
|
(In millions) |
|
Final |
|
|
Cash |
|
$ |
41.6 |
|
Receivables |
|
|
26.2 |
|
Other current assets |
|
|
58.1 |
|
Property |
|
|
736.0 |
|
Intangible assets |
|
|
114.4 |
|
Goodwill |
|
|
924.7 |
|
Deferred tax asset |
|
|
23.3 |
|
Other long-term assets |
|
|
29.6 |
|
Accounts payable |
|
|
(78.9) |
|
Accrued expenses and other liabilities |
|
|
(120.3) |
|
Deferred revenues and income |
|
|
(20.0) |
|
9% Senior Secured Note GBP due 2018 |
|
|
(382.9) |
|
4.93% Senior Secured Note EUR due 2018 |
|
|
(213.7) |
|
Capital lease and financing lease obligations |
|
|
(368.2) |
|
Deferred tax liability |
|
|
(16.8) |
|
Other long-term liabilities |
|
|
(116.0) |
|
Total estimated purchase price |
|
$ |
637.1 |
During the years ended December 31, 2017 and December 31, 2016, the Company incurred acquisition-related costs for Odeon of approximately $12.3 million and $20.9 million, respectively, which were included in general and administrative expense: merger, acquisition and transaction costs in the consolidated statements of operations. Odeon was acquired on November 30, 2016 and the Company immediately began integrating the operations. The revenues for the years ended December 31, 2017 and December 31, 2016 were $1,089.1 million and $112.7 million, respectively, and the net earnings was $20.9 million and $16.8 million, respectively.
Carmike Cinemas, Inc.
On December 21, 2016, the Company completed the acquisition of Carmike Cinemas, Inc. (“Carmike”) for approximately $858.2 million comprised of cash of $584.3 million and 8,189,808 shares of the Company’s Class A common stock with a fair value of $273.5 million (based on a closing share price of $33.45 per share on December 20, 2016). The Company also assumed debt of $230.0 million aggregate principal amount of 6.00% Senior Secured Notes due June 15, 2023 (the “Senior Secured Notes due 2023”).
96
The acquisition was being treated as a purchase in accordance with ASC 805, Business Combinations, which required allocation of the purchase price to the estimated fair values of assets and liabilities acquired in the transaction. The allocation of purchase price is based on management’s judgment after evaluating several factors, including a valuation assessment. The following is a summary of the final allocation of the purchase price:
|
(In millions) |
|
Final |
|
|
Cash |
|
$ |
86.5 |
|
Receivables |
|
|
12.0 |
|
Other current assets |
|
|
13.5 |
|
Property |
|
|
637.3 |
|
Intangible assets |
|
|
20.4 |
|
Goodwill |
|
|
652.6 |
|
Other long-term assets |
|
|
19.4 |
|
Accounts payable |
|
|
(37.0) |
|
Accrued expenses and other liabilities |
|
|
(53.3) |
|
Deferred revenues and income |
|
|
(20.6) |
|
Deferred tax asset (liability) |
|
|
68.7 |
|
6% Senior Secured Notes due 2023 |
|
|
(242.1) |
|
Capital and financing lease obligations |
|
|
(223.7) |
|
Other long-term liabilities |
|
|
(75.5) |
|
Total estimated purchase price |
|
$ |
858.2 |
During the years ended December 31, 2017, and December 31, 2016, the Company incurred acquisition-related and transition costs for Carmike of approximately $39.6 million and $25.4 million, respectively, which were included in general and administrative expense: merger, acquisition and transaction costs in the consolidated statements of operations. Carmike was acquired on December 21, 2016 and the Company immediately began integrating the operations. The revenues for the years ended December 31, 2017 and December 31, 2016 were $693.2 million and $46.5 million, respectively, and the net earnings (loss) was $(13.3) million and $16.2 million, respectively.
Department of Justice Final Judgment - In connection with the acquisition of Carmike the Company entered into a Final Judgment with the United States Department of Justice on March 7, 2017, pursuant to which the Company agreed to take certain actions to enable it to complete its acquisition of Carmike, including the divestiture of 17 movie theatres (and certain related assets) in the 15 local markets where the Company and Carmike are direct competitors to one or more acquirers acceptable to the DOJ (the Company received gross proceeds of $25.1 million related to divested theatre assets that were held for sale and sold during the year ended December 31, 2017); establish firewalls to ensure the Company does not obtain National CineMedia, LLC’s (“NCM LLC”), National CineMedia, Inc. (“NCM, Inc” and collectively with NCM LLC “NCM”) Screenvision’s or other exhibitors competitively sensitive information; relinquish seats on NCM’s board of directors and all other NCM governance rights; and transfer 24 theatres comprising 384 screens (which represent less than 2% of NCM’s total network) to the Screenvision network. This includes five Carmike theatres that implemented the Screenvision network prior to completion of the Carmike acquisition, an AMC theatre required to extend its existing term with the Screenvision network, and an AMC theatre that was also included in the divestitures. The settlement agreement also requires the Company to divest the majority of its equity interests in NCM, so that by June 20, 2019, it owns no more than 4.99% of NCM’s outstanding equity interests on a fully converted basis. The Company sold 14,800,000 NCM, Inc. common shares during the year ended December 31, 2017 and has satisfied the DOJ divestiture requirements related to NCM for calendar 2017 as calculated pursuant to the Final Judgment. In addition, in accordance with the terms of the settlement, effective December 20, 2016, Craig R. Ramsey, executive vice president and Chief Financial Officer of the Company, resigned his position as a member of the Board of Directors of NCM, Inc. On June 18, 2018, the Company entered into two Unit Purchase Agreements with each of Regal and Cinemark pursuant to which Regal and Cinemark each separately agreed to purchase 10,738,740 common units of NCM at a sales price of $7.30 per unit and aggregate consideration of approximately $156.8 million. The Sales closed on July 5, 2018. Following the closing of the Sales, the Company no longer owns any shares of common stock in NCM, Inc. or common units in NCM. NCM consented to the Sales and waived its rights under the memorandum of understanding that provided the Company would not reduce its combined ownership of NCM and NCM, Inc. below 4.5%.
97
Nordic Cinema Group Holding AB
On March 28, 2017, the Company completed the acquisition of Nordic Cinema Group Holding AB (“Nordic”) for cash. The purchase price for Nordic was cash of SEK 5,756 million ($654.9 million), which includes payment of interest on the equity value and repayment of shareholder loans. As a result of the acquisition, the Company assumed the indebtedness of Nordic of approximately SEK 1,269 million ($144.4 million) and indebtedness of approximately €156 million ($169.5 million) as of March 28, 2017, which was refinanced subsequent to the acquisition. The Company also assumed approximately SEK 13.5 million ($1.6 million) and approximately €1.0 million ($1.1 million) of interest rate swaps related to the indebtedness which were repaid following the acquisition. All amounts have been converted into US Dollar amounts assuming an SEK/USD exchange rate of 0.11378 and an EUR/USD exchange rate of 1.0865, which were the exchange rates on March 27, 2017.
The acquisition is being treated as a purchase in accordance with ASC Topic 805, Business Combinations, which requires allocation of the purchase price to the estimated fair values of assets and liabilities acquired in the transaction. The allocation of purchase price is based on management’s judgment after evaluating several factors, including a valuation assessment. The Company finalized the appraisals for both tangible and intangible assets and liabilities during the three months ended March 31, 2018. The following is a summary of the final allocation of the purchase price:
|
(In millions) |
|
Final |
|
|
Cash |
|
$ |
71.4 |
|
Restricted cash |
|
|
5.9 |
|
Receivables |
|
|
13.4 |
|
Other current assets |
|
|
23.6 |
|
Property (1) |
|
|
133.2 |
|
Intangible assets (1) (2) |
|
|
22.1 |
|
Goodwill (3) |
|
|
792.9 |
|
Deferred tax asset |
|
|
0.9 |
|
Other long-term assets (6) |
|
|
75.2 |
|
Accounts payable |
|
|
(30.2) |
|
Accrued expenses and other liabilities |
|
|
(36.1) |
|
Deferred revenues and income |
|
|
(41.2) |
|
Term Loan Facility (SEK) |
|
|
(144.4) |
|
Term Loan Facility (EUR) |
|
|
(169.5) |
|
Revolving Credit Facility (1) |
|
|
— |
|
Capital lease and financing lease obligations (1)(4) |
|
|
(10.0) |
|
Deferred tax liability |
|
|
(18.7) |
|
Other long-term liabilities (5) |
|
|
(33.6) |
|
Total estimated purchase price |
|
$ |
654.9 |
|
(1) |
Amounts recorded for property include land, buildings, capital lease assets, leasehold improvements, furniture, fixtures and equipment. During the year ended December 31, 2018, the Company recorded measurement period adjustments primarily related to the preliminary valuation of property, intangible assets, equity method investments, financing lease obligations and related tax adjustments. |
|
(2) |
Additional information for intangible assets acquired on March 28, 2017 is presented below: |
|
|
|
Weighted Average |
|
Gross |
||
|
(In millions) |
|
Amortization Period |
|
Carrying Amount |
||
|
Acquired intangible assets: |
|
|
|
|
|
|
|
Amortizable intangible assets: |
|
|
|
|
|
|
|
Favorable leases |
|
|
7.0 years |
|
$ |
3.5 |
|
Favorable subleases |
|
|
4.0 years |
|
|
1.1 |
|
Screen advertising agreement |
|
|
5.0 years |
|
|
6.6 |
|
Trade name agreement |
|
|
4.0 years |
|
|
0.4 |
|
Total, amortizable |
|
|
5.5 years |
|
$ |
11.6 |
|
Unamortized intangible assets: |
|
|
|
|
|
|
|
Trade names |
|
|
|
|
$ |
10.5 |
98
|
(3) |
Amounts recorded for goodwill are not expected to be deductible for tax purposes. |
|
(4) |
Including current portion of approximately $1.1 million. |
|
(5) |
Amounts recorded for other long-term liabilities include unfavorable leases of approximately $20.0 million with an amortization period of 9.3 years. |
|
(6) |
Includes equity method investments of $64.7 million. |
The fair value measurement of tangible and intangible assets and liabilities were based on significant inputs not observable in the market and thus represent Level 3 measurements within the fair value measurement hierarchy. Level 3 fair market values were determined using a variety of information, including estimated future cash flows, appraisals, and market comparables.
The purchase price paid by the Company in the acquisition resulted in recognition of goodwill because it exceeded the estimated fair value of the assets acquired and liabilities assumed. The Company paid a price in excess of estimated fair value of the assets acquired and liabilities assumed because the acquisition of Nordic enhances its position as the largest movie exhibition company in Europe and broadens and diversifies its European platform. The Company also expects to realize synergy and cost savings related to the acquisition because of purchasing and procurement economies of scale.
During the years ended December 31, 2018 and December 31, 2017, the Company incurred acquisition-related and transition costs for Nordic of approximately $1.5 million and $10.1 million, which were included in general and administrative expense: merger, acquisition and transaction costs in the consolidated statements of operations. Nordic was acquired on March 28, 2017 and the Company immediately began integrating the operations. The revenues for Nordic during the year ended December 31, 2018 were $374.1 million, and net earnings was $40.9 million for the year ended December 31, 2018.
Pro Forma Results of Operations (Unaudited)
The following selected comparative unaudited actual results of operation information for the year ended December 31, 2018, and the comparative unaudited pro forma results of operations for the years ended December 31, 2017, and December 31, 2016 assumes that the Odeon, Carmike, and Nordic acquisitions occurred at the beginning of 2016, and reflects the full results of operations for the years presented. The pro forma results have been prepared for comparative purposes only and do not purport to indicate the results of operations which would actually have occurred had the combination been in effect on the dates indicated, or which may occur in the future. These amounts have been calculated after applying the Company’s accounting policies and adjusting the results of Odeon, Carmike, and Nordic to reflect the fair value adjustments to property and equipment and financing obligations. The pro forma financial information presented includes the effects of adjustments related to preliminary values assigned to long-lived assets, including depreciation charges from acquired property and equipment, interest expense and incremental shares issued from financing the acquisitions and the related income tax effects and the elimination of Carmike and AMC historical revenues and expenses for theatres in markets that were divested as required by the Department of Justice. Merger, acquisition and transaction costs directly related to the acquisitions have not been removed.
|
|
|
Actual |
|
Pro Forma |
|
Pro Forma |
|||
|
|
|
Year Ended |
|
Year Ended |
|
Year Ended |
|||
|
(In millions) |
|
December 31, 2018 |
|
December 31, 2017 |
|
December 31, 2016 |
|||
|
Revenues |
|
$ |
5,460.8 |
|
$ |
5,156.0 |
|
$ |
5,256.5 |
|
Operating income (loss) |
|
$ |
265.0 |
|
$ |
108.8 |
|
$ |
191.8 |
|
Net earnings (loss) |
|
$ |
110.1 |
|
$ |
(497.1) |
|
$ |
(88.0) |
|
Earnings (loss) per share: |
|
|
|
|
|
|
|
|
|
|
Basic |
|
$ |
0.91 |
|
$ |
(3.88) |
|
$ |
(0.67) |
|
Diluted |
|
$ |
0.41 |
|
$ |
(3.88) |
|
$ |
(0.67) |
99
NOTE 4 – PROPERTY
A summary of property is as follows:
|
(In millions) |
|
December 31, 2018 |
|
December 31, 2017 |
|
||
|
Property owned: |
|
|
|
|
|
|
|
|
Land |
|
$ |
104.6 |
|
$ |
130.5 |
|
|
Buildings and improvements |
|
|
878.2 |
|
|
949.9 |
|
|
Leasehold improvements |
|
|
1,560.7 |
|
|
1,198.0 |
|
|
Furniture, fixtures and equipment |
|
|
2,065.4 |
|
|
1,970.6 |
|
|
|
|
|
4,608.9 |
|
|
4,249.0 |
|
|
Less: accumulated depreciation |
|
|
1,668.3 |
|
|
1,248.6 |
|
|
|
|
|
2,940.6 |
|
|
3,000.4 |
|
|
|
|
|
|
|
|
|
|
|
Property leased under capital leases: |
|
|
|
|
|
|
|
|
Building and improvements |
|
|
127.8 |
|
|
134.4 |
|
|
Less: accumulated depreciation and amortization |
|
|
28.8 |
|
|
18.3 |
|
|
|
|
|
99.0 |
|
|
116.1 |
|
|
|
|
$ |
3,039.6 |
|
$ |
3,116.5 |
|
Property is recorded at cost or fair value, in the case of property resulting from acquisitions. The Company uses the straight-line method in computing depreciation and amortization for financial reporting purposes. The estimated useful lives for leasehold improvements and buildings subject to a ground lease reflect the shorter of the expected useful lives of the assets or the base terms of the corresponding lease agreements plus renewal options expected to be exercised for these leases for assets placed in service subsequent to the lease inception. The estimated useful lives are as follows:
|
Buildings and improvements |
|
5 to 45 years |
|
|
Leasehold improvements |
|
1 to 20 years |
|
|
Furniture, fixtures and equipment |
|
1 to 11 years |
|
Expenditures for additions (including interest during construction) and betterments are capitalized, and expenditures for maintenance and repairs are charged to expense as incurred. The cost of assets retired or otherwise disposed of and the related accumulated depreciation and amortization are eliminated from the accounts in the year of disposal. Gains or losses resulting from property disposals are included in operating expense in the accompanying consolidated statements of operations.
Depreciation expense was $498.2 million, $495.2 million, and $239.9 million for the years ended December 31, 2018, December 31, 2017 and December 31, 2016, respectively.
100
NOTE 5 – GOODWILL AND INTANGIBLE ASSETS
Activity of goodwill is presented below:
|
(In millions) |
|
U.S. |
|
International |
|
Total |
|||
|
Balance as of December 31, 2016 |
|
3,044.8 |
|
|
888.2 |
|
|
3,933.0 |
|
|
Acquisition of Nordic |
|
— |
|
|
872.1 |
|
|
872.1 |
|
|
Adjustments to acquisition of Nordic(1) |
|
— |
|
|
(72.8) |
|
|
(72.8) |
|
|
Adjustments to acquisition of Odeon(1) |
|
— |
|
|
26.1 |
|
|
26.1 |
|
|
Adjustments to acquisition of Carmike(1) |
|
27.8 |
|
|
— |
|
|
27.8 |
|
|
Currency translation adjustment |
|
— |
|
|
145.5 |
|
|
145.5 |
|
|
Balance as of December 31, 2017 |
$ |
3,072.6 |
|
$ |
1,859.1 |
|
$ |
4,931.7 |
|
|
Adjustments to the acquisition of Nordic |
|
— |
|
|
(6.4) |
|
|
(6.4) |
|
|
Currency translation adjustment |
|
— |
|
|
(136.6) |
|
|
(136.6) |
|
|
Balance as of December 31, 2018 |
$ |
3,072.6 |
|
$ |
1,716.1 |
|
$ |
4,788.7 |
|
|
(1) |
Change in goodwill from purchase price allocation adjustments. See Note 3 – Acquisitions for further information. |
|
(2) |
As of December 31, 2018, the goodwill for the Odeon Theatres reporting unit and the Nordic Theatres reporting unit was $940.1 million and $776.0 million, respectively. |
Detail of other intangible assets is presented below:
|
|
|
|
|
|
December 31, 2018 |
|
December 31, 2017 |
|
||||||||
|
|
|
|
|
|
Gross |
|
|
|
|
Gross |
|
|
|
|
||
|
|
|
Remaining |
|
|
Carrying |
|
Accumulated |
|
Carrying |
|
Accumulated |
|
||||
|
(In millions) |
|
Useful Life |
|
|
Amount |
|
Amortization |
|
Amount |
|
Amortization |
|
||||
|
Amortizable Intangible Assets: |
|
|
|
|
|
|
|
|
|
|
|
|
|
|
|
|
|
Favorable leases |
|
1 to 40 years |
|
|
$ |
206.0 |
|
$ |
(55.4) |
|
$ |
209.8 |
|
$ |
(42.1) |
|
|
Management contracts and franchise rights |
|
1 to 7 years |
|
|
|
11.8 |
|
|
(6.2) |
|
|
16.1 |
|
|
(5.5) |
|
|
Non-compete agreement |
|
2 years |
|
|
|
2.6 |
|
|
(1.5) |
|
|
2.6 |
|
|
(1.0) |
|
|
Starplex trade name |
|
8 years |
|
|
|
7.9 |
|
|
(1.8) |
|
|
7.9 |
|
|
(1.0) |
|
|
Carmike trade name |
|
5 years |
|
|
|
9.3 |
|
|
(2.7) |
|
|
9.3 |
|
|
(1.4) |
|
|
NCM tax receivable agreement |
|
18 years |
|
|
|
20.9 |
|
|
(5.3) |
|
|
20.9 |
|
|
(4.5) |
|
|
Total, amortizable |
|
|
|
|
$ |
258.5 |
|
$ |
(72.9) |
|
$ |
266.6 |
|
$ |
(55.5) |
|
|
Unamortized Intangible Assets: |
|
|
|
|
|
|
|
|
|
|
|
|
|
|
|
|
|
AMC trademark |
|
|
|
|
$ |
104.4 |
|
|
|
|
$ |
104.4 |
|
|
|
|
|
Odeon trade names |
|
|
|
|
|
51.4 |
|
|
|
|
|
54.3 |
|
|
|
|
|
Nordic trade names |
|
|
|
|
|
10.7 |
|
|
|
|
|
10.7 |
|
|
|
|
|
Total, unamortizable |
|
|
|
|
$ |
166.5 |
|
|
|
|
$ |
169.4 |
|
|
|
|
Amortization expense associated with the intangible assets noted above is as follows:
|
|
|
Year Ended |
|
|||||||
|
(In millions) |
|
December 31, 2018 |
|
December 31, 2017 |
|
December 31, 2016 |
|
|||
|
Recorded amortization |
|
$ |
19.2 |
|
$ |
20.0 |
|
$ |
9.6 |
|
Estimated annual amortization for the next five calendar years for intangible assets is projected below:
|
(In millions) |
|
2019 |
|
2020 |
|
2021 |
|
2022 |
|
2023 |
|
|||||
|
Projected annual amortization |
|
$ |
16.8 |
|
$ |
15.7 |
|
$ |
14.4 |
|
$ |
13.0 |
|
$ |
12.2 |
|
101
NOTE 6 – INVESTMENTS
Investments in non-consolidated affiliates and certain other investments accounted for under the equity method generally include all entities in which the Company or its subsidiaries have significant influence, but not more than 50% voting control, and are recorded in the Consolidated Balance Sheets in other long-term assets. Investments in non-consolidated affiliates as of December 31, 2018, include interests in DCIP of 29.0%, DCDC of 14.6%, AC JV, owner of Fathom Events, of 32.0%, SV Holdco, owner of Screenvision, 18.4% and DCM of 50.0%. The Company also has partnership interests in four U.S. motion picture theatres and one IMAX® screen of 50.0% (“Theatre Partnerships”) and approximately 50.0% interest in 58 theatres in Europe acquired in the Odeon and Nordic acquisitions. Indebtedness held by equity method investees is non-recourse to the Company.
At December 31, 2018, the Company’s recorded investments are greater than its proportional ownership of the underlying equity in its non-consolidated affiliates by approximately $40.0 million.
Amounts payable to U.S. Theatre Partnerships were $0.9 million and $2.8 million as of December 31, 2018 and December 31, 2017, respectively.
RealD Inc. Common Stock
During the year ended December 31, 2018, the Company entered into a Stock Issuance and Restrictions Agreement with RealD Holdings Inc. (“RealD”). The new agreement replaces a similar agreement with RealD for the lease of RealD 3D systems where rental payments continue to be variable and based on paid admissions and extends the term of the agreement to December 31, 2024. The investments are recorded at cost following the measurement alternative as there is no established market for the securities and the Company does not have significant influence over these entities.
The Company sold 1,222,780 shares in RealD Inc. during the year ended December 31, 2016 and recognized a gain on sale of $3.0 million.
Dreamscape and Central Services Studios Preferred Stock
During the year ended December 31, 2017, the Company invested $5.0 million in Dreamscape Immersive, Inc. and invested $5.0 million in Central Services Studios, Inc. as a part of its virtual reality technologies strategy. During January 2018, the Company invested an additional $5.0 million in Dreamscape and an additional $5.0 million in Central Services Studios. The Company does not have significant influence over these entities and will follow the cost method of accounting.
NCM Transactions
In March 2018, the NCM Common Unit Adjustment ("CUA") resulted in a negative adjustment of 915,150 common units for the Company. The Company elected to return the units and recorded the surrendered common units as a reduction to deferred revenues for the ESA at fair value of $5.2 million, based upon a price per share of NCM, Inc. of $5.64 on March 15, 2018. The Company’s investment in NCM was reduced by the carrying value of the common units of $6.3 million resulting in a loss from the surrender of the NCM common units of $1.1 million, which was recorded to equity in earnings (loss) of Non-Consolidated Entities in March 2018.
On June 18, 2018, the Company entered into two Unit Purchase Agreements (the “Agreements”) with each of Regal Cinemas, Inc. (“Regal”) and Cinemark USA, Inc. (“Cinemark”) pursuant to which Regal and Cinemark each separately agreed to purchase 10,738,740 common units of NCM at a sales price of $7.30 per unit and aggregate consideration of approximately $156.8 million (the “Sales”). The Sales closed on July 5, 2018. Following the closing of the Sales, the Company no longer owns any shares of common stock in NCM, Inc. or common units in NCM. NCM consented to the Sales and waived its rights under the memorandum of understanding that provided the Company would not reduce its combined ownership of NCM and NCM, Inc. below 4.5%. The Company recorded a $28.9 million gain on the sale of its NCM investment during the year ended December 31, 2018.
Pursuant to the Company’s Common Unit Adjustment Agreement, from time to time common units of NCM held by the Founding Members will be adjusted up or down through a formula (“Common Unit Adjustment”), primarily
102
based on increases or decreases in the number of theatre screens operated and theatre attendance generated by each Founding Member. The common unit adjustment is computed annually, except that an earlier common unit adjustment will occur for a Founding Member if its acquisition or disposition of theatres, in a single transaction or cumulatively since the most recent common unit adjustment, will cause a change of 2% or more in the total annual attendance of all of the Founding Members. In the event that a common unit adjustment is determined to be a negative number, the Founding Member shall cause, at its election, either (a) the transfer and surrender to NCM of a number of common units equal to all or part of such Founding Member’s common unit adjustment or (b) pay to NCM an amount equal to such Founding Member’s common unit adjustment calculated in accordance with the Common Unit Adjustment Agreement.
The Company has a mortgage note payable to NCM in the amount of $1.3 million in current maturities of corporate borrowings and capital and finance lease obligations.
During the years ended December 31, 2018, December 31, 2017, and December 31, 2016, payments received of $5.4 million, $6.0 million, and $7.8 million, respectively, related to the NCM tax receivable agreement were recorded in investment expense (income), net of related amortization for the NCM tax receivable agreement intangible asset.
SV Holdco. (“Screenvision”)
The Company acquired its investment in SV Holdco on December 21, 2016, in connection with the acquisition of Carmike. SV Holdco is a holding company that owns and operates the Screenvision advertising business through a subsidiary entity. SV Holdco has elected to be taxed as a partnership for U.S. federal income tax purposes.
On May 30, 2018, Screenvision entered into an Agreement and Plan of Merger which resulted in a change of control in Screenvision. The Company received distributions and merger consideration of $45.9 million on July 2, 2018 upon consummation of the Screenvision merger and retains a 18.4% common membership interest. The Company reduced the carrying value of its investment in Screenvision to $0 and recorded equity in earnings for the excess distribution of $30.1 million during the year ended December 31, 2018.
The Company recorded the following related party transactions with Screenvision:
|
|
|
As of |
|
As of |
||
|
(In millions) |
|
December 31, 2018 |
|
December 31, 2017 |
||
|
Due from Screenvision for on-screen advertising revenue |
|
$ |
2.7 |
|
$ |
3.1 |
|
|
|
Year Ended |
|
Year Ended |
|
Year Ended |
|||
|
(In millions) |
|
December 31, 2018 |
|
December 31, 2017 |
|
December 31, 2016 |
|||
|
Screenvision screen advertising revenues |
|
$ |
15.1 |
|
$ |
14.0 |
|
$ |
1.6 |
Digital Cinema Media
The Company acquired its equity investment in DCM on November 30, 2016, in connection with the acquisition of Odeon. The Company receives advertising services from DCM for its Odeon Theatres in International markets through a joint venture in which it has a 50% ownership interest. As of December 31, 2018, Odeon held a note receivable from DCM in the amount of $0.6 million.
The Company recorded the following related party transactions with DCM:
|
|
|
As of |
|
As of |
||
|
(In millions) |
|
December 31, 2018 |
|
December 31, 2017 |
||
|
Due from DCM for on-screen advertising revenue |
|
$ |
2.8 |
|
$ |
4.6 |
|
|
|
Year Ended |
|
Year Ended |
|
Year Ended |
|||
|
(In millions) |
|
December 31, 2018 |
|
December 31, 2017 |
|
December 31, 2016 |
|||
|
DCM screen advertising revenues |
|
$ |
20.1 |
|
$ |
23.3 |
|
$ |
3.1 |
103
DCIP Transactions
The Company will make capital contributions to DCIP for projector and installation costs in excess of an agreed upon cap. The Company pays equipment rent monthly and records the equipment rental expense on a straight-line basis over 12 years.
The Company recorded the following related party transactions with DCIP:
|
|
|
As of |
|
As of |
|
||
|
(In millions) |
|
December 31, 2018 |
|
December 31, 2017 |
|
||
|
Due from DCIP for warranty expenditures |
|
$ |
3.4 |
|
$ |
2.8 |
|
|
Deferred rent liability for digital projectors |
|
|
7.8 |
|
|
8.1 |
|
|
(In millions) |
|
December 31, 2018 |
|
December 31, 2017 |
|
December 31, 2016 |
|||
|
Digital equipment rental expense |
|
$ |
6.5 |
|
$ |
5.7 |
|
$ |
5.0 |
Open Road Films Transactions
During the year ended December 31, 2017, the Company recorded additional equity earnings (loss) in Open Road Releasing, LLC (“Open Road”) of $(8.0) million, related to certain advances to and on behalf of Open Road.
On August 4, 2017, the Company and Regal Entertainment Group consummated a transaction for the sale of all the issued and outstanding ownership interests in Open Road for total proceeds of $28.8 million of which the Company received $14.0 million in net proceeds after transaction expenses for its 50% investment including collection of amounts due from Open Road of $4.8 million and recognized a gain on sale of $17.2 million.
AC JV Transactions
On December 26, 2013, the Company amended and restated its existing Exhibitor Services Agreement (“ESA”) with NCM in connection with the spin-off by NCM of its Fathom Events business to AC JV, a newly-formed company owned 32% by each of the Founding Members and 4% by NCM. In consideration for the spin-off, NCM received a total of $25.0 million in promissory notes from its Founding Members (approximately $8.3 million from each Founding Member). Interest on the promissory note is at a fixed rate of 5% per annum, compounded annually. Interest and principal payments are due annually in six equal installments commencing on the first anniversary of the closing. Cinemark and Regal also amended and restated their respective ESAs with NCM in connection with the spin-off. The ESAs were modified to remove those provisions addressing the rights and obligations related to digital programing services of the Fathom Events business. Those provisions are now contained in the Amended and Restated Digital Programming Exhibitor Services Agreements (the “Digital ESAs”) that were entered into on December 26, 2013 by NCM and each of the Founding Members. These Digital ESAs were then assigned by NCM to AC JV as part of the Fathom spin-off.
The Company recorded the following related party transactions with AC JV:
|
|
|
As of |
|
As of |
|
||
|
(In millions) |
|
December 31, 2018 |
|
December 31, 2017 |
|
||
|
Due to AC JV for Fathom Events programming |
|
|
2.5 |
|
|
0.5 |
|
|
|
|
Year Ended |
|
Year Ended |
|
Year Ended |
|||
|
(In millions) |
|
December 31, 2018 |
|
December 31, 2017 |
|
December 31, 2016 |
|||
|
Film exhibition costs: |
|
|
|
|
|
|
|
||
|
Gross exhibition cost on Fathom Events programming |
|
$ |
12.9 |
|
$ |
12.5 |
|
$ |
8.0 |
104
The Company recorded the following related party transactions with the Nordic theatre JV’s:
|
|
|
As of |
|
As of |
||
|
(In millions) |
|
December 31, 2018 |
|
December 31, 2017 |
||
|
Due from Nordic JVs |
|
$ |
2.6 |
|
$ |
5.7 |
|
Due to Nordic JVs for management services |
|
|
1.7 |
|
|
2.5 |
Summary Financial Information
Investments in non-consolidated affiliates accounted for under the equity method as of December 31, 2018, include interests in NCM, SV Holdco, DCM, DCIP, AC JV, DCDC, 58 theatres in Europe acquired in the Nordic acquisition, two U.S. motion picture theatres and one IMAX® screen, and other immaterial investments.
Condensed financial information of the Company’s significant non-consolidated equity method investments is shown below with amounts presented under U.S. GAAP.
|
|
|
December 31, 2018 |
|||||||
|
(In millions) |
|
DCIP |
|
Other |
|
Total |
|||
|
Current assets |
|
$ |
57.9 |
|
$ |
170.4 |
|
$ |
228.3 |
|
Noncurrent assets |
|
|
684.3 |
|
|
201.0 |
|
|
885.3 |
|
Total assets |
|
|
742.2 |
|
|
371.4 |
|
|
1,113.6 |
|
Current liabilities |
|
|
60.7 |
|
|
99.4 |
|
|
160.1 |
|
Noncurrent liabilities |
|
|
132.1 |
|
|
207.7 |
|
|
339.8 |
|
Total liabilities |
|
|
192.8 |
|
|
307.1 |
|
|
499.9 |
|
Stockholders’ equity (deficit) |
|
|
549.5 |
|
|
64.3 |
|
|
613.8 |
|
Liabilities and stockholders’ equity (deficit) |
|
|
742.2 |
|
|
371.4 |
|
|
1,113.6 |
|
The Company’s recorded investment (1) |
|
$ |
152.5 |
|
$ |
79.9 |
|
$ |
232.4 |
|
|
|
December 31, 2017 |
||||||||||
|
(In millions) |
|
NCM |
|
DCIP |
|
Other |
|
Total |
||||
|
Current assets |
|
$ |
173.5 |
|
$ |
56.3 |
|
$ |
172.6 |
|
$ |
402.4 |
|
Noncurrent assets |
|
|
759.2 |
|
|
771.3 |
|
|
226.5 |
|
|
1,757.0 |
|
Total assets |
|
|
932.7 |
|
|
827.6 |
|
|
399.1 |
|
|
2,159.4 |
|
Current liabilities |
|
|
125.4 |
|
|
52.5 |
|
|
117.5 |
|
|
295.4 |
|
Noncurrent liabilities |
|
|
923.3 |
|
|
302.4 |
|
|
70.5 |
|
|
1,296.2 |
|
Total liabilities |
|
|
1,048.7 |
|
|
354.9 |
|
|
188.0 |
|
|
1,591.6 |
|
Stockholders’ equity (deficit) |
|
|
(116.0) |
|
|
472.7 |
|
|
211.1 |
|
|
567.8 |
|
Liabilities and stockholders’ equity (deficit) |
|
|
932.7 |
|
|
827.6 |
|
|
399.1 |
|
|
2,159.4 |
|
The Company’s recorded investment (1) |
|
$ |
167.9 |
|
$ |
129.6 |
|
$ |
92.0 |
|
$ |
389.5 |
|
(1) |
Certain differences in the Company’s recorded investments, and its proportional ownership share resulting from the acquisition of Holdings by Wanda on August 30, 2012, where the investments were recorded at fair value, are amortized to equity in (earnings) losses of non-consolidated entities over the estimated useful lives of the underlying assets and liabilities. Other non-amortizing differences are considered to represent goodwill and are evaluated for impairment annually. |
105
Condensed financial information of the Company’s significant non-consolidated equity method investments is shown below and amounts are presented under U.S. GAAP for the periods of ownership by the Company:
|
|
|
Year Ended December 31, 2018 |
||||||||||
|
(In millions) |
|
NCM |
|
DCIP |
|
Other |
|
Total |
||||
|
Revenues |
|
$ |
193.9 |
|
$ |
176.7 |
|
$ |
532.2 |
|
$ |
902.8 |
|
Operating costs and expenses |
|
|
171.9 |
|
|
81.9 |
|
|
489.2 |
|
|
743.0 |
|
Net earnings |
|
$ |
22.0 |
|
$ |
94.8 |
|
$ |
43.0 |
|
$ |
159.8 |
|
(1) |
The NCM condensed financial information represents the period January 1, 2018 through the date the Sale closed July 5, 2018. |
|
|
|
Year Ended December 31, 2017 |
||||||||||
|
(In millions) |
|
NCM |
|
DCIP |
|
Other |
|
Total |
||||
|
Revenues |
|
$ |
426.1 |
|
$ |
177.4 |
|
$ |
581.9 |
|
$ |
1,185.4 |
|
Operating costs and expenses |
|
|
324.2 |
|
|
84.3 |
|
|
550.9 |
|
|
959.4 |
|
Net earnings (loss) |
|
$ |
101.9 |
|
$ |
93.1 |
|
$ |
31.0 |
|
$ |
226.0 |
|
|
|
Year Ended December 31, 2016 |
||||||||||
|
(In millions) |
|
NCM |
|
DCIP |
|
Other |
|
Total |
||||
|
Revenues |
|
$ |
447.6 |
|
$ |
178.8 |
|
$ |
494.7 |
|
$ |
1,121.1 |
|
Operating costs and expenses |
|
|
338.3 |
|
|
89.6 |
|
|
533.8 |
|
|
961.7 |
|
Net earnings (loss) |
|
$ |
109.3 |
|
$ |
89.2 |
|
$ |
(39.1) |
|
$ |
159.4 |
The components of the Company’s recorded equity in earnings (losses) of non-consolidated entities are as follows:
|
|
|
Year Ended |
|
Year Ended |
|
Year Ended |
|||
|
(In millions) |
|
December 31, 2018 |
|
December 31, 2017 |
|
December 31, 2016 |
|||
|
National CineMedia (1) |
|
$ |
17.9 |
|
$ |
(216.3) |
|
$ |
17.6 |
|
Digital Cinema Implementation Partners, LLC |
|
|
29.1 |
|
|
28.6 |
|
|
27.5 |
|
Other |
|
|
39.7 |
|
|
2.5 |
|
|
2.6 |
|
The Company’s recorded equity (loss) in earnings |
|
$ |
86.7 |
|
$ |
(185.2) |
|
$ |
47.7 |
|
(1) |
Includes both NCM, LLC and NCM, Inc. |
106
The Company recorded the following changes in the carrying amount of its investment in NCM LLC and equity in earnings of NCM LLC during the years ended December 31, 2018, December 31, 2017, and December 31, 2016:
|
|
|
|
|
|
|
|
|
Accumulated |
|
|
|
|
|
|
|
G&A: Mergers |
|
|
|
||
|
|
|
|
|
|
Exhibitor |
|
Other |
|
|
|
Equity in |
|
and |
|
|
|
|||||
|
|
|
Investment |
|
Services |
|
Comprehensive |
|
Cash |
|
(Earnings) |
|
Acquisitions |
|
Advertising |
|||||||
|
(In millions) |
|
in NCM |
|
Agreement(1) |
|
(Income)/Loss |
|
Received |
|
Losses |
|
Expense |
|
(Revenue) |
|||||||
|
Ending balance at December 31, 2015 |
|
$ |
327.5 |
|
$ |
(377.6) |
|
$ |
(4.0) |
|
$ |
22.7 |
|
$ |
(11.2) |
|
$ |
— |
|
$ |
(15.3) |
|
Exchange of common units |
|
|
0.4 |
|
|
— |
|
|
— |
|
|
— |
|
|
— |
|
|
— |
|
|
— |
|
Receipt of excess cash distributions |
|
|
(21.6) |
|
|
— |
|
|
— |
|
|
21.6 |
|
|
— |
|
|
— |
|
|
— |
|
Amortization of ESA |
|
|
— |
|
|
18.4 |
|
|
— |
|
|
— |
|
|
— |
|
|
— |
|
|
(18.4) |
|
Equity in earnings |
|
|
19.0 |
|
|
— |
|
|
— |
|
|
— |
|
|
(19.0) |
|
|
— |
|
|
— |
|
Equity in loss from amortization of basis difference |
|
|
(1.4) |
|
|
— |
|
|
— |
|
|
— |
|
|
1.4 |
|
|
— |
|
|
— |
|
Ending balance at December 31, 2016 |
|
$ |
323.9 |
|
$ |
(359.2) |
|
$ |
(4.0) |
|
$ |
21.6 |
|
$ |
(17.6) |
|
$ |
— |
|
$ |
(18.4) |
|
Receipt of common units |
|
|
235.2 |
|
|
(235.2) |
|
|
— |
|
|
— |
|
|
— |
|
|
— |
|
|
— |
|
Receipt of excess cash distributions |
|
|
(28.6) |
|
|
— |
|
|
— |
|
|
28.6 |
|
|
— |
|
|
— |
|
|
— |
|
Surrender of common units for transferred theatres |
|
|
(36.4) |
|
|
35.7 |
|
|
— |
|
|
— |
|
|
0.7 |
|
|
— |
|
|
— |
|
Surrender of common units for make whole agreement |
|
|
(23.1) |
|
|
— |
|
|
— |
|
|
— |
|
|
0.5 |
|
|
22.6 |
|
|
— |
|
Other-than-temporary impairment loss - held for sale |
|
|
(206.3) |
|
|
— |
|
|
— |
|
|
— |
|
|
206.3 |
|
|
— |
|
|
— |
|
Units exchanged for NCM, Inc. common shares |
|
|
(116.5) |
|
|
— |
|
|
— |
|
|
— |
|
|
— |
|
|
— |
|
|
— |
|
Equity in earnings |
|
|
15.3 |
|
|
— |
|
|
1.5 |
|
|
— |
|
|
(16.8) |
|
|
— |
|
|
— |
|
Equity in loss from amortization of basis difference |
|
|
(2.4) |
|
|
— |
|
|
— |
|
|
— |
|
|
2.4 |
|
|
— |
|
|
— |
|
Amortization of ESA |
|
|
— |
|
|
27.8 |
|
|
— |
|
|
— |
|
|
— |
|
|
— |
|
|
(27.8) |
|
Ending balance at December 31, 2017 |
|
$ |
161.1 |
|
$ |
(530.9) |
|
$ |
(2.5) |
|
$ |
28.6 |
|
$ |
193.1 |
|
$ |
22.6 |
|
$ |
(27.8) |
|
ASC 606 revenue recognition change in amortization method |
|
|
— |
|
|
(52.9) |
|
|
— |
|
|
|
|
|
|
|
|
|
|
|
|
|
Surrender of common units for common unit adjustment |
|
|
(6.3) |
|
|
5.2 |
|
|
— |
|
$ |
— |
|
$ |
1.1 |
|
$ |
— |
|
$ |
— |
|
Receipt of excess cash distributions |
|
|
(15.3) |
|
|
— |
|
|
— |
|
|
15.3 |
|
|
— |
|
|
— |
|
|
— |
|
Impairment loss - held for sale |
|
|
(14.4) |
|
|
— |
|
|
— |
|
|
— |
|
|
14.4 |
|
|
— |
|
|
— |
|
Expenses on sale of NCM common units |
|
|
— |
|
|
— |
|
|
— |
|
|
(1.4) |
|
|
1.4 |
|
|
— |
|
|
— |
|
Sale of NCM common units |
|
|
(128.3) |
|
|
— |
|
|
2.4 |
|
|
156.8 |
|
|
(30.9) |
|
|
— |
|
|
— |
|
Equity in earnings |
|
|
3.2 |
|
|
— |
|
|
0.1 |
|
|
— |
|
|
(3.3) |
|
|
— |
|
|
— |
|
Amortization of ESA |
|
|
— |
|
|
14.6 |
|
|
— |
|
|
— |
|
|
— |
|
|
— |
|
|
(14.6) |
|
Ending balance at December 31, 2018 |
|
$ |
— |
|
$ |
(564.0) |
|
$ |
— |
|
$ |
170.7 |
|
$ |
(17.3) |
|
$ |
— |
|
$ |
(14.6) |
|
(1) |
Represents the unamortized portion of the ESA with NCM. Such amounts are being amortized to other theatre revenues over the remainder of the 30-year term of the ESA ending in 2037. See Note 1 – The Company and Significant Accounting Policies and Note 2 – Revenue Recognition f0r information on the effects of adopting ASC 606. |
107
NOTE 7 – SUPPLEMENTAL BALANCE SHEET INFORMATION
Assets held for sale, other assets and liabilities consist of the following:
|
(In millions) |
|
December 31, 2018 |
|
December 31, 2017 |
|
||
|
Other current assets: |
|
|
|
|
|
|
|
|
Prepaid rent |
|
$ |
82.3 |
|
$ |
63.9 |
|
|
Income taxes receivable |
|
|
24.7 |
|
|
26.5 |
|
|
Prepaid insurance and other |
|
|
17.5 |
|
|
50.2 |
|
|
Merchandise inventory |
|
|
35.2 |
|
|
34.0 |
|
|
Other |
|
|
38.1 |
|
|
28.0 |
|
|
|
|
$ |
197.8 |
|
$ |
202.6 |
|
|
Other long-term assets: |
|
|
|
|
|
|
|
|
Investments in real estate |
|
$ |
16.2 |
|
$ |
7.6 |
|
|
Deferred financing costs revolving credit facility |
|
|
6.7 |
|
|
9.5 |
|
|
Investments in equity method investees |
|
|
232.4 |
|
|
389.5 |
|
|
Less: Reclassified to held for sale (1) |
|
|
— |
|
|
(80.0) |
|
|
Computer software |
|
|
104.3 |
|
|
83.7 |
|
|
Investment in common stock |
|
|
30.9 |
|
|
15.0 |
|
|
Pension |
|
|
25.7 |
|
|
26.9 |
|
|
Derivative asset |
|
|
55.7 |
|
|
— |
|
|
Other |
|
|
33.6 |
|
|
23.7 |
|
|
|
|
$ |
505.5 |
|
$ |
475.9 |
|
|
Accrued expenses and other liabilities: |
|
|
|
|
|
|
|
|
Taxes other than income |
|
$ |
73.4 |
|
$ |
87.6 |
|
|
Interest |
|
|
32.6 |
|
|
27.5 |
|
|
Payroll and vacation |
|
|
39.6 |
|
|
30.4 |
|
|
Current portion of casualty claims and premiums |
|
|
11.2 |
|
|
11.0 |
|
|
Accrued bonus |
|
|
39.6 |
|
|
18.5 |
|
|
Theatre and other closure |
|
|
5.6 |
|
|
8.8 |
|
|
Accrued licensing and percentage rent |
|
|
18.9 |
|
|
20.4 |
|
|
Current portion of pension |
|
|
0.3 |
|
|
0.3 |
|
|
Other |
|
|
157.3 |
|
|
146.6 |
|
|
|
|
$ |
378.5 |
|
$ |
351.1 |
|
|
Other long-term liabilities: |
|
|
|
|
|
|
|
|
Unfavorable lease obligations |
|
$ |
176.6 |
|
$ |
221.3 |
|
|
Deferred rent |
|
|
518.5 |
|
|
467.7 |
|
|
Pension |
|
|
54.6 |
|
|
62.7 |
|
|
Deferred gain |
|
|
102.4 |
|
|
76.8 |
|
|
RealD deferred lease incentive |
|
|
11.7 |
|
|
8.2 |
|
|
Casualty claims and premiums |
|
|
15.2 |
|
|
17.1 |
|
|
Theatre and other closure |
|
|
12.5 |
|
|
18.7 |
|
|
Other |
|
|
71.6 |
|
|
31.3 |
|
|
|
|
$ |
963.1 |
|
$ |
903.8 |
|
|
(1) |
As of December 31, 2017, assets held for sale includes the fair market value of NCM units of $80.0 million. |
108
NOTE 8 – CORPORATE BORROWINGS AND CAPITAL AND FINANCING LEASE OBLIGATIONS
A summary of the carrying value of corporate borrowings and capital and financing lease obligations is as follows:
|
(In millions) |
|
December 31, 2018 |
|
December 31, 2017 |
|
||
|
Odeon Revolving Credit Facility Due 2022 (2.5% + Base Rate of 0.75% as of December 31, 2018) |
|
$ |
11.9 |
|
$ |
— |
|
|
Senior Secured Credit Facility-Term Loan due 2022 (4.7051% as of December 31, 2018) |
|
|
854.2 |
|
|
863.0 |
|
|
Senior Secured Credit Facility-Term Loan due 2023 (4.7051% as of December 31, 2018) |
|
|
491.2 |
|
|
496.3 |
|
|
6.0% Senior Secured Notes due 2023 |
|
|
230.0 |
|
|
230.0 |
|
|
2.95% Senior Unsecured Convertible Notes due 2024 |
|
|
600.0 |
|
|
— |
|
|
5.0% Promissory Note payable to NCM due 2019 |
|
|
1.3 |
|
|
2.8 |
|
|
5.875% Senior Subordinated Notes due 2022 |
|
|
375.0 |
|
|
375.0 |
|
|
6.375% Senior Subordinated Notes due 2024 (£500 million par value) |
|
|
634.1 |
|
|
675.1 |
|
|
5.75% Senior Subordinated Notes due 2025 |
|
|
600.0 |
|
|
600.0 |
|
|
5.875% Senior Subordinated Notes due 2026 |
|
|
595.0 |
|
|
595.0 |
|
|
6.125% Senior Subordinated Notes due 2027 |
|
|
475.0 |
|
|
475.0 |
|
|
Capital and financing lease obligations, 5.75% - 11.5% |
|
|
560.3 |
|
|
651.4 |
|
|
Debt issuance costs |
|
|
(104.4) |
|
|
(103.7) |
|
|
Net premiums and (discounts) |
|
|
(64.4) |
|
|
26.8 |
|
|
Derivative liability |
|
|
24.0 |
|
|
— |
|
|
|
|
|
5,283.2 |
|
|
4,886.7 |
|
|
Less: |
|
|
|
|
|
|
|
|
Current maturities |
|
|
(82.2) |
|
|
(87.7) |
|
|
|
|
$ |
5,201.0 |
|
$ |
4,799.0 |
|
Minimum annual payments required under existing capital and financing lease obligations (net present value thereof) and maturities of corporate borrowings as of December 31, 2018 are as follows:
|
|
|
|
|
|
|
|
|
|
|
|
Principal |
|
|
|
|
|
|
|
|
Capital and Financing Lease Obligations |
|
Amount of |
|
|
|
|
||||||||
|
|
|
Minimum Lease |
|
|
|
|
|
|
|
Corporate |
|
|
|
|
||
|
(In millions) |
|
Payments |
|
Less Interest |
|
Principal |
|
Borrowings |
|
Total |
|
|||||
|
2019 |
|
$ |
100.7 |
|
$ |
33.7 |
|
$ |
67.0 |
|
$ |
15.2 |
|
$ |
82.2 |
|
|
2020 |
|
|
96.6 |
|
|
29.4 |
|
|
67.2 |
|
|
13.8 |
|
|
81.0 |
|
|
2021 |
|
|
87.8 |
|
|
25.2 |
|
|
62.6 |
|
|
13.8 |
|
|
76.4 |
|
|
2022 |
|
|
82.7 |
|
|
21.1 |
|
|
61.6 |
|
|
1,219.7 |
|
|
1,281.3 |
|
|
2023 |
|
|
70.4 |
|
|
17.3 |
|
|
53.1 |
|
|
701.3 |
|
|
754.4 |
|
|
Thereafter |
|
|
331.5 |
|
|
82.7 |
|
|
248.8 |
|
|
2,904.1 |
|
|
3,152.9 |
|
|
Total |
|
$ |
769.7 |
|
$ |
209.4 |
|
$ |
560.3 |
|
$ |
4,867.9 |
|
$ |
5,428.2 |
|
109
Senior Unsecured Convertible Notes due 2024
Carrying value (in millions) as of December 31, 2018:
|
|
|
Carrying Value |
|
|
|
|
|
|
Carrying Value |
|||
|
|
|
at Issuance on |
|
Additional |
|
(Increase) decrease to |
|
as of |
||||
|
|
|
September 14, 2018 |
|
Deferred Charges |
|
Net Earnings |
|
December 31, 2018 |
||||
|
Principal balance |
|
$ |
600.0 |
|
$ |
— |
|
$ |
— |
|
$ |
600.0 |
|
Discount |
|
|
(90.4) |
|
|
— |
|
|
3.7 |
|
|
(86.7) |
|
Debt issuance costs |
|
|
(12.5) |
|
|
(1.1) |
|
|
0.6 |
|
|
(13.0) |
|
Derivative liability |
|
|
90.4 |
|
|
— |
|
|
(66.4) |
|
|
24.0 |
|
Carrying Value |
|
$ |
587.5 |
|
$ |
(1.1) |
|
$ |
(62.1) |
|
$ |
524.3 |
On September 14, 2018, the Company issued $600.0 million aggregate principal amount of its 2.95% Senior Unsecured Convertible Notes due 2024 (the "Convertible Notes due 2024"). The Convertible Notes due 2024 mature on September 15, 2024, subject to earlier conversion by the holders thereof, repurchase by the Company at the option of the holders or redemption by the Company upon the occurrence of certain contingencies, as discussed below. Upon maturity, the $600.0 million principal amount of the Convertible Notes due 2024 will be payable in cash. The Company will pay interest in cash on the Convertible Notes due 2024 at 2.95% per annum, semi-annually in arrears on September 15th and March 15th, commencing on March 15, 2019. The Company used the net proceeds from the sale of the Convertible Notes due 2024 to repurchase and retire 24,057,143 shares of Class B common stock held by Wanda for $17.50 per share or approximately $421.0 million, associated legal fees of $2.6 million, and to pay a special dividend of $1.55 per share of Class A common stock and Class B common stock, or approximately $160.5 million on September 28, 2018 to shareholders of record on September 25, 2018.
The Company bifurcated the conversion feature from the principal balance of the Convertible Notes due 2024 as a derivative liability because (1) a conversion feature is not clearly and closely related to the debt instrument and the reset of the conversion price discussed in the following paragraph causes the conversion feature to not be considered indexed to the Company’s equity, (2) the conversion feature standing alone meets the definition of a derivative, and (3) the Convertible Notes due 2024 are not remeasured at fair value each reporting period with changes in fair value recorded in the consolidated statement of operations. The initial derivative liability of $90.4 million is offset by a discount to the principal balance and is amortized to interest expense resulting in an effective rate of 5.98% over the term of the Convertible Notes due 2024. The Company also recorded debt issuance costs of approximately $13.6 million related to the issuance of the Convertible Notes due 2024 and will amortize those costs to interest expense under the effective interest method over the term of the Convertible Notes due 2024. The Company recorded interest expense for the period from September 14, 2018 to December 31, 2018 of $9.7 million. The derivative liability is remeasured at fair value each reporting period with changes in fair value recorded in the consolidated statement of operations as other expense or income. See Note 15 – Fair Value Measurements for a discussion of the valuation methodology. For the year ended December 31, 2018, this resulted in other income of $66.4 million. The principal balance exceeded the if-converted value of the Convertible Notes due 2024 by approximately $211.2 million as of December 31, 2018 based on the closing price per share of our common stock of $12.28 per share.
The Convertible Notes due 2024 are generally not convertible to equity in the first year after issuance. Upon conversion by a holder thereof, the Company shall deliver, at its election, either cash, shares of the Company’s Class A common stock or a combination of cash and shares of the Company’s Class A common stock at a conversion rate of 52.7704 per $1,000 principal amount of the Convertible Notes due 2024 (which represents an initial conversion price of $18.95), in each case subject to customary anti-dilution adjustments. As of December 31, 2018, the $600.0 million principal balance of the Convertible Notes due 2024 would be convertible into 31,662,269 shares of Class A common stock. In addition to typical anti-dilution adjustments, in the event that the then-applicable conversion price is greater than 120% of the average of the volume-weighted average price of the Company’s Class A common stock for the ten days prior to the second anniversary of issuance (the “Reset Conversion Price”), the conversion price for the Convertible Notes due 2024 is subject to a reset provision that would adjust the conversion price downward to such Reset Conversion Price. However, this conversion price reset provision is subject to a conversion price floor such that the shares of the Company’s Class A common stock issuable upon conversion would not exceed 30% of the Company’s then outstanding fully-diluted share capital after giving effect to the conversion. In addition, a trigger of the reset provision would result in up to 5,666,000 shares of the Company’s Class B common stock held by Wanda becoming subject to forfeiture and retirement by the Company at no additional cost pursuant to the stock repurchase agreement between the Company and
110
Wanda discussed in Note 9 – Stockholders’ Equity. This cancellation agreement is a contingent call option for the forfeiture shares, which is a freestanding derivative measured at fair value on a recurring basis. The feature is contingent on the same reset of the conversion price which is part of the conversion feature. The initial derivative asset of $10.7 million is offset by a credit to stockholders’ equity related to the Class B common stock purchase and cancellation. The forfeiture shares feature is not clearly and closely related to the Convertible Notes due 2024 host and it is bifurcated and accounted for as a derivative asset measured at fair value through earnings each reporting period with changes in fair value recorded in the consolidated statement of operations as other expense or income. See Note 15 – Fair Value Measurements for a discussion of the valuation methodology. For the year ended December 31, 2018, this resulted in other income of $45.0 million. Additionally, the conversion rate will be adjusted if any cash dividend or distribution is made to all or substantially all holders of the Company’s common stock (other than the special dividend referenced above and a regular, quarterly cash dividend that does not exceed $0.20 per share until the second anniversary of issuance and $0.10 per share thereafter). Any Convertible Notes due 2024 that are converted in connection with a Make-Whole Fundamental Change (as defined in the Indenture (the “Indenture”) governing the Convertible Notes due 2024) are, under certain circumstances, entitled to an increase in the conversion rate.
The Company has the option to redeem the Convertible Notes due 2024 for cash on or after the fifth anniversary of issuance at par if the price for the Company’s Class A common stock is equal to or greater than 150% of the then applicable conversion price for 20 or more trading days out of a consecutive 30 day trading period (including the final three trading days), at which time the holders have the option to convert. The Company also has the option to redeem the Convertible Notes due 2024, between the second and third anniversary of issuance, if the reset provision described above is triggered at a redemption price in cash that would result in the noteholders realizing a 15% IRR from the date of issuance regardless of when any particular noteholder acquired its Convertible Notes due 2024. The Company also bifurcated this redemption feature from the principal balance of the Convertible Notes due 2024 and considered it as a part of the overall fair value of the derivative liability.
With certain exceptions, upon a change of control of the Company or if the Company’s Class A common stock is not listed for trading on The New York Stock Exchange, The NASDAQ Global Select Market or The NASDAQ Global Market, the holders of the Convertible Notes due 2024 may require that the Company repurchase in cash all or part of the principal amount of the Convertible Notes due 2024 at a purchase price equal to the principal amount plus accrued and unpaid interest up to, but excluding, the date of repurchase. The Indenture includes restrictive covenants that, subject to specified exceptions and parameters, limit the ability of the Company to incur additional debt and limit the ability of the Company to incur liens with respect to the Company’s senior subordinated notes or any debt incurred to refinance the Company’s senior subordinated notes. The Indenture also includes customary events of default, which may result in the acceleration of the maturity of the Convertible Notes due 2024 under the Indenture.
The Convertible Notes due 2024 are general unsecured senior obligations of the Company and are fully and unconditionally guaranteed on a joint and several senior unsecured basis by all the Company’s existing and future domestic restricted subsidiaries that guarantee its other indebtedness.
On September 14, 2018, in connection with the issuance of the Convertible Notes due 2024, the Company entered into an investment agreement (the “Investment Agreement”) providing for, among other things, registration rights with respect to the Convertible Notes due 2024 and the shares of Class A common stock underlying the Convertible Notes due 2024. Subject to the terms of the Investment Agreement, the Company was required to file a registration statement with the SEC not later than three months from the issuance date of the Convertible Notes in order to provide for resales of the Convertible Notes due 2024 and the shares of Class A common stock underlying the Convertible Notes to be made on a delayed or continuous basis pursuant to Rule 415 under the Securities Act. The Company filed a registration statement with the SEC on December 14, 2018 to fulfill this requirement.
111
Odeon Revolving Credit Facility
On December 7, 2017, the Company entered into a Revolving Credit Facility Agreement with Citigroup Global Markets Limited, Lloyds Bank PLC, Barclays Bank PLC and Bank of America Merrill Lynch International Limited as arrangers. The lenders make available a multicurrency revolving credit facility in an aggregate amount of £100.0 million ($126.8 million as of December 31, 2018). As of December 31, 2018, there were borrowings of £9.4 million ($11.9 million) outstanding and Odeon had £73.9 million ($93.7 million) available for borrowing, net £16.7 million ($21.2 million) letters of credit. The interest rate on each loan when drawn down under the revolving credit facility is 2.5% plus IBOR (meaning LIBOR, EURIBOR, CIBOR or STIBOR as applicable) per annum. The undrawn commitment fee is 0.5% of the undrawn amount per annum. All assets located in England and Wales have been pledged as collateral.
Bridge Loan Agreement
On December 21, 2016, the Company entered into a bridge loan agreement with Citicorp North America, Inc., as administrative agent and the other lenders party thereto (the “Bridge Loan Agreement”). The Company borrowed $350.0 million of interim bridge loans (the “Interim Bridge Loans”) on December 21, 2016 under the Bridge Loan Agreement and recorded approximately $4.4 million in deferred financing costs. The proceeds of the Interim Bridge Loans were used to partially finance the acquisition of Carmike.
On February 13, 2017, the Company repaid the aggregate principal amount of Interim Bridge Loans of $350.0 million with a portion of the proceeds from its public offering of shares of Holdings Class A common stock, as discussed in Note 9 – Stockholders’ Equity. The Company recorded a loss of $0.4 million in other income, which included a write-off of deferred financing costs of $3.7 million, partially offset by a refund of fees of $3.3 million on the extinguishment of indebtedness related to the redemption of the interim bridge loan.
Senior Secured Credit Facility
The Senior Secured Credit Facility is with a syndicate of banks and other financial institutions. The Senior Secured Credit Facility also provides for a Revolving Credit Facility, including a borrowing capacity which is available for letters of credit and for swingline borrowings on same-day notice.
Senior Secured Credit Facility. On April 30, 2013, the Company entered into a $925.0 million Senior Secured Credit Facility pursuant to which the Company borrowed term loans and used the proceeds to fund the redemption of the former Senior Secured Credit Facility term loans. The Senior Secured Credit Facility was comprised of a $150.0 million Revolving Credit Facility, which matured on April 30, 2018 (the “Revolving Credit Facility”), and a $775.0 million term loan, which matures on April 30, 2020 (the “Term Loan due 2020”). The Term Loan due 2020 required repayments of principal of 0.25% of the original principal amount, or $1.9 million, per quarter, with the remaining principal payable upon maturity. The term loan was issued at a 0.25% discount, which was amortized to interest expense over the term of the loan. The Company capitalized deferred financing costs of approximately $6.9 million related to the issuance of the Revolving Credit Facility and approximately $2.2 million related to the issuance of the Term Loan due 2020.
First Amendment. On December 11, 2015, the Company entered into a first amendment to its Senior Secured Credit Agreement dated April 30, 2013 (“First Amendment”). The First Amendment provides for the incurrence of $125.0 million incremental term loans (“Incremental Term Loan”). In addition, the First Amendment, among other things, (a) extends the maturity date with respect to (i) the existing Term Loan due 2020 and the Incremental Term Loan (together “Term Loan due 2022”) to December 15, 2022 and (ii) the Revolving Credit Facility from April 30, 2018 to December 15, 2020 and (b) increases the applicable margin for the Term Loan due 2022 from 1.75% with respect to base rate borrowings to 2.25% and 2.75% with respect to LIBOR borrowings to 3.25%. The Company capitalized additional deferred financing costs of approximately $6.5 million related to the modification of the Revolving Credit Facility and approximately $3.3 million related to the modification of the term loans under the Senior Secured Credit Facility. The proceeds of the Incremental Term Loan were used by the Company to pay expenses related to the First Amendment transactions and the Starplex Cinemas acquisition. The Company recorded a loss of approximately $1.4 million in other expense (income) during the year ended December 31, 2015, which consisted of third-party costs, deferred financing costs, and discount write-off incurred in connection with the modification of the Senior Secured Credit Facility.
Second Amendment. On November 8, 2016, the Company amended its Senior Secured Credit Agreement dated April 30, 2013, as previously amended, to among other things, lower the applicable margin on base rate
112
borrowings from 2.25% to 2.00% and the applicable margin on LIBOR borrowings from 3.25% to 2.75%, to reduce the minimum rate for base rate borrowings from 1.75% to 1.00% and the minimum rate for LIBOR rate borrowings to 0.0% and to allow for additional term loan borrowings of $500 million. On November 29, 2016, the Company borrowed $500.0 million additional Term loans due on December 15, 2023 (“Term Loan due 2023”). The Company recorded deferred financing costs of approximately $18.8 million and a discount of 0.25%, or $1.3 million, related to the Term Loan due 2023. The Company used the net proceeds from the Term Loan due 2023 to pay the consideration for the Odeon acquisition and the related refinancing of Odeon debt assumed in the acquisition.
Borrowings under the Senior Secured Credit Facility bear interest at a rate equal to an applicable margin plus, at the Company’s option, either a base rate or LIBOR. The minimum rate for base rate borrowings is 1.00% and the minimum rate for LIBOR-based borrowings is 0%. The applicable margin for the Terms loan due 2022 and 2023 is 2.00% for base rate borrowings and 2.75% for LIBOR based loans. The applicable margin for the Revolving Credit Facility ranges from 1.25% to 1.5% for base rate borrowings and from 2.25% to 2.5% for LIBOR based borrowings. The Revolving Credit Facility also provides for an unused commitment fee of 0.50% per annum and for letter of credit fees of up to 0.25% per annum plus the applicable margin for LIBOR-based borrowings on the undrawn amount of the letter of credit. The applicable rate for borrowings under the Term Loans due 2022 and 2023 at December 31, 2017 were each 3.727% based on LIBOR (2.75% margin plus 0% minimum LIBOR rate). The Term Loans due 2022 and 2023 requires repayments of principal of 0.25% of the original principal amount, or $3.5 million per quarter, with any remaining balance due on December 15, 2022 or December 15, 2023, as applicable. The Company may voluntarily repay outstanding loans under the Senior Secured Credit Facility at any time without premium or penalty, other than (i) customary “breakage” costs with respect to LIBOR loans and (ii) in connection with a repricing transaction closed (a) in respect of the Term Loans due 2022, within six months from the date the Second Amendment becomes effective or (b) in respect of the Term Loans due 2023, within six months from the date on which the available commitments of the relevant lenders in respect of the Term Loans due 2023 are reduced to zero, in which case the Company must pay a 1% premium on the amount of Term Loans repaid.
The Senior Secured Credit Facility contains a number of covenants that, among other things, restrict, subject to certain exceptions, the ability of the Company and its subsidiaries, to sell assets; incur additional indebtedness; prepay other indebtedness (including the notes); pay dividends and distributions or repurchase their capital stock; create liens on assets; make investments; make acquisitions; engage in mergers or consolidations; engage in transactions with affiliates; amend constituent documents and material agreements governing subordinated indebtedness, including the 5.875% Senior Subordinated Notes due 2022, the 5.75% Senior Subordinated Notes due 2025; the 6.375% Senior Subordinated Notes due 2024, and the 5.875 Senior Subordinated Notes due 2024; change the business conducted by it and its subsidiaries; and enter into agreements that restrict dividends from subsidiaries. In addition, the Senior Secured Credit Facility requires the Company and its subsidiaries to maintain, on the last day of each fiscal quarter, a net senior secured leverage ratio, as defined in the Senior Secured Credit Facility, of no more than 3.25 to 1 as long as the commitments under the Revolving Credit Facility remain outstanding. The Senior Secured Credit Facility also contains certain customary affirmative covenants and events of default, including the occurrence of (i) a change in control, as defined in the Senior Secured Credit Facility, (ii) defaults under other indebtedness of the Company, any guarantor or any significant subsidiary having a principal amount of $25.0 million or more, and (iii) one or more uninsured judgments against the Company, any guarantor, or any significant subsidiary for an aggregate amount exceeding $25.0 million with respect to which enforcement proceedings are brought or a stay of enforcement is not in effect for any period of 60 consecutive days.
Third Amendment. On May 9, 2017, the Company entered into the Third Amendment to Credit Agreement with Citicorp North America, Inc., as administrative agent and the other lenders party thereto (the Third Amendment”), amending the Credit Agreement dated as of April 30, 2013. The Third Amendment decreased the applicable margin for the term loans outstanding under the Credit Agreement from 1.75% to 1.25% with respect to base rate borrowings and 2.75% to 2.25% with respect to LIBOR borrowings. The Company expensed $1.0 million during the year ended December 31, 2017 for third-party fees related to the Third Amendment to the Company’s Senior Secured Credit Agreement.
Fourth Amendment to Credit Agreement. On June 13, 2017, the Company entered into the Fourth Amendment to Credit Agreement with Citicorp North America, Inc., as administrative agent and the other lenders party thereto (the “Fourth Amendment”), amending the Credit Agreement dated as of April 30, 2013. The Fourth Amendment increased the revolving loan commitment under the Credit Agreement from $150.0 million to $225.0 million.
113
Fifth Amendment to Credit Agreement. On August 14, 2018, the Company entered into the Fifth Amendment to Credit Agreement with Citicorp North America, Inc, as administrative agent and the other lenders party thereto (the “Fifth Amendment”), amending the Credit Agreement dated as of April 30, 2013. The Fifth Amendment made certain changes to certain covenants and definitions. These amendments to the Senior Secured Credit Agreement were executed in order to facilitate an internal reorganization due to recent tax changes and to make modifications which clarified certain ambiguities in the Senior Secured Credit Agreement.
The cash flows for the term loans due 2022 and 2023 were not changed as a result of the August 14, 2018 modification and the borrowing capacity under the Revolving Credit Agreement was not changed. As a result, the Company has accounted for the Fifth Amendment as a modification. The Company expensed $0.3 million of third-party costs during the year ended December 31, 2018 and capitalized $1.5 million debt issuance costs for amounts paid to lenders.
All obligations under the Senior Secured Credit Facility are guaranteed by each of the Company’s wholly-owned domestic subsidiaries. All obligations under the Senior Secured Credit Facility, and the guarantees of those obligations (as well as cash management obligations), are secured by substantially all of the Company’s assets as well as those of each subsidiary guarantor.
Senior Secured Notes due 2023
On December 21, 2016, the Company assumed $230.0 million aggregate principal amount of 6.00% Senior Secured Notes due June 15, 2023 (the “Senior Secured Notes due 2023”) in connection with the acquisition of Carmike. Interest is payable on the Senior Secured Notes due 2023 on June 15th and December 15th of each year beginning. The Company recorded the debt at estimated fair value of $242.1 million based on a closing price for the Senior Secured Notes due 2023 of 105.25 on December 21, 2016. Pursuant to a supplemental indenture, dated as of February 17, 2017, among AMC, Carmike, the guarantors party thereto and Wells Fargo Bank, National Association, as trustee to the indenture, dated as of June 17, 2015, providing for the issuance of the Senior Secured Notes due 2023, the Company agreed to provide a guarantee of Carmike’s obligations under the Senior Secured Notes due 2023. The Company provided such guarantee solely for purposes of assuming the reporting obligations of Carmike under the indenture governing the Senior Secured Notes due 2023 and not for the purposes of compliance with any other covenant contained in such indenture.
Notes Due 2022
On February 7, 2014, the Company completed an offering of $375.0 million aggregate principal amount of its Senior Subordinated Notes due 2022 (the “Notes due 2022”) in a private offering. The Company capitalized deferred financing costs of approximately $7.7 million, related to the issuance of the Notes due 2022. The Notes due 2022 mature on February 15, 2022. The Company pays interest on the Notes due 2022 at 5.875% per annum, semi-annually in arrears on February 15th and August 15th, commencing on August 15, 2014. The Company may redeem some or all of the Notes due 2022 at any time on or after February 15, 2017 at 104.406% of the principal amount thereof, declining ratably to 100% of the principal amount thereof on or after February 15, 2020, plus accrued and unpaid interest to the redemption date. Prior to February 15, 2017, the Company may redeem the Notes due 2022 at par plus a make-whole premium. The Company used the net proceeds from the Notes due 2022 private offering, together with a portion of the net proceeds from the Holdings’ IPO, to pay the consideration and consent payments for the tender offer for the Notes due 2019, plus any accrued and unpaid interest and related transaction fees and expenses.
The Notes due 2022 are general unsecured senior subordinated obligations of the Company and are fully and unconditionally guaranteed on a joint and several unsecured senior subordinated basis by all of its existing and future domestic restricted subsidiaries that guarantee its other indebtedness.
The indenture governing the Notes due 2022 contains covenants limiting other indebtedness, dividends, purchases or redemptions of stock, transactions with affiliates and mergers and sales of assets.
The Company filed a registration statement on April 1, 2014 pursuant to the Securities Act of 1933, as amended, relating to an offer to exchange the original Notes due 2022 for exchange Notes due 2022. The registration statement was declared effective on April 9, 2014. After the exchange offer expired on May 9, 2014, all of the original Notes due 2022 were exchanged.
114
Sterling Notes Due 2024
On November 8, 2016, the Company issued £250.0 million aggregate principal amount of its 6.375% Senior Subordinated Notes due 2024 (the "Sterling Notes due 2024") in a private offering. The Company recorded deferred financing costs of approximately $14.1 million related to the issuance of the Sterling Notes due 2024. The Sterling Notes due 2024 mature on November 15, 2024. The Company will pay interest on the Sterling Notes due 2024 at 6.375% per annum, semi-annually in arrears on May 15th and November 15th, commencing on May 15, 2017. The Company may redeem some or all of the Sterling Notes due 2024 at any time on or after November 15, 2019 at 104.781% of the principal amount thereof, declining ratably to 100% of the principal amount thereof on or after November 15, 2022, plus accrued and unpaid interest to the redemption date. On or prior to November 15, 2019, the Company may redeem the Sterling Notes due 2024 at par, including accrued and unpaid interest plus a make-whole premium. The Company used the net proceeds from the Sterling Notes due 2024 private offering to pay the consideration for the Odeon acquisition and the related refinancing of Odeon debt assumed in the acquisition.
The Sterling Notes due 2024 are general unsecured senior subordinated obligations of the Company and are fully and unconditionally guaranteed on a joint and several senior subordinated unsecured basis by all of its existing and future domestic restricted subsidiaries that guarantee its other indebtedness. Following the closing of the Odeon acquisition on November 30, 2016 and the Carmike acquisition on December 21, 2016, neither Odeon or Carmike or any of its subsidiaries will guarantee the Sterling Notes due 2024.
The indenture governing the Sterling Notes due 2024 contains covenants limiting other indebtedness, dividends, purchases or redemptions of stock, transactions with affiliates, and mergers and sales of assets.
On November 8, 2016, in connection with the issuance of the Sterling Notes due 2024, the Company entered into a registration rights agreement. Subject to the terms of the registration rights agreement, the Company is required to (1) file a registration statement with the Securities and Exchange Commission (“SEC”) not later than 270 days from the issuance date with respect to the registered offer to exchange the notes for new notes of the Company having terms identical in all material respects to the notes and (2) use its commercially reasonable efforts to cause the exchange offer registration statement to be declared effective under the Securities Act of 1933 within 365 days of the issuance date.
On March 17, 2017, the Company issued £250.0 million additional aggregate principal amount of its Sterling Notes due 2024 at 106% plus accrued interest from November 8, 2016 in a private offering. These additional Sterling Notes due 2024 were offered as additional notes under an indenture pursuant to which the Company had previously issued and has outstanding £250.0 million aggregate principal amount of its 6.375% Sterling Notes due 2024. The Company recorded deferred financing costs of approximately $12.7 million related to the issuance of the additional Sterling Notes due 2024. The Sterling Notes due 2024 mature on November 15, 2024. The Company will pay interest on the Sterling Notes due 2024 at 6.375% per annum, semi-annually in arrears on May 15th and November 15th, commencing on May 15, 2017. Interest on the additional Sterling Notes will accrue from November 8, 2016. The Company may redeem some or all of the Sterling Notes due 2024 at any time on or after November 15, 2019, at 104.781% of the principal amount thereof, declining ratably to 100% of the principal amount thereof on or after November 15, 2022, plus accrued and unpaid interest to the redemption date. In addition, the Company may redeem up to 35% of the aggregate principal amount of the Sterling Notes due 2024 using net proceeds from certain equity offerings completed on or prior to November 15, 2019. On or prior to November 15, 2019, the Company may redeem the Sterling Notes due 2024 at par, including accrued and unpaid interest plus a make-whole premium. The Company used the net proceeds from the additional Sterling Notes to pay a portion of the consideration for the acquisition of Nordic plus related refinancing of Nordic debt assumed in the acquisition.
On March 17, 2017, in connection with the issuance of the additional Sterling Notes due 2024, the Company entered into a registration rights agreement. Subject to the terms of the registration rights agreement, the Company is required to (1) file one or more registration statements with the SEC not later than 270 days from November 8, 2016 with respect to the registered offer to exchange the notes for new notes of the Company having terms identical in all material respects to the notes and (2) use its commercially reasonable efforts to cause the exchange offer registration statement to be declared effective under the Securities Act within 365 days of November 8, 2016. The Company filed its Form S–4 registration statement related to the registration rights agreement with the Securities and Exchange Commission on April 19, 2017, and it was declared effective June 7, 2017. All of the original notes were exchanged as of July 12, 2017.
115
Notes Due 2025
On June 5, 2015, the Company issued $600.0 million aggregate principal amount of its 5.75% Senior Subordinated Notes due 2025 (the “Notes due 2025”) in a private offering. The Company capitalized deferred financing costs of approximately $11.4 million, related to the issuance of the Notes due 2025. The Notes due 2025 mature on June 15, 2025. The Company will pay interest on the Notes due 2025 at 5.75% per annum, semi-annually in arrears on June 15th and December 15th, commencing on December 15, 2015. The Company may redeem some or all of the Notes due 2025 at any time on or after June 15, 2020 at 102.875% of the principal amount thereof, declining ratably to 100% of the principal amount thereof on or after June 15, 2023, plus accrued and unpaid interest to the redemption date. Prior to June 15, 2020, the Company may redeem the Notes due 2025 at par plus a make-whole premium. The Company used the net proceeds from the Notes due 2025 private offering and cash on hand, to pay the consideration for the tender offer for the Notes due 2020, plus any accrued and unpaid interest and related transaction fees and expenses.
The Notes due 2025 are general unsecured senior subordinated obligations of the Company and are fully and unconditionally guaranteed on a joint and several senior subordinated unsecured basis by all of its existing and future domestic restricted subsidiaries that guarantee its other indebtedness.
The indenture governing the Notes due 2025 contains covenants limiting other indebtedness, dividends, purchases or redemptions of stock, transactions with affiliates, and mergers and sales of assets.
On June 5, 2015, in connection with the issuance of the Notes due 2025, the Company entered into a registration rights agreement. Subject to the terms of the registration rights agreement, the Company filed a registration statement on June 19, 2015 pursuant to the Securities Act of 1933, as amended, relating to an offer to exchange the original Notes due 2025 for exchange Notes due 2025 registered pursuant to an effective registration statement; the registration statement was declared effective on June 29, 2015, and the Company commenced the exchange offer. The exchange notes have terms substantially identical to the original notes except that the exchange notes do not contain terms with respect to transfer restrictions and registration rights and additional interest payable for the failure to consummate the exchange offer within 210 days after the issue date. After the exchange offer expired on July 27, 2015, all of the original Notes due 2025 were exchanged.
Notes Due 2026
On November 8, 2016, the Company issued $595.0 million aggregate principal amount of its 5.875% Senior Subordinated Notes due 2026 (the "Notes due 2026") in a private offering. The Company recorded deferred financing costs of approximately $27.0 million related to the issuance of the Notes due 2026. The Notes due 2026 mature on November 15, 2026. The Company will pay interest on the Notes due 2026 at 5.875% per annum, semi-annually in arrears on May 15th and November 15th, commencing on May 15, 2017. The Company may redeem some or all of the Notes due 2026 at any time on or after November 15, 2021, at 102.938% of the principal amount thereof, declining ratably to 100% of the principal amount thereof on or after November 15, 2024, plus accrued and unpaid interest to the redemption date. On or prior to November 15, 2021, the Company may redeem the Notes due 2026 at par, including accrued and unpaid interest plus a make-whole premium. The Company used the net proceeds from the Notes due 2026 private offering to pay the consideration for the Odeon acquisition and the related refinancing of Odeon debt assumed in the acquisition.
The Notes due 2026 are general unsecured senior subordinated obligations of the Company and are fully and unconditionally guaranteed on a joint and several senior subordinated unsecured basis by all of its existing and future domestic restricted subsidiaries that guarantee its other indebtedness. Following the closing of the Odeon acquisition on November 30, 2016 and the Carmike acquisition on December 21, 2016, neither Odeon or Carmike or any of its subsidiaries will guarantee the Notes due 2026.
The indenture governing the Notes due 2026 contains covenants limiting other indebtedness, dividends, purchases or redemptions of stock, transactions with affiliates, and mergers and sales of assets.
On November 8, 2016, in connection with the issuance of the Notes due 2026, the Company entered into a registration rights agreement. Subject to the terms of the registration rights agreement, the Company is required to (1) file a registration statement with the SEC not later than 270 days from the issuance date with respect to the registered offer to exchange the notes for new notes of the Company having terms identical in all material respects to the notes and
116
(2) use its commercially reasonable efforts to cause the exchange offer registration statement to be declared effective under the Securities Act within 365 days of the issuance date. The Company filed its Form S–4 registration statement related to the registration rights agreement with the Securities and Exchange Commission on April 19, 2017, and it was declared effective June 7, 2017. All of the original notes were exchanged as of July 12, 2017.
Notes Due 2027
On March 17, 2017, the Company issued $475.0 million aggregate principal amount of its 6.125% Senior Subordinated Notes due 2027 (the "Notes due 2027"). The Company recorded deferred financing costs of approximately $19.8 million related to the issuance of the Notes due 2027. The Notes due 2027 mature on May 15, 2027. The Company will pay interest on the Notes due 2027 at 6.125% per annum, semi-annually in arrears on May 15th and November 15th, commencing on November 15, 2017. The Company may redeem some or all of the Notes due 2027 at any time on or after May 15, 2022 at 103.063% of the principal amount thereof, declining ratably to 100% of the principal amount thereof on or after May 15, 2025, plus accrued and unpaid interest to the redemption date. In addition, the Company may redeem up to 35% of the aggregate principal amount of the Notes due 2027 using net proceeds from certain equity offerings completed on or prior to May 15, 2020, at a redemption price as set forth in the indenture governing the Notes due 2027. The Company may redeem some or all of the Notes due 2027 at any time prior to May 15, 2022 at a redemption price equal to 100% of their aggregate principal amount and accrued and unpaid interest to, but not including, the date of redemption, plus an applicable make-whole premium. The Company used the net proceeds from the Notes due 2027 private offering to pay a portion of the consideration for the acquisition of Nordic plus related refinancing of Nordic debt assumed in the acquisition.
The Notes due 2027 are general unsecured senior subordinated obligations of the Company and are fully and unconditionally guaranteed on a joint and several senior subordinated unsecured basis by all of its existing and future domestic restricted subsidiaries that guarantee its other indebtedness. Following the closing of the Nordic acquisition on March 28, 2017, neither Nordic nor any of its subsidiaries guaranteed the Notes due 2027.
The indenture governing the Notes due 2027 contains covenants limiting other indebtedness, dividends, purchases or redemptions of stock, transactions with affiliates, and mergers and sales of assets.
On March 17, 2017, in connection with the issuance of the Notes due 2027, the Company entered into a registration rights agreement. Subject to the terms of the registration rights agreement, the Company is required to (1) file one or more registration statements with the SEC not later than 270 days from the issuance date with respect to the registered offer to exchange the notes for new notes of the Company having terms identical in all material respects to the notes and (2) use its commercially reasonable efforts to cause the exchange offer registration statement to be declared effective under the Securities Act within 365 days of the issuance date. The Company filed its Form S–4 registration statement related to the registration rights agreement with the Securities and Exchange Commission on April 19, 2017, and it was declared effective June 7, 2017. All of the original notes were exchanged as of July 12, 2017.
Promissory Note
See Note 6 – Investments for information regarding the 5% Promissory Note payable to NCM.
Financial Covenants
Each indenture relating to the Notes due 2022, the Sterling Notes due 2024, the Convertible Notes due 2024, the Notes due 2025, the Notes due 2026, and the Notes due 2027 allows the Company to incur specified permitted indebtedness (as defined therein) without restriction. Each indenture also allows the Company to incur any amount of additional debt as long as it can satisfy the coverage ratio of each indenture, after giving effect to the indebtedness on a pro forma basis. Under the indentures for the Notes due 2022, the Sterling Notes due 2024, the Convertible Notes due 2024, the Notes due 2025, the Notes due 2026, and the Notes due 2027 at December 31, 2018, the Company could borrow approximately $621.1 million including amounts discussed below available under its Revolving Credit facility and Odeon’s revolving credit facility. If the Company cannot satisfy the coverage ratios of the indentures, generally it can borrow an additional amount under the Senior Secured Credit Facility. The indentures also contain restrictions on the Company’s ability to pay dividends. Under the most restrictive provision set forth in the note indenture for the Notes due 2022, as of December 31, 2018, the Company could not make dividend payments in excess of approximately $2.5 billion in the aggregate. As of December 31, 2018, the Company had $211.2 million available for borrowing under its Senior
117
Secured Revolving Credit Facility and £73.9 million ($93.7 million) available for borrowing under its Odeon Revolving Credit Facility.
As of December 31, 2018, the Company was in compliance with all financial covenants relating to the Senior Secured Credit Facility, Odeon’s Revolving Credit Facility Agreement, the Senior Secured Notes due 2023, the Notes due 2022, the Sterling Notes due 2024, the Convertible Notes due 2024, the Notes due 2025, the Notes due 2026 and the Notes due 2027.
NOTE 9 – STOCKHOLDERS’ EQUITY
Common Stock Rights and Privileges
The rights of the holders of Holdings’ Class A common stock and Holdings’ Class B common stock are identical, except with respect to voting and conversion applicable to the Class B common stock. Holders of Holdings’ Class A common stock are entitled to one vote per share and holders of Holdings’ Class B common stock are entitled to three votes per share. Holders of Class A common stock and Class B common stock will share ratably (based on the number of shares of common stock held) in any dividend declared by its board of directors, subject to any preferential rights of any outstanding preferred stock. The Class A common stock is not convertible into any other shares of Holdings’ capital stock. Each share of Class B common stock is convertible at any time at the option of the holder into one share of Class A common stock. In addition, each share of Class B common stock shall convert automatically into one share of Class A common stock upon any transfer, whether or not for value, except for certain transfers described in Holdings’ certificate of incorporation.
Dividends
The following is a summary of dividends and dividend equivalents declared to stockholders during the year ended December 31, 2018:
|
|
|
|
|
|
|
Amount per |
|
Total Amount |
||
|
|
|
|
|
|
|
Share of |
|
Declared |
||
|
Declaration Date |
|
Record Date |
|
Date Paid |
|
Common Stock |
|
(In millions) |
||
|
February 28, 2018 |
|
March 12, 2018 |
|
March 26, 2018 |
|
$ |
0.20 |
|
$ |
26.0 |
|
May 3, 2018 |
|
June 11, 2018 |
|
June 25, 2018 |
|
|
0.20 |
|
|
26.0 |
|
July 24, 2018 |
|
September 10, 2018 |
|
September 24, 2018 |
|
|
0.20 |
|
|
25.8 |
|
September 14, 2018 |
|
September 25, 2018 |
|
September 28, 2018 |
|
|
1.55 |
|
|
162.9 |
|
November 1, 2018 |
|
December 10, 2018 |
|
December 26, 2018 |
|
|
0.20 |
|
|
21.2 |
During the year ended December 31, 2018, the Company paid dividends and dividend equivalents of $258.1 million and accrued $4.0 million for the remaining unpaid dividends at December 31, 2018. The aggregate dividends paid for Class A common stock, Class B common stock, and dividend equivalents were approximately $122.0 million, $136.1 million, and $0.1 million, respectively.
On February 15, 2019, the Company declared a cash dividend in the amount of $0.20 per share of Class A and Class B common stock, payable on March 25, 2019 to stockholders of record on March 11, 2019.
The following is a summary of dividends and dividend equivalents declared to stockholders during the year ended December 31, 2017:
|
|
|
|
|
|
|
Amount per |
|
Total Amount |
||
|
|
|
|
|
|
|
Share of |
|
Declared |
||
|
Declaration Date |
|
Record Date |
|
Date Paid |
|
Common Stock |
|
(In millions) |
||
|
February 14, 2017 |
|
March 13, 2017 |
|
March 27, 2017 |
|
|
0.20 |
|
|
26.2 |
|
April 27, 2017 |
|
June 5, 2017 |
|
June 19, 2017 |
|
|
0.20 |
|
|
26.5 |
|
August 3, 2017 |
|
September 11, 2017 |
|
September 25, 2017 |
|
|
0.20 |
|
|
26.5 |
|
October 27, 2017 |
|
December 4, 2017 |
|
December 18, 2017 |
|
|
0.20 |
|
|
25.9 |
During the year ended December 31, 2017, the Company paid dividends and dividend equivalents of $104.6 million and accrued $1.1 million for the remaining unpaid dividends at December 31, 2017. The aggregate
118
dividends paid for Class A common stock, Class B common stock, and dividend equivalents were approximately $43.9 million, $60.6 million, and $0.2 million, respectively.
During the year ended December 31, 2016, the Company paid dividends and dividend equivalents of $79.6 million and accrued $0.5 million for the remaining unpaid dividends at December 31, 2016. The aggregate dividends paid for Class A common stock, Class B common stock, and dividend equivalents were approximately $18.2 million, $60.6 million, and $0.8 million, respectively.
As of December 31, 2018, and December 31, 2017, the Company recorded a receivable due from Wanda of $0.9 million and $0.6 million, respectively for reimbursement of general administrative and other expense incurred on behalf of Wanda. Total reimbursements of other expenses from Wanda were $0.0 million, $0.6 million and $0.5 million for the years ended December 31, 2018, December 31, 2017, and December 31, 2016, respectively. The Company’s majority shareholder, Wanda, owns Legendary Entertainment, a motion picture production company. The Company will occasionally play Legendary’s films in its theatres, as a result of transactions with independent film distributors.
On September 14, 2018, the Company entered into the Investment Agreement with Silver Lake Alpine, L.P., an affiliate of Silver Lake Group, L.L.C. (“Silver Lake”), relating to the issuance to Silver Lake (or its designated affiliates) of $600.0 million principal amount of the Convertible Notes due 2024. See Note 8 – Corporate Borrowings - Senior Unsecured Convertible Notes due 2024 for more information.
On September 14, 2018, the Company, Silver Lake and Wanda entered into a Right of First Refusal Agreement (the “ ROFR Agreement ”), which provides Silver Lake certain rights to purchase shares of the Company’s common stock that Wanda proposes to sell during a period of two years from the date of execution of the ROFR Agreement or, if earlier, until such time that Wanda and its affiliates cease to beneficially own at least 50.1% of the total voting power of the Company’s voting stock. The right of first refusal applies to both registered and unregistered transfers of shares. Under the ROFR Agreement, in the event that Wanda and its affiliates cease to beneficially own at least 50.1% of the total voting power of the Company’s voting stock, then the Company will have the same right of first refusal over sales of the Company’s common stock by Wanda as described above until the expiration of the two-year period beginning on the date of execution of the ROFR Agreement. In such event, the Company may exercise such right to purchase shares from Wanda from time to time pursuant to the ROFR Agreement in its sole discretion, subject to approval by the disinterested directors of the Board. If the Company determines to exercise its right to purchase shares from Wanda pursuant to the ROFR Agreement, it will have the obligation under the Investment Agreement to offer to sell to Silver Lake a like number of shares of the Company’s Class A Common Stock, at the same per share price at which it purchased the Wanda shares.
On September 14, 2018, the Company used the proceeds from the Convertible Notes due 2024, and pursuant to a stock repurchase agreement between the Company and Wanda, repurchased 24,057,143 shares of Class B common stock at a price of $17.50 per share or $421.0 million and associated legal fees of $2.6 million. As of December 31, 2018, Wanda owns 50.01% of AMC through its 51,769,784 shares of Class B common stock. With the three-to-one voting ratio between our Class B and Class A common stock, Wanda retains voting control of AMC with 75.01% of the voting power of the Company’s common stock. As discussed in Note 8 up to 5,666,000 shares of Class B common stock are subject to forfeiture for no consideration in connection with the reset provision contained in the Indenture.
Temporary Equity
Certain members of management have the right to require Holdings to repurchase the Class A common stock held by them under certain limited circumstances pursuant to the terms of a stockholders agreement. Beginning on January 1, 2016 and ending on January 1, 2019 (or upon the termination of a management stockholders employment by the Company without cause, by the management stockholder for good reason, or due to the management stockholders death or disability) management stockholders will have the right, in limited circumstances, to require Holdings to purchase shares that are not fully and freely tradeable at a price equal to the price per share paid by such management stockholder with appropriate adjustments for any subsequent events such as dividends, splits, or combinations. The shares of Class A common stock subject to the stockholder agreement are classified as temporary equity, apart from permanent equity, as a result of the contingent redemption feature contained in the stockholder agreement. The Company
119
determined the amount reflected in temporary equity for the Class A common stock-based on the price paid per share by the management stockholders and Wanda on August 30, 2012, the date Wanda acquired Holdings.
During the year ended December 31, 2018, one former employee and one current employee who held a total of 37,105 shares relinquished their put rights, therefore the related share amount of $0.4 million was reclassified to additional paid in capital, a component of stockholders’ equity.
During the year ended December 31, 2017, a former employee who held 27,197 shares, relinquished his put right, therefore the related amount of $0.3 million was reclassified to additional paid-in capital, a component of stockholders’ equity.
During the year ended December 31, 2016, a former employee who held 27,197 shares, relinquished his put right, therefore the related amount of $0.2 million was reclassified to additional paid-in capital, a component of stockholders’ equity.
The stockholders agreement for certain members of management ended on January 1, 2019 and the contingent redemption feature will no longer be operative in calendar 2019.
Additional Public Offering
On February 13, 2017, the Company completed an additional public offering of 20,330,874 shares of Class A common stock at a price of $31.50 per share ($640.4 million), resulting in net proceeds of $616.8 million after underwriters commission and other professional fees. The Company used a portion of the net proceeds to repay the aggregate principal amount of the Interim Bridge Loan of $350.0 million and general corporate purposes.
Treasury Stock
On August 3, 2017, the Company announced that its Board of Directors had approved a $100.0 million share repurchase program to repurchase its Class A common stock over a two-year period.
Repurchases may be made at management's discretion from time to time through open-market transactions including block purchases, through privately negotiated transactions, or otherwise until mid-August 2019 in accordance with all applicable securities laws and regulations. The extent to which AMC repurchases its shares, and the timing of such repurchases, will depend upon a variety of factors, including liquidity, capital needs of the business, market conditions, regulatory requirements, and other corporate considerations, as determined by AMC’s management team. Repurchases may be made under a Rule 10b5-1 plan, which would permit common stock to be repurchased when the Company’s management might otherwise be precluded from doing so under insider trading laws. The repurchase program does not obligate the Company to repurchase any minimum dollar amount or number of shares and may be suspended for periods or discontinued at any time. During the year ended December 31, 2018, the Company repurchased 500,000 shares of Class A common stock at a cost of $8.2 million. During the year ended December 31, 2017, the Company repurchased 3,195,856 shares of Class A common stock at a cost of $47.5 million. As of December 31, 2018, $44.3 million remained available for repurchase under this plan. A two-year time limit has been set for the completion of this program, expiring August 2, 2019.
Stock-Based Compensation
Holdings adopted a stock-based compensation plan in December 2013.
The Company recorded stock-based compensation expense of $14.9 million, and $5.7 million, and $6.8 million within general and administrative: other during the years ended December 31, 2018, December 31, 2017, and December 31, 2016, respectively. As of December 31, 2018, there was approximately $13.6 million of total unrecognized compensation cost, assuming attainment of the performance targets at 100%, related to stock-based compensation arrangements, of which $9.1 million and $4.5 million is expected to be recognized during the years ended December 31, 2019 and December 31, 2020, respectively.
120
2018 Stock-Based Compensation Summary (in millions):
|
|
|
|
|
|
|
|
|
|
|
|
|
|
|
|
|
|
Amount Recognized |
|
Amount |
|
Expected to |
|
Expected to |
|||
|
|
|
Year Ended |
|
Unrecognized |
|
Recognize |
|
Recognize |
||||
|
Grant |
|
December 31, 2018 |
|
December 31, 2018 |
|
2019 |
|
2020 |
||||
|
2018 Board of Directors |
|
$ |
0.5 |
|
$ |
— |
|
$ |
— |
|
$ |
— |
|
2018 RSU awards |
|
|
3.3 |
|
|
6.7 |
|
|
3.4 |
|
|
3.3 |
|
2018 PSU awards |
|
|
5.8 |
|
|
4.2 |
|
|
3.0 |
|
|
1.2 |
|
2017 RSU awards |
|
|
1.8 |
|
|
1.4 |
|
|
1.4 |
|
|
— |
|
2017 RSU NEO awards |
|
|
1.3 |
|
|
1.3 |
|
|
1.3 |
|
|
— |
|
2017 PSU awards |
|
|
— |
|
|
— |
|
|
— |
|
|
— |
|
2016 RSU awards |
|
|
1.1 |
|
|
— |
|
|
— |
|
|
— |
|
2016 RSU NEO awards |
|
|
1.1 |
|
|
— |
|
|
— |
|
|
— |
|
2016 PSU awards |
|
|
— |
|
|
— |
|
|
— |
|
|
— |
|
|
|
$ |
14.9 |
|
$ |
13.6 |
|
$ |
9.1 |
|
$ |
4.5 |
2013 Equity Incentive Plan
The 2013 Equity Incentive Plan provides for grants of non-qualified stock options, incentive stock options, stock appreciation rights, restricted stock awards, restricted stock units (“RSU’s”), performance stock units (“PSU’s), stock awards, and cash performance awards. The maximum number of shares of Holdings’ common stock available for delivery pursuant to awards granted under the 2013 Equity Incentive Plan is 9,474,000 shares. At December 31, 2018, the aggregate number of shares of Holdings’ common stock available for grant was 6,132,030 shares.
Awards Granted in 2018, 2017, and 2016
AMC’s Board of Directors approved awards of stock, RSU’s, and PSU’s to certain of the Company’s employees and directors under the 2013 Equity Incentive Plan. During years 2018, 2017, and 2016, the grant date fair value of these awards was based on the closing price of AMC’s stock on the date of grant, which ranged from $15.04 to $31.45 per share.
The award agreements generally had the following features:
|
· |
Stock Award Agreement: The Company granted 28,055, 13,684, and 21,342 fully vested shares of Class A common stock to its independent members of AMC’s Board of Directors during the years ended December 31, 2018, December 31, 2017 and December 31, 2016, respectively. In connection with these Class A common stock grants, the Company recognized approximately $0.5, million, $0.4 million, and $0.5 million of expense in general and administrative: other expense during the years ended December 31, 2018, December 31, 2017 and December 31, 2016, respectively. |
|
|
|
Vested |
|
Recognized |
|
|
|
|
Class A |
|
Upon |
|
|
Stock Award Agreement |
|
Common Stock |
|
Grant |
|
|
Year Granted |
|
Granted |
|
(in millions) |
|
|
2018 |
|
28,055 |
|
$ |
0.5 |
|
2017 |
|
13,684 |
|
|
0.4 |
|
2016 |
|
21,342 |
|
|
0.5 |
|
· |
Restricted Stock Unit Award Agreement: The Company granted 656,576, 201,726, and 145,739 RSU awards to certain members of management during the years ended on December 31, 2018, December 31, 2017, and December 31, 2016, respectively. Each RSU represents the right to receive one share of Class A common stock at a future date. The RSUs granted during 2018, 2017, and 2016 vest over three years with 1/3 vesting in each year. These RSUs will be settled within 30 days of vesting. A dividend equivalents equal to the amount paid in respect of one share of Class A common stock underlying the RSUs began to accrue with respect to the RSUs on the date of grant. Such accrued dividend equivalents are paid to the holder upon vesting of the RSUs. The Company recognized approximately $6.2 million, $3.3 million, and |
121
$1.2 million of expense in general and administrative: other expense during the years ended December 31, 2018, December 31, 2017 and December 31, 2016, respectively. |
|
|
|
|
|
Recognized |
|
|
Restricted Stock Unit |
|
|
|
in 2018 |
|
|
Year Granted |
|
Units Granted |
|
(in millions) |
|
|
2018 |
|
656,576 |
|
$ |
3.3 |
|
2017 |
|
201,726 |
|
|
1.8 |
|
2016 |
|
145,739 |
|
|
1.1 |
|
|
|
|
|
$ |
6.2 |
|
· |
Restricted Stock Unit Named Executive Officer Award Agreement: During the year ended December 31, 2017, RSU awards of 129,214 units were granted to certain executive officers covered by Section 162(m) of the Internal Revenue Code. The RSUs will be forfeited if AMC does not achieve a specified cash flow from operating activities target for each of the years ended on December 31, 2017, 2018 and 2019. The RSUs vest over three years with 1/3 vesting in each of 2017, 2018 and 2019 if the cash flow from operating activities target is met. The vested RSUs will be settled within 30 days of vesting. A dividend equivalent equal to the amount paid in respect of one share of Class A common stock underlying the RSUs began to accrue with respect to the RSUs on the date of grant. Such accrued dividend equivalents are paid to the holder upon vesting of the RSUs. The grant date fair value was $4.1 million based on the probable outcome of the performance targets and a stock price of $31.45 on March 31, 2017. The Company recognized expense for these awards of $1.3 million and $1.4 million in general and administrative: other expense, during the each of the years ended December 31, 2018 and December 31, 2017, respectively, based on achievement of the performance condition for 2018 and 2017. |
During the year ended December 31, 2016, RSU awards of 135,981 units were granted to certain executive officers covered by Section 162(m) of the Internal Revenue Code. The RSUs will be forfeited if AMC does not achieve a specified cash flow from operating activities target for each of the years ending December 31, 2016, 2017 and 2018. The RSUs vest over three years with 1/3 vesting in each of 2016, 2018 and 2019 if the cash flow from operating activities target is met. The vested RSUs will be settled within 30 days of vesting. A dividend equivalent equal to the amount paid in respect of one share of Class A common stock underlying the RSUs began to accrue with respect to the RSUs on the date of grant. Such accrued dividend equivalents are paid to the holder upon vesting of the RSUs. The grant date fair value was $3.4 million based on the probable outcome of the performance targets and a stock price of $24.88 on March 1, 2016. The Company recognized expense for these awards of $1.1 million in general and administrative: other expense, during each the of years ended December 31, 2018, December 31, 2017, and December 31, 2016, respectively, based on achievement of the performance conditions for 2018, 2017, and 2016.
|
· |
Performance Stock Unit Award Agreement: During the year ended December 31, 2018, PSU awards of 653,669 were granted to certain members of management and executive officers, with three-year cumulative Adjusted EBITDA, diluted earnings per share, and net profit performance target conditions and service conditions, covering a performance period beginning January 1, 2018 and ending on December 31, 2020. The PSUs will vest based on achieving 80% to 120% of the performance targets with the corresponding vested unit amount ranging from 30% to 200%. If the performance target is met at 100%, the PSU awards granted during the year ended December 31, 2018 will vest at 653,669 units in the aggregate. No PSUs will vest if Holdings does not achieve 80% of the three-year cumulative Adjusted EBITDA, diluted earnings per share, and net profit performance target. Additionally, unvested PSU’s shall be ratably forfeited upon termination of service prior to December 31, 2020. If service terminates prior to January 2, 2019, all unvested PSU’s shall be forfeited, if service terminates prior to January 2, 2020, 2/3 of unvested PSU’s shall be forfeited and if service terminates prior to January 4, 2021, 1/3 of unvested PSU’s shall be forfeited. The vested PSUs will be settled within 30 days of vesting which will occur upon certification of performance results by the Compensation Committee of the Board of Directors. A dividend equivalent equal to the amount paid in respect of one share of Class A common stock underlying the PSUs began to accrue with respect to the PSUs on the date of grant. Such accrued dividend equivalents are paid to the holder upon vesting of the PSUs. The Company recognized expense for these awards of $5.8 million in general and administrative: other expense, during the year ended December 31, 2018. |
122
During the year ended December 31, 2017, PSU awards were granted to certain members of management and executive officers with three-year cumulative net profit, Adjusted EBITDA, and diluted earnings per share performance target conditions and service conditions, covering a performance period beginning January 1, 2017 and ending on December 31, 2019.
During the year ended December 31, 2017, the Company determined that achieving the three-year performance thresholds of the 2017 Performance Stock Units was improbable and reversed $1.8 million of stock-based compensation expense and ceased accruing any additional expense on these units. If the Company later determines that the performance thresholds of the 2017 Performance Stock Units is probable, then historical expense would be reinstated and accruals would resume. The Company did not recognize any further expense in 2018.
During the year ended December 31, 2016, PSU awards were granted to certain members of management and executive officers, with both a three-year cumulative adjusted free cash flow and net earnings performance target condition and a service condition, covering a performance period beginning January 1, 2016 and ended on December 31, 2018.
During the year ended December 31, 2017, the Company determined that achieving the three-year performance thresholds of the 2016 Performance Stock Units was improbable and reversed $2.0 million of stock-based compensation expense and ceased accruing any additional expense on these units. If the Company later determines that the performance thresholds of the 2016 Performance Stock Units becomes probable, then historical expense would be reinstated and accruals would resume. The Company did not recognize any further expense in 2018.
|
· |
Performance Stock Unit Transition Award: In recognition of the shift in 2016 from one-year to three-year performance periods for annual equity awards, on March 31, 2017, PSU transition awards were granted to certain members of management and executive officers, with net profit, Adjusted EBITDA, and diluted earnings per share performance target conditions and a service condition, covering a performance period beginning January 1, 2017 and ended on December 31, 2017. |
No PSU Transition Awards vested in 2017 as the Company did not meet the fiscal year 2017 net profit threshold, and as a result, all of the PSUTs were forfeited and the units were returned to the 2013 Employee Incentive Plan pool.
In recognition of the shift from one year to three year performance periods for annual equity awards, during the year ended December 31, 2016, PSU transition awards were granted to certain members of management and executive officers, with both a 2016 adjusted free cash flow and net earnings performance target condition and a service condition, covering a performance period beginning January 1, 2016 and ended on December 31, 2016.
No PSU Transition Awards vested in 2016 as the Company did not achieve the adjusted free cash flow or net earnings minimum performance target.
123
The following table represents the nonvested RSU and PSU activity for the years ended December 31, 2018, December 31, 2017 and December 31, 2016:
|
|
|
|
|
Weighted |
|
|
|
|
|
|
Average |
|
|
|
|
Shares of RSU |
|
Grant Date |
|
|
|
|
and PSU |
|
Fair Value |
|
|
Beginning balance at January 1, 2016 |
|
19,226 |
|
|
29.59 |
|
Granted |
|
618,092 |
|
|
24.88 |
|
Vested |
|
(19,226) |
|
|
29.59 |
|
Forfeited |
|
(7,767) |
|
|
24.88 |
|
Cancelled (1) |
|
(53,815) |
|
|
24.88 |
|
Beginning balance at January 1, 2017 |
|
556,510 |
|
$ |
24.88 |
|
Granted |
|
701,788 |
|
|
31.23 |
|
Vested |
|
(92,722) |
|
|
24.88 |
|
Forfeited |
|
(44,309) |
|
|
28.68 |
|
Cancelled (1) |
|
(37,426) |
|
|
31.45 |
|
Beginning balance at January 1, 2018 |
|
1,083,841 |
|
$ |
28.61 |
|
Granted |
|
1,313,152 |
|
|
15.65 |
|
Vested |
|
(408,848) |
|
|
21.68 |
|
Forfeited |
|
(53,698) |
|
|
20.69 |
|
Nonvested at December 31, 2018 |
|
1,934,447 |
|
$ |
21.50 |
|
(1) |
No PSU Transition Awards vested as the Company did not achieve the adjusted free cash flow or net earnings minimum performance target. |
NOTE 10 – INCOME TAXES
Current income tax expense represents the amounts expected to be reported on the Company’s income tax returns, and deferred tax expense or benefit represents the change in net deferred tax assets and liabilities. Deferred tax assets and liabilities are determined based on the difference between the financial statement and tax bases of assets and liabilities as measured by the enacted tax rates that will be in effect when these differences reverse. Valuation allowances are recorded as appropriate to reduce deferred tax assets to the amount considered likely to be realized.
Management assesses the available positive and negative evidence to estimate whether sufficient future taxable income will be generated to permit use of the existing deferred tax assets. A significant piece of objective negative evidence evaluated was the cumulative loss incurred over the three-year period ended December 31, 2018. Such objective evidence limits the ability to consider other subjective evidence, such as the Company’s projections for future taxable income. For the year ended December 31, 2018, the Company remained in a cumulative loss over the past three-year period.
On the basis of this evaluation, for the year ended December 31, 2017, a valuation allowance of $221.6 million was established domestically on the Company’s net deferred tax assets and considering indefinite-lived intangibles. The amount of deferred tax asset considered realizable, however, could be adjusted if estimates of future taxable income is reduced or increased or if objective negative evidence in the form of cumulative losses is no longer present and additional weight is given to subjective evidence such as the Company’s projections for future taxable income. For the year ended December 31, 2018, the Company maintained its valuation allowance.
On December 22, 2017, the President of the United States signed into law H.R. 1 (the “Tax Reform Act”). The legislation significantly changes U.S. tax law by, among other things, lowering corporate income tax rates, limiting the amount of deductible interest expense, limiting executive compensations, implementing a territorial tax system, and imposing a repatriation tax on deemed repatriated earnings of foreign subsidiaries. The Tax Reform Act permanently reduces the U.S. corporate income tax rate from a maximum of 35% to a flat 21% rate, effective January 1, 2018.
The Company uses the asset and liability method of accounting for income taxes. Under this method, deferred tax assets and liabilities are recognized based on the differences between the financial statement carrying amounts of
124
existing assets and liabilities and their respective tax basis. Deferred tax assets and liabilities are measured using enacted tax rates expected to apply to taxable income in the years in which those temporary differences are expected to reverse. As a result of the reduction in the U.S. corporate income tax rate from 35% to 21% under the Tax Reform Act, the Company revalued its ending net deferred tax assets and related valuation allowance at December 31, 2017. As a result, the Company recognized a tax benefit of $121.8 million in the consolidated statement of operations for the year ended December 31, 2017. This tax benefit is comprised of $88.6 million of deferred tax expense associated with the revaluation of the Company’s net deferred tax assets, as reflected in the rate reconciliation, and $210.4 million of deferred tax benefit associated with the partial release of the Company’s valuation allowance as a result of the Tax Reform Act.
The Company has assessed the deemed mandatory repatriation provisions of the Tax Reform Act, and is projecting no impact to current year domestic taxable income as it relates to undistributed earnings of its foreign subsidiaries. The Company does not intend to distribute earnings in a taxable manner, and therefore intends to limit distributions to earnings previously taxed in the U.S., or earnings that would qualify for the 100 percent dividends received deduction provided for in the Tax Reform Act, and earnings that would not result in any significant foreign taxes. As a result, the Company has not recognized a deferred tax liability on its investment in foreign subsidiaries.
While the Tax Reform Act provides for a territorial tax system, beginning in 2018, it includes two new U.S. tax base erosion provisions, the global intangible low-taxed income (“GILTI”) provisions and the base-erosion and anti-abuse tax (“BEAT”) provisions.
The GILTI provisions require the Company to include in its U.S. income tax return foreign subsidiary earnings in excess of an allowable return on the foreign subsidiary’s tangible assets. The Company does not expect it will be subject to this tax in the current year and therefore has not included any tax impacts of GILTI in its consolidated financial statements for the year ended December 31, 2018.
The BEAT provisions in the Tax Reform Act eliminates the deduction of certain base-erosion payments made to related foreign corporations, and impose a minimum tax if greater than regular tax. The Company does not expect it will be subject to this tax in the current year and therefore has not included any tax impacts of BEAT in its consolidated financial statements for the year ended December 31, 2018.
The Income tax provision reflected in the consolidated statements of operations consists of the following components:
|
|
|
Year Ended |
|
|||||||
|
(In millions) |
|
December 31, 2018 |
|
December 31, 2017 |
|
December 31, 2016 |
|
|||
|
Current: |
|
|
|
|
|
|
|
|
|
|
|
Federal |
|
$ |
(0.5) |
|
$ |
(13.4) |
|
$ |
0.4 |
|
|
Foreign |
|
|
5.0 |
|
|
5.3 |
|
|
1.5 |
|
|
State |
|
|
15.5 |
|
|
4.4 |
|
|
2.0 |
|
|
Total current |
|
|
20.0 |
|
|
(3.7) |
|
|
3.9 |
|
|
Deferred: |
|
|
|
|
|
|
|
|
|
|
|
Federal |
|
|
0.8 |
|
|
116.4 |
|
|
37.8 |
|
|
Foreign |
|
|
(7.5) |
|
|
(5.5) |
|
|
(4.1) |
|
|
State |
|
|
0.3 |
|
|
46.9 |
|
|
0.4 |
|
|
Total deferred |
|
|
(6.4) |
|
|
157.8 |
|
|
34.1 |
|
|
Total provision |
|
$ |
13.6 |
|
$ |
154.1 |
|
$ |
38.0 |
|
The Company generated alternative minimum taxes for the year ended December 31, 2017, which fully offset the taxes due to the utilization of tax credits. Under the Tax Reform Act, alternative minimum tax credit will be refundable in the future. The Company has reclassed the alternative minimum tax credits from deferred tax assets to a long-term tax receivable.
125
Pre-tax income (losses) consisted of the following:
|
|
|
Year Ended |
|
|||||||
|
(In millions) |
|
December 31, 2018 |
|
December 31, 2017 |
|
December 31, 2016 |
|
|||
|
Domestic |
|
$ |
154.4 |
|
$ |
(362.3) |
|
$ |
135.4 |
|
|
Foreign |
|
|
(30.7) |
|
|
29.2 |
|
|
14.3 |
|
|
Total |
|
$ |
123.7 |
|
$ |
(333.1) |
|
$ |
149.7 |
|
The difference between the effective tax rate on earnings from continuing operations before income taxes and the U.S. federal income tax statutory rate is as follows:
|
|
|
Year Ended |
|
|||||||
|
(In millions) |
|
December 31, 2018 |
|
December 31, 2017 |
|
December 31, 2016 |
|
|||
|
Income tax expense at the federal statutory rate |
|
$ |
26.0 |
|
$ |
(116.6) |
|
$ |
52.4 |
|
|
Effect of: |
|
|
|
|
|
|
|
|
|
|
|
State income taxes |
|
|
8.9 |
|
|
(17.6) |
|
|
6.5 |
|
|
Increase (decrease) in reserve for uncertain tax positions |
|
|
5.2 |
|
|
2.1 |
|
|
(19.2) |
|
|
Federal and state credits |
|
|
(5.9) |
|
|
(5.2) |
|
|
(2.7) |
|
|
Permanent items - transaction costs |
|
|
— |
|
|
2.0 |
|
|
5.7 |
|
|
Permanent items - other |
|
|
5.7 |
|
|
(9.4) |
|
|
4.4 |
|
|
Foreign rate differential |
|
|
(5.9) |
|
|
(15.3) |
|
|
(2.2) |
|
|
Change in legislation |
|
|
— |
|
|
88.6 |
|
|
(9.9) |
|
|
Other |
|
|
9.7 |
|
|
4.9 |
|
|
0.2 |
|
|
Valuation allowance |
|
|
(30.1) |
|
|
220.6 |
|
|
2.8 |
|
|
Income tax expense (benefit) |
|
$ |
13.6 |
|
$ |
154.1 |
|
$ |
38.0 |
|
|
Effective income tax rate |
|
|
11.0 |
% |
|
(46.3) |
% |
|
25.4 |
% |
The valuation allowance expense reflected in the 2017 tax rate reconciliation of $220.6 million consists of the initial domestic recognition of $432.0 million, net of domestic reductions due to the tax reform act of $(210.4) million and changes due to international operations of $(1.0) million.
The significant components of deferred income tax assets and liabilities as of December 31, 2018 and December 31, 2017 are as follows:
|
|
|
December 31, 2018 |
|
December 31, 2017 |
|
||||||||
|
|
|
Deferred Income Tax |
|
Deferred Income Tax |
|
||||||||
|
(In millions) |
|
Assets |
|
Liabilities |
|
Assets |
|
Liabilities |
|
||||
|
Tangible assets |
|
$ |
— |
|
$ |
(210.6) |
|
$ |
— |
|
$ |
(209.7) |
|
|
Accrued liabilities |
|
|
13.6 |
|
|
— |
|
|
17.0 |
|
|
— |
|
|
Intangible assets |
|
|
— |
|
|
(128.7) |
|
|
— |
|
|
(126.4) |
|
|
Receivables |
|
|
— |
|
|
(3.7) |
|
|
— |
|
|
(9.1) |
|
|
Investments |
|
|
12.0 |
|
|
— |
|
|
— |
|
|
(64.0) |
|
|
Capital loss carryforwards |
|
|
1.0 |
|
|
— |
|
|
— |
|
|
— |
|
|
Pension, postretirement and deferred compensation |
|
|
21.9 |
|
|
— |
|
|
22.0 |
|
|
— |
|
|
Corporate borrowings |
|
|
— |
|
|
(111.6) |
|
|
— |
|
|
(90.8) |
|
|
Deferred revenue |
|
|
201.7 |
|
|
— |
|
|
187.0 |
|
|
— |
|
|
Lease liabilities |
|
|
165.6 |
|
|
— |
|
|
165.7 |
|
|
— |
|
|
Capital and financing lease obligations |
|
|
118.5 |
|
|
— |
|
|
144.7 |
|
|
— |
|
|
Other credit carryovers |
|
|
17.7 |
|
|
— |
|
|
16.6 |
|
|
— |
|
|
Other comprehensive income |
|
|
— |
|
|
(1.0) |
|
|
— |
|
|
(0.4) |
|
|
Net operating loss carryforwards |
|
|
214.2 |
|
|
— |
|
|
265.1 |
|
|
— |
|
|
Total |
|
$ |
766.2 |
|
$ |
(455.6) |
|
$ |
818.1 |
|
$ |
(500.4) |
|
|
Less: Valuation allowance |
|
|
(323.6) |
|
|
— |
|
|
(338.4) |
|
|
— |
|
|
Net deferred income taxes |
|
$ |
442.6 |
|
$ |
(455.6) |
|
$ |
479.7 |
|
$ |
(500.4) |
|
126
A rollforward of the Company’s valuation allowance for deferred tax assets is as follows:
|
|
|
|
|
|
Additions |
|
|
|
Charged |
|
|
|
|
|
|
Balance at |
|
Charged |
|
Charged |
|
(Credited) to |
|
|
||
|
|
|
Beginning of |
|
(Credited) to |
|
(Credited) to |
|
Other |
|
Balance at |
||
|
(In millions) |
|
Period |
|
Expenses |
|
Goodwill |
|
Accounts(1) |
|
End of Period |
||
|
Calendar Year 2018 |
|
|
|
|
|
|
|
|
|
|
|
|
|
Valuation allowance-deferred income tax assets |
|
$ |
338.4 |
|
(30.1) |
|
— |
|
15.3 |
|
$ |
323.6 |
|
Calendar Year 2017 |
|
|
|
|
|
|
|
|
|
|
|
|
|
Valuation allowance-deferred income tax assets |
|
$ |
112.2 |
|
220.6 |
|
(9.1) |
|
14.7 |
|
$ |
338.4 |
|
Calendar Year 2016 |
|
|
|
|
|
|
|
|
|
|
|
|
|
Valuation allowance-deferred income tax assets |
|
$ |
0.5 |
|
2.8 |
|
108.9 |
|
— |
|
$ |
112.2 |
|
(1) |
Primarily relates to amounts resulting from the Company’s changes in deferred tax assets and associated valuation allowance that are not related to income statement activity as well as amounts charged to other comprehensive income. |
The Company’s federal income tax loss carryforward of $212.8 million will begin to expire in 2019 and will completely expire in 2036 and will be limited annually due to certain change in ownership provisions of the Internal Revenue Code. The Company’s foreign net operating losses of $652.6 million can be used indefinitely except for approximately $6.8 million, which will expire in various periods ranging from 1 to 20 years. The Company also has state income tax loss carryforwards of $243.5 million, which may be used over various periods ranging from 1 to 20 years.
A reconciliation of the change in the amount of unrecognized tax benefits was as follows:
|
|
|
Year Ended |
|
|||||||
|
(In millions) |
|
December 31, 2018 |
|
December 31, 2017 |
|
December 31, 2016 |
|
|||
|
Balance at beginning of period |
|
$ |
15.3 |
|
$ |
12.7 |
|
$ |
30.1 |
|
|
Gross increases—current period tax positions |
|
|
7.3 |
|
|
3.2 |
|
|
1.7 |
|
|
Gross decreases—prior period tax positions |
|
|
(0.6) |
|
|
0.3 |
|
|
0.1 |
|
|
Favorable resolutions with authorities |
|
|
— |
|
|
— |
|
|
(19.2) |
|
|
Impact of legislation change |
|
|
— |
|
|
(0.9) |
|
|
— |
|
|
Balance at end of period |
|
$ |
22.0 |
|
$ |
15.3 |
|
$ |
12.7 |
|
The Company recognizes income tax-related interest expense and penalties as income tax expense and general and administrative expense, respectively. No interest expense related to federal uncertain tax positions have been recognized for the year ended December 31, 2018 and December 31, 2017, respectively.
The Company analyzed and reviewed the remaining state uncertain tax positions to determine the necessity of accruing interest and penalties. For the year ended December 31, 2018, the Company determined it is not necessary to accrue interest and penalties. The total amount of accrued interest and penalties for state uncertain tax positions at December 31, 2018 and December 31, 2017 was $0.1 million and $0.1 million, respectively.
The total amount of net unrecognized tax benefits at December 31, 2018 and December 31, 2017 that would impact the effective tax rate, if recognized, would be $15.2 million and $12.6 million, respectively. There are currently, unrecognized tax benefits which the Company anticipates will be resolved in the next 12 months; however, the Company is unable at this time to estimate what the impact on its unrecognized tax benefits will be.
The Company or one of its subsidiaries files income tax returns in the U.S. federal jurisdiction, and various state and foreign jurisdictions. An IRS examination of the tax year March 29, 2012 is currently ongoing. Generally, tax years beginning after March 28, 2002 are still open to examination by various taxing authorities. Additionally, as discussed above, the Company has net operating loss (“NOL”) carryforwards for tax years ended December 31, 2000, through December 31, 2017, in the U.S. and various state jurisdictions which have carryforwards of varying lengths of time. These NOLs are subject to adjustment based on the statute of limitations applicable to the return in which they are utilized, not the year in which they are generated. Various state, local and foreign income tax returns are also under examination by taxing authorities. The Company does not believe that the outcome of any examination will have a material impact on its consolidated financial statements.
127
NOTE 11 – LEASES
The following table sets forth the future minimum rental payments, by calendar year, required under existing operating leases and digital projector equipment leases payable to DCIP that have initial or remaining non-cancelable terms in excess of one year as of December 31, 2018:
|
|
|
Minimum operating |
|
|
|
(In millions) |
|
lease payments |
|
|
|
2019 |
|
$ |
810.2 |
|
|
2020 |
|
|
801.9 |
|
|
2021 |
|
|
748.9 |
|
|
2022 |
|
|
687.5 |
|
|
2023 |
|
|
597.1 |
|
|
Thereafter |
|
|
3,367.6 |
|
|
Total minimum payments required |
|
$ |
7,013.2 |
|
As of December 31, 2018, the Company has lease agreements for 19 theatres with 155 screens which are under construction or development and are expected to open from 2019 to 2020.
Rent expense is summarized as follows:
|
|
|
Year Ended |
|
Year Ended |
|
Year Ended |
|
|||
|
(In millions) |
|
December 31, 2018 |
|
December 31, 2017 |
|
December 31, 2016 |
|
|||
|
Minimum rentals |
|
$ |
678.1 |
|
$ |
682.7 |
|
$ |
440.5 |
|
|
Common area expenses |
|
|
104.3 |
|
|
97.4 |
|
|
51.0 |
|
|
Percentage rentals based on revenues |
|
|
15.4 |
|
|
14.3 |
|
|
14.0 |
|
|
Rent |
|
|
797.8 |
|
|
794.4 |
|
|
505.5 |
|
|
General and administrative and other |
|
|
29.7 |
|
|
26.3 |
|
|
7.6 |
|
|
Total |
|
$ |
827.5 |
|
$ |
820.7 |
|
$ |
513.1 |
|
NOTE 12 – EMPLOYEE BENEFIT PLANS
The Company sponsors frozen non-contributory qualified and non-qualified defined benefit pension plans generally covering all employees in the U.S. who, prior to the freeze, were age 21 or older and had completed at least 1,000 hours of service in their first year of employment, or in a calendar year ending thereafter, and who were not covered by a collective bargaining agreement. The Company sponsors frozen defined benefit pension plans in the U.K. that were acquired from Odeon on November 30, 2016. The Company sponsors a frozen defined benefit pension plan in Sweden that was acquired from Nordic on March 28, 2017. The Company also offered eligible retirees the opportunity to participate in a health plan. Certain employees were eligible for subsidized postretirement medical benefits. The eligibility for these benefits was based upon a participant’s age and service as of January 1, 2009. The Company also sponsors a postretirement deferred compensation plan.
The measurement dates used to determine pension and other postretirement benefits were December 31, 2018, December 31, 2017, and December 31, 2016.
Net periodic benefit cost for the plans consists of the following:
|
|
|
U.S. Pension Benefits |
|||||||
|
|
|
Year Ended |
|||||||
|
(In millions) |
|
December 31, 2018 |
|
December 31, 2017 |
|
December 31, 2016 |
|||
|
Components of net periodic benefit cost: |
|
|
|
|
|
|
|
|
|
|
Interest cost |
|
$ |
4.0 |
|
$ |
4.2 |
|
$ |
4.3 |
|
Expected return on plan assets |
|
|
(3.2) |
|
|
(3.2) |
|
|
(3.5) |
|
Settlement loss |
|
|
0.4 |
|
|
— |
|
|
— |
|
Net periodic benefit cost |
|
$ |
1.2 |
|
$ |
1.0 |
|
$ |
0.8 |
128
|
|
|
International Pension Benefits |
|||||||
|
|
|
Year Ended |
|||||||
|
(In millions) |
|
December 31, 2018 |
|
December 31, 2017 |
|
December 31, 2016 |
|||
|
Components of net periodic benefit cost: |
|
|
|
|
|
|
|
|
|
|
Service cost |
|
$ |
0.5 |
|
$ |
0.4 |
|
$ |
— |
|
Interest cost |
|
|
2.6 |
|
|
3.0 |
|
|
0.2 |
|
Expected return on plan assets |
|
|
(3.2) |
|
|
(3.5) |
|
|
(0.3) |
|
Amortization of net loss |
|
|
0.1 |
|
|
0.1 |
|
|
— |
|
Settlement (gain) loss |
|
|
(0.1) |
|
|
(0.4) |
|
|
— |
|
Net periodic benefit credit |
|
$ |
(0.1) |
|
$ |
(0.4) |
|
$ |
(0.1) |
The following table summarizes the changes in other comprehensive income (loss):
|
|
|
U.S. Pension Benefits |
|||||||
|
|
|
Year Ended |
|||||||
|
(In millions) |
|
December 31, 2018 |
|
December 31, 2017 |
|
December 31, 2016 |
|||
|
Net (gain) loss |
|
$ |
(6.3) |
|
$ |
5.4 |
|
$ |
0.6 |
|
Amortization of net gain |
|
|
(0.1) |
|
|
— |
|
|
— |
|
Total recognized in other comprehensive (income) loss |
|
$ |
(6.4) |
|
$ |
5.4 |
|
$ |
0.6 |
|
Net periodic benefit cost |
|
|
1.2 |
|
|
1.0 |
|
|
0.8 |
|
Total recognized in net periodic benefit cost (credit) and other comprehensive (income) loss |
|
$ |
(5.2) |
|
$ |
6.4 |
|
$ |
1.4 |
|
|
|
International Pension Benefits |
|||||||
|
|
|
Year Ended |
|||||||
|
(In millions) |
|
December 31, 2018 |
|
December 31, 2017 |
|
December 31, 2016 |
|||
|
Net (gain) loss |
|
$ |
1.6 |
|
$ |
(2.8) |
|
$ |
(0.1) |
|
Prior service credit |
|
|
0.8 |
|
|
— |
|
|
— |
|
Settlement |
|
|
0.1 |
|
|
— |
|
|
— |
|
Allocated tax expense (benefit) |
|
|
(0.4) |
|
|
0.4 |
|
|
— |
|
Total recognized in other comprehensive (income) loss |
|
$ |
2.1 |
|
$ |
(2.4) |
|
$ |
(0.1) |
|
Net periodic benefit cost (credit) |
|
|
(0.1) |
|
|
(0.4) |
|
|
(0.1) |
|
Total recognized in net periodic benefit cost (credit) and other comprehensive (income) loss |
|
$ |
2.0 |
|
$ |
(2.8) |
|
$ |
(0.2) |
The following tables set forth the plan’s change in benefit obligations and plan assets and the accrued liability for benefit costs included in the Consolidated Balance Sheets:
|
|
|
U.S. Pension Benefits |
||||
|
|
|
Year Ended |
||||
|
(In millions) |
|
December 31, 2018 |
|
December 31, 2017 |
||
|
Change in benefit obligation: |
|
|
|
|
|
|
|
Benefit obligation at beginning of period |
|
$ |
117.4 |
|
$ |
109.0 |
|
Interest cost |
|
|
4.0 |
|
|
4.2 |
|
Actuarial (gain) loss |
|
|
(12.3) |
|
|
12.0 |
|
Benefits paid |
|
|
(3.9) |
|
|
(7.8) |
|
Settlement paid |
|
|
(4.5) |
|
|
— |
|
Settlement loss |
|
|
0.4 |
|
|
— |
|
Benefit obligation at end of period |
|
$ |
101.1 |
|
$ |
117.4 |
129
|
|
|
International Pension Benefits |
||||
|
|
|
Year Ended |
||||
|
(In millions) |
|
December 31, 2018 |
|
December 31, 2017(1) |
||
|
Change in benefit obligation: |
|
|
|
|
|
|
|
Benefit obligation at beginning of period |
|
$ |
110.1 |
|
$ |
93.3 |
|
Acquisition |
|
|
— |
|
|
11.7 |
|
Service cost |
|
|
0.5 |
|
|
0.4 |
|
Interest cost |
|
|
2.6 |
|
|
3.0 |
|
Plan participants’ contributions |
|
|
— |
|
|
— |
|
Actuarial (gain) loss |
|
|
(4.1) |
|
|
1.1 |
|
Plan amendment |
|
|
0.8 |
|
|
— |
|
Benefits paid |
|
|
(2.8) |
|
|
(3.2) |
|
Administrative expenses |
|
|
— |
|
|
— |
|
Settlement paid |
|
|
(1.4) |
|
|
(6.0) |
|
Currency translation adjustment |
|
|
(7.1) |
|
|
9.8 |
|
Benefit obligation at end of period |
|
$ |
98.6 |
|
$ |
110.1 |
|
(1) |
Activity for calendar 2017 reflects activity for the International Pension Benefits assumed from Odeon in November 2016 and Nordic assumed in March 2017. |
|
|
|
U.S. Pension Benefits |
||||
|
|
|
Year Ended |
||||
|
(In millions) |
|
December 31, 2018 |
|
December 31, 2017 |
||
|
Change in plan assets: |
|
|
|
|
|
|
|
Fair value of plan assets at beginning of period |
|
$ |
70.2 |
|
$ |
65.3 |
|
Actual return on plan assets gain |
|
|
(2.6) |
|
|
9.9 |
|
Employer contribution |
|
|
4.0 |
|
|
2.7 |
|
Benefits paid |
|
|
(2.3) |
|
|
(6.1) |
|
Administrative expense |
|
|
(1.6) |
|
|
(1.6) |
|
Settlement paid |
|
|
(4.5) |
|
|
— |
|
Fair value of plan assets at end of period |
|
$ |
63.2 |
|
$ |
70.2 |
|
Net liability for benefit cost: |
|
|
|
|
|
|
|
Funded status |
|
$ |
(37.9) |
|
$ |
(47.2) |
|
|
|
International Pension Benefits |
||||
|
|
|
Year Ended |
||||
|
(In millions) |
|
December 31, 2018 |
|
December 31, 2017 |
||
|
Change in plan assets: |
|
|
|
|
|
|
|
Fair value of plan assets at beginning of period |
|
$ |
121.1 |
|
$ |
111.1 |
|
Acquisition |
|
|
— |
|
|
— |
|
Actual return on plan assets gain |
|
|
(2.5) |
|
|
7.6 |
|
Employer contribution |
|
|
— |
|
|
1.1 |
|
Benefits paid |
|
|
(2.7) |
|
|
(3.2) |
|
Settlement paid |
|
|
(1.4) |
|
|
(6.0) |
|
Currency translation adjustment |
|
|
(7.3) |
|
|
10.5 |
|
Fair value of plan assets at end of period |
|
$ |
107.2 |
|
$ |
121.1 |
|
Net asset for benefit cost: |
|
|
|
|
|
|
|
Funded status |
|
$ |
8.6 |
|
$ |
11.1 |
130
|
|
|
U.S. Pension Benefits |
|
International Pension Benefits |
|
||||||||
|
(In millions) |
|
December 31, 2018 |
|
December 31, 2017 |
|
December 31, 2018 |
|
December 31, 2017 |
|
||||
|
Amounts recognized in the Balance Sheet: |
|
|
|
|
|
|
|
|
|
|
|
|
|
|
Other long-term assets |
|
$ |
— |
|
$ |
— |
|
$ |
25.7 |
|
$ |
26.9 |
|
|
Accrued expenses and other liabilities |
|
|
(0.3) |
|
|
(0.3) |
|
|
— |
|
|
— |
|
|
Other long-term liabilities |
|
|
(37.5) |
|
|
(46.9) |
|
|
(17.1) |
|
|
(15.8) |
|
|
Net asset (liability) recognized |
|
$ |
(37.8) |
|
$ |
(47.2) |
|
$ |
8.6 |
|
$ |
11.1 |
|
The following table summarizes pension plans with accumulated benefit obligations and projected benefit obligations in excess of plan assets:
|
|
|
U.S. Pension Benefits |
|
International Pension Benefits |
||||||||
|
(In millions) |
|
December 31, 2018 |
|
December 31, 2017 |
|
December 31, 2018 |
|
December 31, 2017 |
||||
|
Aggregated accumulated benefit obligation |
|
$ |
(101.1) |
|
$ |
(117.4) |
|
$ |
(95.8) |
|
$ |
(107.4) |
|
Aggregated projected benefit obligation |
|
|
(101.1) |
|
|
(117.4) |
|
|
(98.6) |
|
|
(110.1) |
|
Aggregated fair value of plan assets |
|
|
63.2 |
|
|
70.2 |
|
|
107.2 |
|
|
121.1 |
Amounts recognized in accumulated other comprehensive income consist of the following:
|
|
|
U.S. Pension Benefits |
|
International Pension Benefits |
|
||||||||
|
(In millions) |
|
December 31, 2018 |
|
December 31, 2017 |
|
December 31, 2018 |
|
December 31, 2017 |
|
||||
|
Net actuarial (gain) loss |
|
$ |
5.0 |
|
$ |
11.4 |
|
$ |
1.6 |
|
$ |
(2.8) |
|
|
Prior service credit |
|
|
— |
|
|
— |
|
|
0.8 |
|
|
— |
|
Amounts in accumulated other comprehensive income expected to be recognized in components of net periodic pension cost during the calendar year 2019 are as follows:
|
|
|
U.S. Pension |
|
|
(In millions) |
|
Benefits |
|
|
Net actuarial loss |
|
$ |
1.6 |
|
|
|
International |
|
|
|
|
Pension |
|
|
(In millions) |
|
Benefits |
|
|
Net actuarial loss |
|
$ |
0.2 |
Actuarial Assumptions
The weighted-average assumptions used to determine benefit obligations are as follows:
|
|
|
U.S. Pension Benefits |
|
International Pension Benefits |
|
||||
|
|
|
December 31, 2018 |
|
December 31, 2017 |
|
December 31, 2018 |
|
December 31, 2017 |
|
|
Discount rate |
|
4.12% |
|
3.42% |
|
2.86% |
|
2.58% |
|
|
Rate of compensation increase |
|
N/A |
|
N/A |
|
2.19% |
|
2.14% |
|
The weighted-average assumptions used to determine net periodic benefit cost are as follows:
|
|
|
U.S. Pension Benefits |
|
International Pension Benefits |
|
||||||||
|
|
|
Year Ended |
|
Year Ended |
|
||||||||
|
|
|
December 31, 2018 |
|
December 31, 2017 |
|
December 31, 2016 |
|
December 31, 2018 |
|
December 31, 2017 |
|
December 31, 2016 |
|
|
Discount rate |
|
3.42% |
|
3.92% |
|
4.10% |
|
2.58% |
|
2.70% |
|
2.90% |
|
|
Weighted average expected long-term return on plan assets |
|
7.00% |
|
7.00% |
|
7.06% |
|
2.86% |
|
2.85% |
|
3.09% |
|
|
Rate of compensation increase |
|
N/A |
|
N/A |
|
N/A |
|
2.19% |
|
2.14% |
|
3.20% |
|
131
In developing the expected long-term rate of return on plan assets at each measurement date, the Company considers the plan assets’ historical returns, asset allocations, and the anticipated future economic environment and long-term performance of the asset classes. While appropriate consideration is given to recent and historical investment performance, the assumption represents management’s best estimate of the long-term prospective return.
The Company expects to contribute $4.1 million and $0.0 million to the U.S. and International pension plans, respectively during the calendar year 2019.
The following table provides the benefits expected to be paid (inclusive of benefits attributable to estimated future employee service) in each of the next five years, and in the aggregate for the five years thereafter:
|
(In millions) |
|
U.S. Pension Benefits |
|
International Pension Benefits |
||
|
2019 |
|
$ |
4.0 |
|
$ |
2.7 |
|
2020 |
|
|
3.8 |
|
|
2.7 |
|
2021 |
|
|
4.3 |
|
|
2.8 |
|
2022 |
|
|
5.2 |
|
|
2.8 |
|
2023 |
|
|
4.7 |
|
|
2.9 |
|
Years 2024 - 2028 |
|
|
28.3 |
|
|
15.6 |
Pension Plan Assets
The Company’s investment objectives for its U.S. defined benefit pension plan investments are: (1) to preserve the value of its principal; (2) to maximize a real long-term return with respect to the plan assets consistent with minimizing risk; (3) to achieve and maintain adequate asset coverage for accrued benefits under the plan; and (4) to maintain sufficient liquidity for payment of the plan obligations and expenses. The Company uses a diversified allocation of equity, debt, commodity and real estate exposures that are customized to the plan’s cash flow benefit needs. The target allocations for U.S. plan assets are as follows:
|
|
|
|
|
|
|
U.S. Target |
|
Asset Category |
|
Allocation |
|
Fixed(1) |
|
15% |
|
Equity Securities—U.S. |
|
30% |
|
Equity Securities—International |
|
15% |
|
Collective trust fund |
|
25% |
|
Private Real Estate |
|
15% |
|
|
|
100% |
|
(1) |
Includes U.S. Treasury Securities and Bond market fund. |
The international pension benefit plans do not have an established asset target allocation for 2017.
Valuation Techniques. The fair values classified within Level 1 of the valuation hierarchy were determined using quoted market prices from actively traded markets. The fair values classified within Level 2 of the valuation hierarchy included pooled separate accounts and collective trust funds, which valuations were based on market prices for the underlying instruments that were observable in the market or could be derived by observable market data from independent external valuation information.
132
The fair value of the U.S. pension plan assets at December 31, 2018, by asset class is as follows:
|
|
|
|
|
|
Fair Value Measurements at December 31, 2018 Using |
|||||||
|
|
|
Total Carrying |
|
Quoted prices in |
|
Significant other |
|
Significant |
||||
|
|
|
Value at |
|
active market |
|
observable inputs |
|
unobservable inputs |
||||
|
(In millions) |
|
December 31, 2018 |
|
(Level 1) |
|
(Level 2) |
|
(Level 3) |
||||
|
Cash and cash equivalents |
|
$ |
0.4 |
|
$ |
0.4 |
|
$ |
— |
|
$ |
— |
|
Equity securities: |
|
|
|
|
|
|
|
|
|
|
|
|
|
U.S. companies |
|
|
1.3 |
|
|
1.3 |
|
|
— |
|
|
— |
|
International companies |
|
|
1.0 |
|
|
1.0 |
|
|
— |
|
|
— |
|
Bond market fund |
|
|
1.4 |
|
|
1.4 |
|
|
— |
|
|
— |
|
Private real estate |
|
|
9.0 |
|
|
— |
|
|
9.0 |
|
|
— |
|
Investments at net asset value(1) |
|
|
50.1 |
|
|
— |
|
|
— |
|
|
— |
|
Total assets at fair value |
|
$ |
63.2 |
|
$ |
4.1 |
|
$ |
9.0 |
|
$ |
— |
|
(1) |
Certain investments that are measured at fair value using the net asset value per share (or its equivalent) practical expedient have not been categorized in the fair value hierarchy. |
The fair value of the International Pension Benefits assets at December 31, 2018, by asset class is as follows:
|
|
|
|
|
|
Fair Value Measurements at December 31, 2018 Using |
|||||||
|
|
|
Total Carrying |
|
Quoted prices in |
|
Significant other |
|
Significant |
||||
|
|
|
Value at |
|
active market |
|
observable inputs |
|
unobservable inputs |
||||
|
(In millions) |
|
December 31, 2018 |
|
(Level 1) |
|
(Level 2) |
|
(Level 3) |
||||
|
Cash and cash equivalents |
|
$ |
0.9 |
|
$ |
0.9 |
|
$ |
— |
|
$ |
— |
|
Bond market fund |
|
|
80.0 |
|
|
— |
|
|
80.0 |
|
|
— |
|
Private real estate |
|
|
0.1 |
|
|
— |
|
|
0.1 |
|
|
— |
|
Investments at net asset value(1) |
|
|
26.2 |
|
|
— |
|
|
— |
|
|
— |
|
Total assets at fair value |
|
$ |
107.2 |
|
$ |
0.9 |
|
$ |
80.1 |
|
$ |
— |
|
(1) |
Certain investments that are measured at fair value using the net asset value per share (or its equivalent) practical expedient have not been categorized in the fair value hierarchy. |
The fair value of the U.S. pension plan assets at December 31, 2017, by asset class is as follows:
|
|
|
|
|
|
Fair Value Measurements at December 31, 2017 Using |
|||||||
|
|
|
Total Carrying |
|
Quoted prices in |
|
Significant other |
|
Significant |
||||
|
|
|
Value at |
|
active market |
|
observable inputs |
|
unobservable inputs |
||||
|
(In millions) |
|
December 31, 2017 |
|
(Level 1) |
|
(Level 2) |
|
(Level 3) |
||||
|
Cash and cash equivalents |
|
$ |
0.1 |
|
$ |
0.1 |
|
$ |
— |
|
$ |
— |
|
Equity securities: |
|
|
|
|
|
|
|
|
|
|
|
|
|
U.S. companies |
|
|
1.8 |
|
|
1.8 |
|
|
— |
|
|
— |
|
International companies |
|
|
1.3 |
|
|
1.3 |
|
|
— |
|
|
— |
|
Bond market fund |
|
|
1.4 |
|
|
1.4 |
|
|
— |
|
|
— |
|
Private real estate |
|
|
9.7 |
|
|
— |
|
|
9.7 |
|
|
— |
|
Investments at net asset value(1) |
|
|
55.9 |
|
|
— |
|
|
— |
|
|
— |
|
Total assets at fair value |
|
$ |
70.2 |
|
$ |
4.6 |
|
$ |
9.7 |
|
$ |
— |
|
(1) |
Certain investments that are measured at fair value using the net asset value per share (or its equivalent) practical expedient have not been categorized in the fair value hierarchy. |
133
The fair value of the International Pension Benefits assets at December 31, 2017, by asset class is as follows:
|
|
|
|
|
|
Fair Value Measurements at December 31, 2017 Using |
|||||||
|
|
|
Total Carrying |
|
Quoted prices in |
|
Significant other |
|
Significant |
||||
|
|
|
Value at |
|
active market |
|
observable inputs |
|
unobservable inputs |
||||
|
(In millions) |
|
December 31, 2017 |
|
(Level 1) |
|
(Level 2) |
|
(Level 3) |
||||
|
Cash and cash equivalents |
|
$ |
0.5 |
|
$ |
0.5 |
|
$ |
— |
|
$ |
— |
|
Bond market fund |
|
|
83.4 |
|
|
— |
|
|
83.4 |
|
|
— |
|
Private real estate |
|
|
6.4 |
|
|
— |
|
|
6.4 |
|
|
— |
|
Investments at net asset value(1) |
|
|
30.8 |
|
|
— |
|
|
— |
|
|
— |
|
Total assets at fair value |
|
$ |
121.1 |
|
$ |
0.5 |
|
$ |
89.8 |
|
$ |
— |
|
(1) |
Certain investments that are measured at fair value using the net asset value per share (or its equivalent) practical expedient have not been categorized in the fair value hierarchy. |
Defined Contribution Plan
The Company sponsors a voluntary 401(k) savings plan covering certain U.S. employees age 21 or older and who are not covered by a collective bargaining agreement. Under the Company’s 401(k) Savings Plan, the Company matches 100% of each eligible employee’s elective contributions up to 3% and 50% of contributions up to 5% of the employee’s eligible compensation. The Company’s expense under the 401(k) savings plan was $5.3 million, $4.4 million, and $3.5 million for the years ended December 31, 2018, December 31, 2017 and December 31, 2016, respectively.
NOTE 13 – COMMITMENTS AND CONTINGENCIES
The Company, in the normal course of business, is a party to various ordinary course claims from vendors (including food and beverage suppliers and film distributors), landlords, competitors, and other legal proceedings. If management believes that a loss arising from these actions is probable and can reasonably be estimated, the Company records the amount of the loss, or the minimum estimated liability when the loss is estimated using a range and no point is more probable than another. As additional information becomes available, any potential liability related to these actions is assessed and the estimates are revised, if necessary. Management believes that the ultimate outcome of such matters, individually and in the aggregate, will not have a material adverse effect on the Company’s financial position or overall trends in results of operations. However, litigation and claims are subject to inherent uncertainties and unfavorable outcomes can occur. An unfavorable outcome might include monetary damages. If an unfavorable outcome were to occur, there exists the possibility of a material adverse impact on the results of operations in the period in which the outcome occurs or in future periods.
On January 12, 2018 and January 19, 2018, two putative federal securities class actions, captioned Hawaii Structural Iron workers Pension Trust Fund v. AMC Entertainment Holdings, Inc., et al., Case No. 1:18-cv-00299-AJN (the “Hawaii Action”), and Nichols v. AMC Entertainment Holdings, Inc., et al., Case No. 1:18-cv-00510-AJN (the “Nichols Action,” and together with the Hawaii Action, the “Actions”), respectively, were filed against the Company in the U.S. District Court for the Southern District of New York. The Actions, which name certain of the Company’s officers and directors and, in the case of the Hawaii Action, the underwriters of the Company’s February 8, 2017 secondary public offering, as defendants, asserted claims under some or all of Sections 11, 12(a)(2) and 15 of the Securities Act of 1933 and Sections 10(b) and 20(a) of the Securities Exchange Act of 1934 with respect to alleged material misstatements and omissions in the registration statement for the secondary public offering and in certain other public disclosures. On May 30, 2018, the court consolidated the Actions and appointed the International Union of Operating Engineers Pension Fund of Eastern Pennsylvania and Delaware as lead plaintiff. On August 13, 2018, lead plaintiff and additional named plaintiff Hawaii Structural Iron Workers Pension Trust Fund (“Plaintiffs”) filed an Amended Class Action Complaint. On November 21, 2018, Plaintiffs filed a Second Amended Class Action Complaint.
On May 21, 2018, a stockholder derivative complaint, captioned Gantulga v. Aron, et al., Case No. 2:18-cv-02262-JAR-TJJ (the “Gantulga Action”), was filed against certain of the Company’s officers and directors in the U.S. District Court for the District of Kansas. The Gantulga Action, which was filed on behalf of the Company, asserts claims under Section 14(a) of the Securities Exchange Act of 1934 and for breaches of fiduciary duty and unjust enrichment based on allegations substantially similar to the Actions. On August 27, 2018, defendants and the Company as nominal
134
defendant filed a motion to dismiss or, in the alternative, to transfer the action to the U.S. District Court for the Southern District of New York. On September 17, 2018, plaintiff filed an amended complaint. On October 12, 2018, the parties filed a joint motion to transfer the action to the U.S. District Court for the Southern District of New York, which the court granted on October 15, 2018. When the action was transferred to the Southern District of New York, it was re-captioned Gantulga v. Aron, et al., Case No. 1:18-cv-10007-AJN. The parties filed a joint stipulation to stay the action, which the court granted on December 17, 2018.
The Company remains contingently liable for lease payments under certain leases of theatres that it previously divested, in the event that such assignees are unable to fulfill their future lease payment obligations. Due to the variety of remedies available, the Company believes that if the current tenant defaulted on the leases it would not have a material effect on the Company’s financial condition, results of operations or cash flows.
NOTE 14 – THEATRE AND OTHER CLOSURE AND DISPOSITION OF ASSETS
The Company has provided reserves for estimated losses from theatres and screens which have been permanently closed and vacant space with no right to future use. As of December 31, 2018, the Company reserved $18.1 million for lease terminations which have either not been consummated or paid, related primarily to nine theatres and certain vacant restaurant space. The Company is obligated under long-term lease commitments with remaining terms of up to 10 years for theatres which have been closed. As of December 31, 2018, base rents aggregated approximately $5.9 million annually and $18.8 million over the remaining terms of the leases.
A rollforward of reserves for theatre and other closure is as follows:
|
|
|
Year Ended |
|
Year Ended |
|
Year Ended |
|||
|
(In millions) |
|
December 31, 2018 |
|
December 31, 2017 |
|
December 31, 2016 |
|||
|
Beginning balance, December 31, 2018, December 31, 2017 and December 31, 2016, respectively |
|
$ |
27.5 |
|
$ |
34.6 |
|
$ |
43.0 |
|
Theatre and other closure expense |
|
|
2.7 |
|
|
3.0 |
|
|
5.2 |
|
Transfer of assets and liabilities |
|
|
1.0 |
|
|
1.2 |
|
|
— |
|
Foreign currency translation adjustment |
|
|
(0.5) |
|
|
1.0 |
|
|
(1.4) |
|
Cash payments |
|
|
(12.6) |
|
|
(12.3) |
|
|
(12.2) |
|
Ending balance |
|
$ |
18.1 |
|
$ |
27.5 |
|
$ |
34.6 |
The Company recognized theatre and other closure expense of $2.7 million, $3.0 million, and $5.2 million, during the years ended December 31, 2018, December 31, 2017, and December 31, 2016, respectively. Theatre and other closure expense included the accretion on previously closed properties with remaining lease obligations.
In the accompanying Consolidated Balance Sheets, the current portion of the theatre and other closure ending balance of $5.6 million was included with accrued expenses and other liabilities and the long-term portion of the theatre and other closure ending balance of $12.5 million was included with other long-term liabilities. See Note 7 – Supplemental Balance Sheet Information for further information.
Theatre and other closure reserves for leases that have not been terminated were recorded at the present value of the future contractual commitments for the base rents, taxes and maintenance. As of December 31, 2018, the future lease obligations are discounted at annual rates ranging from 6.0% to 9.0%.
135
NOTE 15 – FAIR VALUE MEASUREMENTS
Fair value refers to the price that would be received to sell an asset or paid to transfer a liability in an orderly transaction between market participants in the market in which the entity transacts business. The inputs used to develop these fair value measurements are established in a hierarchy, which ranks the quality and reliability of the information used to determine the fair values. The fair value classification is based on levels of inputs. Assets and liabilities that are carried at fair value are classified and disclosed in one of the following categories:
|
Level 1: |
Quoted market prices in active markets for identical assets or liabilities. |
|
Level 2: |
Observable inputs that are corroborated by market data. |
|
Level 3: |
Unobservable inputs that are not corroborated by market data. |
Recurring Fair Value Measurements. The following table summarizes the fair value hierarchy of the Company’s financial assets carried at fair value on a recurring basis:
|
|
|
|
|
|
Fair Value Measurements at December 31, 2018 Using |
|||||||
|
|
|
|
|
|
|
|
|
|
|
|
Significant |
|
|
|
|
Total Carrying |
|
Quoted prices in |
|
Significant other |
|
unobservable |
||||
|
|
|
Value at |
|
active market |
|
observable inputs |
|
inputs |
||||
|
(In millions) |
|
December 31, 2018 |
|
(Level 1) |
|
(Level 2) |
|
(Level 3) |
||||
|
Other long-term assets: |
|
|
|
|
|
|
|
|
|
|
|
|
|
Money market mutual funds |
|
$ |
0.5 |
|
$ |
0.5 |
|
$ |
— |
|
$ |
— |
|
Equity securities, available-for-sale: |
|
|
|
|
|
|
|
|
|
|
|
|
|
Derivative asset |
|
|
55.7 |
|
|
— |
|
|
— |
|
|
55.7 |
|
Investments measured at net asset value (1) |
|
|
9.6 |
|
|
— |
|
|
— |
|
|
— |
|
Total assets at fair value |
|
$ |
65.8 |
|
$ |
0.5 |
|
$ |
— |
|
$ |
55.7 |
|
|
|
|
|
|
|
|
|
|
|
|
|
|
|
Other long-term liabilities: |
|
|
|
|
|
|
|
|
|
|
|
|
|
Derivative liability |
|
$ |
24.0 |
|
$ |
— |
|
$ |
— |
|
$ |
24.0 |
|
Total liabilities at fair value |
|
$ |
24.0 |
|
$ |
— |
|
$ |
— |
|
$ |
24.0 |
|
|
|
|
|
|
Fair Value Measurements at December 31, 2017 Using |
|||||||
|
|
|
|
|
|
|
|
|
|
|
|
Significant |
|
|
|
|
Total Carrying |
|
Quoted prices in |
|
Significant other |
|
unobservable |
||||
|
|
|
Value at |
|
active market |
|
observable inputs |
|
inputs |
||||
|
(In millions) |
|
December 31, 2017 (1) |
|
(Level 1) |
|
(Level 2) |
|
(Level 3) |
||||
|
Other long-term assets: |
|
|
|
|
|
|
|
|
|
|
|
|
|
Money market mutual funds |
|
$ |
0.6 |
|
$ |
0.6 |
|
$ |
— |
|
$ |
— |
|
Equity securities, available-for-sale: |
|
|
|
|
|
|
|
|
|
|
|
|
|
Investments measured at net asset value(1) |
|
|
9.8 |
|
|
— |
|
|
— |
|
|
— |
|
Total assets at fair value |
|
$ |
10.4 |
|
$ |
0.6 |
|
$ |
— |
|
$ |
— |
|
(1) |
The investments relate to a non-qualified deferred compensation arrangement on behalf of certain management. The Company has an equivalent liability for this related-party transaction recorded in other long-term liabilities for the deferred compensation obligation. These investments are measured at fair value using the net asset value per share (or its equivalent) practical expedient have not been categorized in the fair value hierarchy. |
Valuation Techniques. The Company’s money market mutual funds are invested in funds that seek to preserve principal, are highly liquid, and therefore are recorded on the balance sheet at the principal amounts deposited, which equals fair value. The equity securities, available-for-sale, primarily consist of common stock and mutual funds invested in equity, fixed income, and international funds and are measured at fair value using quoted market prices. See Note 17 – Accumulated Other Comprehensive Income for the unrealized gain on equity securities recorded in accumulated other comprehensive income.
On September 14, 2018, the Company issued Convertible Notes due 2024 with a conversion feature that gave rise to an embedded derivative instrument and a stock purchase and cancellation agreement that gave rise to a derivative asset (See Note 8 – Corporate Borrowings). The derivative features have been valued using a Monte Carlo simulation
136
approach. The Monte Carlo simulation approach consists of simulated common stock prices from the valuation date to the maturity of the Convertible Notes and to September 14, 2020 for the contingent call option for forfeiture shares. Increases or decreases in the Company’s share price, the volatility of the share price, the passage of time, risk-free interest rate, discount yield, and dividend yield will all impact the value of the derivative instruments. The Company re-values the derivative instruments at the end of each reporting period and any changes are recorded in other expense (income) in the consolidated statements of operations.
The following table summarizes the fair value hierarchy of the Company’s assets that were measured at fair value on a nonrecurring basis:
|
|
|
|
|
|
Fair Value Measurements at December 31, 2018 Using |
|
|
|
|||||||
|
|
|
|
|
|
|
Significant other |
|
Significant |
|
|
|
||||
|
|
|
Total Carrying |
|
Quoted prices in |
|
observable |
|
unobservable |
|
|
|
||||
|
|
|
Value at |
|
active market |
|
inputs |
|
inputs |
|
Total |
|||||
|
(In millions) |
|
December 31, 2018 |
|
(Level 1) |
|
(Level 2) |
|
(Level 3) |
|
Losses |
|||||
|
Property, net: |
|
|
|
|
|
|
|
|
|
|
|
|
|
|
|
|
Property owned, net |
|
$ |
17.3 |
|
$ |
— |
|
$ |
— |
|
$ |
17.3 |
|
$ |
13.8 |
|
|
|
|
|
|
Fair Value Measurements at December 31, 2017 Using |
|
|
|
|||||||
|
|
|
|
|
|
|
Significant other |
|
Significant |
|
|
|
||||
|
|
|
Total Carrying |
|
Quoted prices in |
|
observable |
|
unobservable |
|
|
|
||||
|
|
|
Value at |
|
active market |
|
inputs |
|
inputs |
|
Total |
|||||
|
(In millions) |
|
December 31, 2017 |
|
(Level 1) |
|
(Level 2) |
|
(Level 3) |
|
Losses |
|||||
|
Property, net: |
|
|
|
|
|
|
|
|
|
|
|
|
|
|
|
|
Property owned, net |
|
$ |
7.7 |
|
$ |
— |
|
$ |
— |
|
$ |
7.7 |
|
$ |
43.6 |
Long-lived assets held and used and a favorable lease were considered impaired and were written down to their fair value at December 31, 2018 and December 31, 2017 of $17.3 million and $7.7 million, respectively.
Other Fair Value Measurement Disclosures. The following table summarizes the fair value of financial instruments that are not recognized at fair value in the statement of financial position for which it is practicable to estimate that value:
|
|
|
|
|
|
Fair Value Measurements at December 31, 2018 Using |
|||||||
|
|
|
|
|
|
|
Significant other |
|
Significant |
||||
|
|
|
Total Carrying |
|
Quoted prices in |
|
observable |
|
unobservable |
||||
|
|
|
Value at |
|
active market |
|
inputs |
|
inputs |
||||
|
(In millions) |
|
December 31, 2018 |
|
(Level 1) |
|
(Level 2) |
|
(Level 3) |
||||
|
Current maturities of corporate borrowings |
|
$ |
15.2 |
|
$ |
— |
|
$ |
13.4 |
|
$ |
1.4 |
|
Corporate borrowings |
|
|
4,707.8 |
|
|
— |
|
|
3,909.2 |
|
|
475.2 |
|
|
|
|
|
|
Fair Value Measurements at December 31, 2017 Using |
|||||||
|
|
|
|
|
|
|
|
Significant other |
|
Significant |
|||
|
|
|
Total Carrying |
|
Quoted prices in |
|
observable |
|
unobservable |
||||
|
|
|
Value at |
|
active market |
|
inputs |
|
inputs |
||||
|
(In millions) |
|
December 31, 2017 |
|
(Level 1) |
|
(Level 2) |
|
(Level 3) |
||||
|
Current maturities of corporate borrowings |
|
$ |
15.2 |
|
$ |
— |
|
$ |
14.0 |
|
$ |
1.4 |
|
Corporate borrowings |
|
|
4,220.1 |
|
|
— |
|
|
4,304.9 |
|
|
1.4 |
Valuation Technique. Quoted market prices and observable market based inputs were used to estimate fair value for level 2 inputs. The level 3 fair value measurement represents the transaction price of the corporate borrowings under market conditions. On September 14, 2018, the Company issued $600.0 million of Convertible Notes due 2024. These notes were issued by private placement, as such there is no observable market for these Convertible Notes. The Company valued these notes at principal value less a discount reflecting a market yield to maturity. See Note 8 – Corporate Borrowings for further information.
The carrying amounts of cash and cash equivalents, accounts receivable, accounts payable, and accrued liabilities approximate fair value because of the short maturity of these instruments.
137
NOTE 16 – OPERATING SEGMENTS
The Company reports information about operating segments in accordance with ASC 280-10, Segment Reporting, which requires financial information to be reported based on the way management organizes segments within a company for making operating decisions and evaluating performance. Beginning with the Company’s acquisition of Odeon in 2016, the Company has identified two reportable segments for its theatrical exhibition operations, U.S. markets and International markets. The International markets reportable segments consist of two operating segments (Odeon Theatres and Nordic Theatres) with operations in or partial interest in theatres in the United Kingdom, Germany, Spain, Italy, Ireland, Austria, Portugal, Sweden, Finland, Estonia, Latvia, Lithuania, Norway, and Denmark. Each segment’s revenue is derived from admissions, food and beverage sales and other ancillary revenues, primarily screen advertising, AMC Stubs® membership fees, ticket sales, gift card income and exchange ticket income. The two international operating segments, Odeon Theatres and Nordic Theatres, are combined into one reportable segment (International markets) because they have similar economic characteristics and meet the aggregation criteria described in the accounting guidance for segment reporting. The measure of segment profit and loss the Company uses to evaluate performance and allocate its resources is Adjusted EBITDA, as defined in the reconciliation table below. The Company does not report asset information by segment because that information is not used to evaluate the performance of or allocate resources between segments.
Below is a breakdown of select financial information by reportable operating segment:
|
|
|
Year Ended |
|||||||
|
Revenues (In millions) |
|
December 31, 2018 |
|
December 31, 2017 |
|
December 31, 2016 |
|||
|
U.S. markets |
|
$ |
4,013.2 |
|
$ |
3,723.5 |
|
$ |
3,117.0 |
|
International markets |
|
|
1,447.6 |
|
|
1,355.7 |
|
|
118.9 |
|
Total revenues |
|
$ |
5,460.8 |
|
$ |
5,079.2 |
|
$ |
3,235.9 |
|
|
|
Year Ended |
|||||||
|
Adjusted EBITDA (1) (In millions) |
|
December 31, 2018 |
|
December 31, 2017 |
|
December 31, 2016 |
|||
|
U.S. markets (2) |
|
$ |
700.5 |
|
$ |
610.0 |
|
$ |
573.6 |
|
International markets |
|
|
228.7 |
|
|
212.5 |
|
|
28.4 |
|
Total Adjusted EBITDA |
|
$ |
929.2 |
|
$ |
822.5 |
|
$ |
602.0 |
|
|
|
Year Ended |
|||||||
|
Capital Expenditures (In millions) |
|
December 31, 2018 |
|
December 31, 2017 |
|
December 31, 2016 |
|||
|
U.S. markets |
|
$ |
395.6 |
|
$ |
543.7 |
|
$ |
412.7 |
|
International markets |
|
|
180.7 |
|
|
83.1 |
|
|
9.0 |
|
Total capital expenditures |
|
$ |
576.3 |
|
$ |
626.8 |
|
$ |
421.7 |
|
(1) |
The Company presents Adjusted EBITDA as a supplemental measure of its performance. The Company defines Adjusted EBITDA as net earnings (loss) plus (i) income tax provision, (ii) interest expense and (iii) depreciation and amortization, as further adjusted to eliminate the impact of certain items that the Company does not consider indicative of the Company’s ongoing operating performance and to include attributable EBITDA from equity investments in theatre operations in international markets and any cash distributions of earnings from its other equity method investees. The measure of segment profit and loss the Company uses to evaluate performance and allocate its resources is Adjusted EBITDA, which is consistent with how Adjusted EBITDA is defined in the Company’s debt indentures. |
|
(2) |
Distributions from NCM are reported entirely within the U.S. markets segment. |
138
Financial Information About Geographic Area:
|
|
|
Year Ended |
|||||||
|
Revenues (In millions) |
|
December 31, 2018 |
|
December 31, 2017 |
|
December 31, 2016 |
|||
|
United States |
|
$ |
4,013.2 |
|
$ |
3,723.5 |
|
$ |
3,117.0 |
|
United Kingdom |
|
|
513.5 |
|
|
509.8 |
|
|
56.9 |
|
Spain |
|
|
193.9 |
|
|
187.1 |
|
|
20.0 |
|
Sweden |
|
|
192.1 |
|
|
154.2 |
|
|
— |
|
Italy |
|
|
178.5 |
|
|
185.5 |
|
|
21.0 |
|
Germany |
|
|
114.3 |
|
|
129.7 |
|
|
14.1 |
|
Finland |
|
|
101.7 |
|
|
77.3 |
|
|
— |
|
Ireland |
|
|
40.7 |
|
|
38.5 |
|
|
3.2 |
|
Other foreign countries |
|
|
112.9 |
|
|
73.6 |
|
|
3.7 |
|
Total |
|
$ |
5,460.8 |
|
$ |
5,079.2 |
|
$ |
3,235.9 |
|
|
|
As of |
|
As of |
||
|
Long-term assets, net (In millions) |
|
December 31, 2018 |
|
December 31, 2017 |
||
|
United States |
|
$ |
5,826.5 |
|
$ |
5,866.8 |
|
International |
|
|
2,888.0 |
|
|
3,066.7 |
|
Total long-term assets (1) |
|
$ |
8,714.5 |
|
$ |
8,933.5 |
|
(1) |
Long-term assets are comprised of property, intangible assets, goodwill, deferred income tax assets and other long-term assets. |
The following table sets forth a reconciliation of net earnings (loss) to Adjusted EBITDA:
|
|
|
Year Ended |
|||||||
|
(In millions) |
|
December 31, 2018 |
|
December 31, 2017 |
|
December 31, 2016 |
|||
|
Net earnings (loss) |
|
$ |
110.1 |
|
$ |
(487.2) |
|
$ |
111.7 |
|
Plus: |
|
|
|
|
|
|
|
|
|
|
Income tax provision (benefit) |
|
|
13.6 |
|
|
154.1 |
|
|
38.0 |
|
Interest expense |
|
|
342.3 |
|
|
274.0 |
|
|
121.5 |
|
Depreciation and amortization |
|
|
537.8 |
|
|
538.6 |
|
|
268.2 |
|
Impairment of long-lived assets |
|
|
13.8 |
|
|
43.6 |
|
|
5.5 |
|
Certain operating expenses (1) |
|
|
24.0 |
|
|
20.6 |
|
|
20.2 |
|
Equity in (earnings) loss of non-consolidated entities (2) |
|
|
(86.7) |
|
|
185.2 |
|
|
(47.7) |
|
Cash distributions from non-consolidated entities (3) |
|
|
35.2 |
|
|
45.4 |
|
|
40.1 |
|
Attributable EBITDA (4) |
|
|
7.3 |
|
|
3.4 |
|
|
— |
|
Investment income |
|
|
(6.2) |
|
|
(22.6) |
|
|
(10.2) |
|
Other expense (income) (5) |
|
|
(108.2) |
|
|
(1.3) |
|
|
— |
|
General and administrative — unallocated: |
|
|
|
|
|
|
|
|
|
|
Merger, acquisition and transaction costs (6) |
|
|
31.3 |
|
|
63.0 |
|
|
47.9 |
|
Stock-based compensation expense (7) |
|
|
14.9 |
|
|
5.7 |
|
|
6.8 |
|
Adjusted EBITDA |
|
$ |
929.2 |
|
$ |
822.5 |
|
$ |
602.0 |
|
(1) |
Amounts represent preopening expense related to temporarily closed screens under renovation, theatre and other closure expense for the permanent closure of screens including the related accretion of interest, non-cash deferred digital equipment rent expense, and disposition of assets and other non-operating gains or losses included in operating expenses. The Company has excluded these items as they are non-cash in nature, include components of interest cost for the time value of money or are non-operating in nature. |
|
(2) |
During the year ended December 31, 2018, the Company recorded equity in earnings related to AMC’s sale of all remaining NCM units of $28.9 million and a gain of $30.1 million related to the Screenvision merger. Equity in earnings of non-consolidated entities also includes loss on the surrender (disposition) of a portion of AMC’s investment in NCM of $1.1 million during the year ended December 31, 2018. Equity in (earnings) loss of non- |
139
consolidated entities includes a lower of carrying value or fair value impairment loss of the held-for sale portion of our investment in NCM of $16.0 million for the year ended December 31, 2018. Equity in (earnings) loss of non-consolidated entities includes an other-than-temporary impairment charge of $208.0 million to reduce the carrying value of the Company’s investment in NCM to Level 1 fair value during the year ended December 31, 2017. An other-than-temporary impairment charge of $204.5 million was recorded on the Company’s units and shares at the publicly quoted per share price on June 30, 2017, of $7.42 and an other-than-temporary impairment charge of $3.5 million was recorded on the Company’s units and shares at the publicly quoted per share price on December 31, 2017 of $6.86, based on the Company’s determination that the decline in the price per share during the respective quarters was other than temporary. Equity in (earnings) loss of non-consolidated entities includes loss on the sale of a portion of the Company’s investment in NCM of $22.2 million during the year ended December 31, 2017. |
|
(3) |
Includes U.S. non-theatre distributions from equity method investments and International non-theatre distributions from equity method investments to the extent received. The Company believes including cash distributions is an appropriate reflection of the contribution of these investments to the Company’s operations. |
|
(4) |
Attributable EBITDA includes the EBITDA from minority equity investments in theatre operators in certain international markets. See below for a reconciliation of the Company’s equity earnings of non-consolidated entities to attributable EBITDA. Because these equity investments are in theatre operators in regions where the Company holds a significant market share, the Company believes attributable EBITDA is more indicative of the performance of these equity investments and management uses this measure to monitor and evaluate these equity investments. The Company also provides services to these theatre operators including information technology systems, certain on-screen advertising services and our gift card and package ticket program. As these investments relate only to the Company’s Nordic acquisition, the second quarter of 2017 represents the first time the Company has made this adjustment and does not impact prior historical presentations of Adjusted EBITDA. |
|
|
|
Year Ended |
|||||||
|
(In millions) |
|
December 31, 2018 |
|
December 31, 2017 |
|
December 31, 2016 |
|||
|
Equity in (earnings) loss of non-consolidated entities |
|
$ |
(86.7) |
|
$ |
185.2 |
|
$ |
(47.7) |
|
Less: |
|
|
|
|
|
|
|
|
|
|
Equity in (earnings) loss of non-consolidated entities excluding international theatre JV's |
|
|
(81.9) |
|
|
187.0 |
|
|
(47.7) |
|
Equity in earnings (loss) of International theatre JV's |
|
|
4.8 |
|
|
1.8 |
|
|
— |
|
Income tax provision |
|
|
0.4 |
|
|
— |
|
|
— |
|
Investment income |
|
|
(0.5) |
|
|
— |
|
|
— |
|
Depreciation and amortization |
|
|
2.6 |
|
|
1.6 |
|
|
— |
|
Attributable EBITDA |
|
$ |
7.3 |
|
$ |
3.4 |
|
$ |
— |
|
(5) |
Other expense (income) for the year ended December 31, 2018 includes financing losses and financing related foreign currency transaction losses. During the year ended December 31, 2018, the Company recorded a gain of $111.4 million as a result of a decrease in fair value of our derivative liability and an increase in fair value of our derivative asset for the Convertible Notes due 2024. Other income for the year ended December 31, 2017 includes $3.0 million financing related foreign currency transaction gains, partially offset by $1.3 million in fees relating to third-party fees related to the Third Amendment to the Company’s Senior Secured Credit Agreement, and a $0.4 million loss on the redemption of the Bridge Loan Facility. |
|
(6) |
Merger, acquisition and transition costs are excluded as they are non-operating in nature. |
|
(7) |
Non-cash or non-recurring expense included in general and administrative: other |
140
NOTE 17 – ACCUMULATED OTHER COMPREHENSIVE INCOME
The following tables present the change in accumulated other comprehensive income (loss) by component:
|
|
|
|
|
|
|
|
Unrealized Net |
|
Unrealized Net |
|
|
|
|
|||
|
|
|
|
|
|
Pension and |
|
Gain from |
|
Gain from Equity |
|
|
|
|
|||
|
|
|
Foreign |
|
Other |
|
Marketable |
|
Method Investees’ |
|
|
|
|
||||
|
(In millions) |
|
Currency |
|
Benefits (1) |
|
Securities |
|
Cash Flow Hedge |
|
Total |
|
|||||
|
Balance, December 31, 2017 |
|
$ |
129.9 |
|
$ |
(6.6) |
|
$ |
0.6 |
|
$ |
1.7 |
|
$ |
125.6 |
|
|
Other comprehensive income (loss) before reclassifications |
|
|
(127.7) |
|
|
4.2 |
|
|
— |
|
|
0.2 |
|
|
(123.3) |
|
|
Amounts reclassified from accumulated other comprehensive income |
|
|
1.0 |
|
|
— |
|
|
— |
|
|
(2.2) |
|
|
(1.2) |
|
|
Other comprehensive income (loss) |
|
|
(126.7) |
|
|
4.2 |
|
|
— |
|
|
(2.0) |
|
|
(124.5) |
|
|
Adoption of ASU 2016-01 - reclassification to retained earnings |
|
|
— |
|
|
— |
|
|
(0.6) |
|
|
— |
|
|
(0.6) |
|
|
Adoption of ASU 2018-02 - reclassification to retained earnings |
|
|
4.0 |
|
|
0.6 |
|
|
— |
|
|
0.4 |
|
|
5.0 |
|
|
Balance, December 31, 2018 |
|
$ |
7.2 |
|
$ |
(1.8) |
|
$ |
— |
|
$ |
0.1 |
|
$ |
5.5 |
|
|
|
|
|
|
|
|
|
Unrealized Net |
|
Unrealized Net |
|
|
|
|
|||
|
|
|
|
|
|
Pension and |
|
Gain from |
|
Gain from Equity |
|
|
|
|
|||
|
|
|
Foreign |
|
Other |
|
Marketable |
|
Method Investees’ |
|
|
|
|
||||
|
(In millions) |
|
Currency |
|
Benefits (1) |
|
Securities |
|
Cash Flow Hedge |
|
Total |
|
|||||
|
Balance, December 31, 2016 |
|
$ |
(1.8) |
|
$ |
(3.6) |
|
$ |
0.3 |
|
$ |
2.6 |
|
$ |
(2.5) |
|
|
Other comprehensive income before reclassifications |
|
|
131.7 |
|
|
— |
|
|
0.7 |
|
|
— |
|
|
132.4 |
|
|
Amounts reclassified from accumulated other comprehensive income |
|
|
— |
|
|
(3.0) |
|
|
(0.4) |
|
|
(0.9) |
|
|
(4.3) |
|
|
Other comprehensive income (loss) |
|
|
131.7 |
|
|
(3.0) |
|
|
0.3 |
|
|
(0.9) |
|
|
128.1 |
|
|
Balance, December 31, 2017 |
|
$ |
129.9 |
|
$ |
(6.6) |
|
$ |
0.6 |
|
$ |
1.7 |
|
$ |
125.6 |
|
|
(1) |
See Note 12 – Employee Benefit Plans for further information regarding amounts reclassified from accumulated other comprehensive income. |
141
The tax effects allocated to each component of other comprehensive income (loss) is as follows:
|
|
|
Year Ended |
|||||||||||||||||||||||||
|
|
|
December 31, 2018 |
|
December 31, 2017 |
|
December 31, 2016 |
|||||||||||||||||||||
|
|
|
|
|
Tax |
|
|
|
|
|
Tax |
|
|
|
|
|
Tax |
|
|
|||||||||
|
|
|
Pre-Tax |
|
(Expense) |
|
Net-of-Tax |
|
Pre-Tax |
|
(Expense) |
|
Net-of-Tax |
|
Pre-Tax |
|
(Expense) |
|
Net-of-Tax |
|||||||||
|
(In millions) |
|
Amount |
|
Benefit |
|
Amount |
|
Amount |
|
Benefit |
|
Amount |
|
Amount |
|
Benefit |
|
Amount |
|||||||||
|
Unrealized foreign currency translation adjustment (1) |
|
$ |
(127.5) |
|
$ |
(0.2) |
|
$ |
(127.7) |
|
$ |
142.6 |
|
$ |
(10.9) |
|
$ |
131.7 |
|
$ |
(3.1) |
|
$ |
(0.8) |
|
$ |
(3.9) |
|
Realized loss on foreign currency transactions |
|
|
1.0 |
|
|
— |
|
|
1.0 |
|
|
— |
|
|
— |
|
|
— |
|
|
— |
|
|
— |
|
|
— |
|
Pension and other benefit adjustments: |
|
|
|
|
|
|
|
|
|
|
|
|
|
|
|
|
|
|
|
|
|
|
|
|
|
|
— |
|
Net gain (loss) arising during the period |
|
|
3.8 |
|
|
0.4 |
|
|
4.2 |
|
|
(2.6) |
|
|
(0.4) |
|
|
(3.0) |
|
|
(0.5) |
|
|
0.2 |
|
|
(0.3) |
|
Marketable securities: |
|
|
|
|
|
|
|
|
|
|
|
|
|
|
|
|
|
|
|
|
|
|
|
|
|
|
|
|
Unrealized net holding gain (loss) arising during the period |
|
|
— |
|
|
— |
|
|
— |
|
|
1.2 |
|
|
(0.5) |
|
|
0.7 |
|
|
1.0 |
|
|
(0.4) |
|
|
0.6 |
|
Realized net gain reclassified into investment expense (income) |
|
|
— |
|
|
— |
|
|
— |
|
|
(0.6) |
|
|
0.2 |
|
|
(0.4) |
|
|
(3.0) |
|
|
1.2 |
|
|
(1.8) |
|
Equity method investees' cash flow hedge: |
|
|
|
|
|
|
|
|
|
|
|
|
|
|
|
|
|
|
|
|
|
|
|
|
|
|
|
|
Unrealized net holding gain (loss) arising during the period |
|
|
0.2 |
|
|
— |
|
|
0.2 |
|
|
— |
|
|
— |
|
|
— |
|
|
(0.5) |
|
|
0.2 |
|
|
(0.3) |
|
Realized net (gain) loss reclassified into equity in earnings of non-consolidated entities |
|
|
(2.2) |
|
|
— |
|
|
(2.2) |
|
|
(1.5) |
|
|
0.6 |
|
|
(0.9) |
|
|
0.5 |
|
|
(0.1) |
|
|
0.4 |
|
Other comprehensive income (loss) |
|
$ |
(124.7) |
|
$ |
0.2 |
|
$ |
(124.5) |
|
$ |
139.1 |
|
$ |
(11.0) |
|
$ |
128.1 |
|
$ |
(5.6) |
|
$ |
0.3 |
|
$ |
(5.3) |
|
(1) |
Deferred tax impacts of foreign currency translation for the Odeon and Nordic international operations acquired during 2016 and 2017 have not been recorded due to the Company’s intent to remain permanently invested. |
142
NOTE 18 – EARNINGS (LOSS) PER SHARE
Basic earnings (loss) per share is computed by dividing net earnings (loss) by the weighted-average number of common shares outstanding. Diluted earnings per share includes the effects of unvested RSU’s with a service condition only and unvested contingently issuable RSUs that have service and performance conditions, if dilutive, as well as potential dilutive shares from the conversion feature of the Convertible Notes due 2024, if dilutive.
The following table sets forth the computation of basic and diluted earnings (loss) per common share:
|
|
|
Year Ended |
|
Year Ended |
|
Year Ended |
|||
|
(In millions) |
|
December 31, 2018 |
|
December 31, 2017 |
|
December 31, 2016 |
|||
|
Numerator: |
|
|
|
|
|
|
|||
|
Net earnings (loss) for basic earnings (loss) per share |
|
$ |
110.1 |
|
$ |
(487.2) |
|
$ |
111.7 |
|
Calculation of Net earnings for diluted earnings (loss) per share |
|
|
|
|
|
|
|
|
|
|
Marked-to-market (gain) on derivative liability |
|
|
(66.4) |
|
|
— |
|
|
— |
|
Interest expense for Convertible Notes due 2024 |
|
|
9.7 |
|
|
— |
|
|
— |
|
Net earnings available for diluted earnings |
|
$ |
53.4 |
|
$ |
(487.2) |
|
$ |
111.7 |
|
|
|
|
|
|
|
|
|
|
|
|
Denominator (shares in thousands): |
|
|
|
|
|
|
|
|
|
|
Weighted average shares for basic earnings per common share |
|
|
120,621 |
|
|
128,246 |
|
|
98,838 |
|
Common equivalent shares for RSUs and PSUs |
|
|
29 |
|
|
— |
|
|
34 |
|
Common equivalent shares if converted: convertible notes 2024 |
|
|
9,455 |
|
|
— |
|
|
— |
|
Weighted average shares for diluted earnings per common share |
|
|
130,105 |
|
|
128,246 |
|
|
98,872 |
|
|
|
|
|
|
|
|
|
|
|
|
Basic earnings (loss) per common share: |
|
$ |
0.91 |
|
$ |
(3.80) |
|
$ |
1.13 |
|
Diluted earnings (loss) per common share: |
|
$ |
0.41 |
|
$ |
(3.80) |
|
$ |
1.13 |
Vested RSUs and PSU’s have dividend rights identical to the Company’s Class A and Class B common stock and are treated as outstanding shares for purposes of computing basic and diluted earnings per share. Certain unvested RSUs and unvested PSUs are subject to performance conditions and are included in diluted earnings per share, if dilutive, based on the number of shares, if any, that would be issuable under the terms of the Company’s 2013 Equity Incentive Plan if the end of the reporting period were the end of the contingency period. During the year ended December 31, 2018 unvested PSUs of 364,269 at the minimum performance target were not included in the computation of diluted earnings per share because they would not be issuable if the end of the reporting period were the end of the contingency period and unvested RSU’s of 210,558 were not included in the computation of diluted earnings per share because they would not be issuable if the end of the reporting period were the end of the contingency period or they would be anti-dilutive. During the year ended December 31, 2017 unvested PSUs and Transition PSUs of 187,468 at the minimum performance target and unvested performance based RSU’s of 88,194 were not included in the computation of diluted loss because they would anti-dilutive. During the year ended December 31, 2016, unvested PSUs of 83,477 at the minimum performance target and unvested performance based RSU’s of 90,654 were not included in the computation of diluted earnings per share as vesting conditions were not met at the end of the reporting period.
The Company uses the if-converted method for calculating any potential dilutive effect of the Convertible Notes due 2024 that were issued on September 14, 2018. The Company has adjusted net earnings for the year ended December 31, 2018 to eliminate the interest expense and the gain for the derivative liability related to the Convertible Notes due 2024 of $9.7 million and $66.4 million, respectively in the computation of diluted earnings per share. The Company has included in diluted weighted average shares approximately 9.5 million shares upon conversion for the year ended December 31, 2018, as the effects are dilutive. Based on the current conversion price of $18.95 per share the Convertible Notes due 2024 are convertible into 31,662,269 Class A common shares.
143
NOTE 19 – SUPPLEMENTAL FINANCIAL INFORMATION BY QUARTER (UNAUDITED)
|
|
|
2018 |
|||||||||||||
|
|
|
Quarter |
|
Quarter |
|
Quarter |
|
Quarter |
|
Year |
|||||
|
|
|
Ended |
|
Ended |
|
Ended |
|
Ended |
|
Ended |
|||||
|
|
|
March 31, |
|
June 30, |
|
September 30, |
|
December 31, |
|
December 31, |
|||||
|
(In millions, except per share data) |
|
2018 |
|
2018 |
|
2018 |
|
2018 |
|
2018 |
|||||
|
Total revenues |
|
$ |
1,383.6 |
|
$ |
1,442.5 |
|
$ |
1,221.4 |
|
$ |
1,413.3 |
|
$ |
5,460.8 |
|
Operating income (loss) |
|
|
109.9 |
|
|
89.7 |
|
|
(21.9) |
|
|
87.3 |
|
|
265.0 |
|
Net earnings (loss) (1) |
|
$ |
17.7 |
|
$ |
22.2 |
|
$ |
(100.4) |
|
$ |
170.6 |
|
$ |
110.1 |
|
|
|
|
|
|
|
|
|
|
|
|
|
|
|
|
|
|
Basic earnings (loss) per share: |
|
$ |
0.14 |
|
$ |
0.17 |
|
$ |
(0.82) |
|
$ |
1.65 |
|
$ |
0.91 |
|
|
|
|
|
|
|
|
|
|
|
|
|
|
|
|
|
|
Diluted earnings (loss) per share: |
|
$ |
0.14 |
|
$ |
0.17 |
|
$ |
(0.82) |
|
$ |
0.43 |
|
$ |
0.41 |
|
|
|
|
|
|
|
|
|
|
|
|
|
|
|
|
|
|
Weighted average shares outstanding: (in thousands) |
|
|
|
|
|
|
|
|
|
|
|
|
|
|
|
|
Basic |
|
|
128,046 |
|
|
128,039 |
|
|
123,126 |
|
|
103,514 |
|
|
120,621 |
|
Diluted |
|
|
128,046 |
|
|
128,105 |
|
|
123,126 |
|
|
135,450 |
|
|
130,105 |
|
(1) |
In the fourth quarter of calendar 2018, the Company recorded $165.5 million of other income related to derivative assets and liabilities. See Note 8 – Corporate Borrowings and Capital and Financing Lease Obligations for a discussion of the derivative asset and derivative liability gains. |
|
|
|
2017 |
|||||||||||||
|
|
|
Quarter |
|
Quarter |
|
Quarter |
|
Quarter |
|
Year |
|||||
|
|
|
Ended |
|
Ended |
|
Ended |
|
Ended |
|
Ended |
|||||
|
|
|
March 31, |
|
June 30, |
|
September 30, |
|
December 31, |
|
December 31, |
|||||
|
(In millions, except per share data) |
|
2017 |
|
2017 |
|
2017 |
|
2017 |
|
2017 |
|||||
|
Total revenues |
|
$ |
1,281.4 |
|
$ |
1,202.3 |
|
$ |
1,178.7 |
|
$ |
1,416.8 |
|
$ |
5,079.2 |
|
Operating income (loss) |
|
|
55.3 |
|
|
(19.5) |
|
|
(4.1) |
|
|
70.3 |
|
|
102.0 |
|
Net earnings (1) |
|
$ |
8.4 |
|
$ |
(176.5) |
|
$ |
(42.7) |
|
$ |
(276.4) |
|
$ |
(487.2) |
|
|
|
|
|
|
|
|
|
|
|
|
|
|
|
|
|
|
Basic earnings (loss) per share: |
|
$ |
0.07 |
|
$ |
(1.35) |
|
$ |
(0.33) |
|
$ |
(2.14) |
|
$ |
(3.80) |
|
|
|
|
|
|
|
|
|
|
|
|
|
|
|
|
|
|
Diluted earnings (loss) per share: |
|
$ |
0.07 |
|
$ |
(1.35) |
|
$ |
(0.33) |
|
$ |
(2.14) |
|
$ |
(3.80) |
|
|
|
|
|
|
|
|
|
|
|
|
|
|
|
|
|
|
Weighted average shares outstanding: (in thousands) |
|
|
|
|
|
|
|
|
|
|
|
|
|
|
|
|
Basic |
|
|
121,358 |
|
|
131,166 |
|
|
131,077 |
|
|
129,265 |
|
|
128,246 |
|
Diluted |
|
|
121,401 |
|
|
131,166 |
|
|
131,077 |
|
|
129,265 |
|
|
128,246 |
|
(1) |
In the fourth quarter of calendar 2017, the Company recorded the impact of the change in the U.S. enacted federal income tax rate from 35% to 21% which reduced its deferred tax assets. In the fourth quarter and in connection with the preparation of its 2017 consolidated financial statements, the Company also determined that realization of its deferred tax assets in the U.S. tax jurisdictions was not more likely than not, primarily as a result of cumulative net losses recorded for three years and the Company recorded a full valuation allowance for its deferred tax assets in U.S. tax jurisdictions. As a result of the change in enacted tax rate and recording a full valuation allowance for the Company’s deferred tax assets in U.S. tax jurisdictions, the Company recorded a charge to its income tax provision in the fourth quarter of approximately $310.0 million. |
NOTE 20 – SUBSEQUENT EVENTS
On February 15, 2019, Holdings’ Board of Directors declared a cash dividend in the amount of $0.20 per share on Class A and Class B common stock, payable on March 25, 2019 to stockholders of record on March 11, 2019.
144
NOTE 21 – CONDENSED CONSOLIDATING FINANCIAL INFORMATION
Years Ended December 31, 2018, December 31, 2017, and December 31, 2016
The accompanying condensed consolidating financial information has been prepared and presented pursuant to SEC Regulation S-X Rule 3-10, Financial statements of guarantors and issuers of guaranteed securities registered or being registered. Each of the subsidiary guarantors are 100% owned by Holdings. The subsidiary guarantees of the Company’s Notes due 2022, the Sterling Notes due 2024, the Convertible Notes due 2024, the Notes due 2025, Notes due 2026, and the Notes due 2027 are full and unconditional and joint and several and subject to customary release provisions. The Company and its subsidiary guarantors’ investments in its consolidated subsidiaries are presented under the equity method of accounting.
Consolidating Statement of Operations
Year Ended December 31, 2018:
|
|
|
|
|
|
Subsidiary |
|
Subsidiary |
|
Consolidating |
|
Consolidated |
||||
|
(In millions) |
|
Holdings |
|
Guarantors |
|
Non-Guarantors |
|
Adjustments |
|
Holdings |
|||||
|
Revenues |
|
|
|
|
|
|
|
|
|
|
|
|
|
|
|
|
Admissions |
|
$ |
— |
|
$ |
2,006.5 |
|
$ |
1,378.5 |
|
$ |
— |
|
$ |
3,385.0 |
|
Food and beverage |
|
|
— |
|
|
1,041.7 |
|
|
629.8 |
|
|
— |
|
|
1,671.5 |
|
Other theatre |
|
|
— |
|
|
227.5 |
|
|
176.8 |
|
|
— |
|
|
404.3 |
|
Total revenues |
|
|
— |
|
|
3,275.7 |
|
|
2,185.1 |
|
|
— |
|
|
5,460.8 |
|
Operating costs and expenses |
|
|
|
|
|
|
|
|
|
|
|
|
|
|
|
|
Film exhibition costs |
|
|
— |
|
|
1,091.9 |
|
|
618.3 |
|
|
— |
|
|
1,710.2 |
|
Food and beverage costs |
|
|
— |
|
|
156.8 |
|
|
114.1 |
|
|
— |
|
|
270.9 |
|
Operating expense, excluding depreciation and amortization |
|
|
— |
|
|
931.4 |
|
|
723.3 |
|
|
— |
|
|
1,654.7 |
|
Rent |
|
|
— |
|
|
484.1 |
|
|
313.7 |
|
|
— |
|
|
797.8 |
|
General and administrative: |
|
|
|
|
|
|
|
|
|
|
|
|
|
|
|
|
Merger, acquisition and transaction costs |
|
|
— |
|
|
16.8 |
|
|
14.5 |
|
|
— |
|
|
31.3 |
|
Other, excluding depreciation and amortization |
|
|
— |
|
|
112.5 |
|
|
66.8 |
|
|
— |
|
|
179.3 |
|
Depreciation and amortization |
|
|
— |
|
|
285.4 |
|
|
252.4 |
|
|
— |
|
|
537.8 |
|
Impairment of long-lived assets |
|
|
— |
|
|
6.1 |
|
|
7.7 |
|
|
— |
|
|
13.8 |
|
Operating costs and expenses |
|
|
— |
|
|
3,085.0 |
|
|
2,110.8 |
|
|
— |
|
|
5,195.8 |
|
Operating income |
|
|
— |
|
|
190.7 |
|
|
74.3 |
|
|
— |
|
|
265.0 |
|
Other expense (income): |
|
|
|
|
|
|
|
|
|
|
|
|
|
|
|
|
Equity in net earnings of subsidiaries |
|
|
(14.5) |
|
|
(75.4) |
|
|
— |
|
|
89.9 |
|
|
— |
|
Other expense (income) |
|
|
(110.5) |
|
|
1.7 |
|
|
0.7 |
|
|
— |
|
|
(108.1) |
|
Interest expense: |
|
|
|
|
|
|
|
|
|
|
|
|
|
|
|
|
Corporate borrowings |
|
|
256.7 |
|
|
263.1 |
|
|
5.9 |
|
|
(263.4) |
|
|
262.3 |
|
Capital and financing lease obligations |
|
|
— |
|
|
6.8 |
|
|
31.7 |
|
|
— |
|
|
38.5 |
|
Non-cash NCM exhibitor service agreement |
|
|
— |
|
|
41.5 |
|
|
— |
|
|
— |
|
|
41.5 |
|
Equity in earnings of non-consolidated entities |
|
|
— |
|
|
(50.5) |
|
|
(36.2) |
|
|
— |
|
|
(86.7) |
|
Investment income |
|
|
(241.8) |
|
|
(27.1) |
|
|
(0.7) |
|
|
263.4 |
|
|
(6.2) |
|
Total other expense (income) |
|
|
(110.1) |
|
|
160.1 |
|
|
1.4 |
|
|
89.9 |
|
|
141.3 |
|
Earnings before income taxes |
|
|
110.1 |
|
|
30.6 |
|
|
72.9 |
|
|
(89.9) |
|
|
123.7 |
|
Income tax provision (benefit) |
|
|
— |
|
|
16.1 |
|
|
(2.5) |
|
|
— |
|
|
13.6 |
|
Net earnings |
|
$ |
110.1 |
|
$ |
14.5 |
|
$ |
75.4 |
|
$ |
(89.9) |
|
$ |
110.1 |
145
Consolidating Statement of Operations
Year Ended December 31, 2017:
|
|
|
|
|
|
Subsidiary |
|
Subsidiary |
|
Consolidating |
|
Consolidated |
||||
|
(In millions) |
|
Holdings |
|
Guarantors |
|
Non-Guarantors |
|
Adjustments |
|
Holdings |
|||||
|
Revenues |
|
|
|
|
|
|
|
|
|
|
|
|
|
|
|
|
Admissions |
|
$ |
— |
|
$ |
1,906.1 |
|
$ |
1,323.4 |
|
$ |
— |
|
$ |
3,229.5 |
|
Food and beverage |
|
|
— |
|
|
956.1 |
|
|
592.3 |
|
|
— |
|
|
1,548.4 |
|
Other theatre |
|
|
— |
|
|
168.1 |
|
|
133.2 |
|
|
— |
|
|
301.3 |
|
Total revenues |
|
|
— |
|
|
3,030.3 |
|
|
2,048.9 |
|
|
— |
|
|
5,079.2 |
|
Operating costs and expenses |
|
|
|
|
|
|
|
|
|
|
|
|
|
|
|
|
Film exhibition costs |
|
|
— |
|
|
1,001.8 |
|
|
602.5 |
|
|
— |
|
|
1,604.3 |
|
Food and beverage costs |
|
|
— |
|
|
138.9 |
|
|
113.2 |
|
|
— |
|
|
252.1 |
|
Operating expense, excluding depreciation and amortization |
|
|
— |
|
|
873.6 |
|
|
674.4 |
|
|
— |
|
|
1,548.0 |
|
Rent |
|
|
— |
|
|
496.7 |
|
|
297.7 |
|
|
— |
|
|
794.4 |
|
General and administrative: |
|
|
|
|
|
|
|
|
|
|
|
|
|
|
|
|
Merger, acquisition and transaction costs |
|
|
— |
|
|
58.3 |
|
|
4.7 |
|
|
— |
|
|
63.0 |
|
Other, excluding depreciation and amortization |
|
|
2.0 |
|
|
81.8 |
|
|
49.4 |
|
|
— |
|
|
133.2 |
|
Depreciation and amortization |
|
|
— |
|
|
290.7 |
|
|
247.9 |
|
|
— |
|
|
538.6 |
|
Impairment of long-lived assets |
|
|
— |
|
|
43.6 |
|
|
— |
|
|
— |
|
|
43.6 |
|
Operating costs and expenses |
|
|
2.0 |
|
|
2,985.4 |
|
|
1,989.8 |
|
|
— |
|
|
4,977.2 |
|
Operating income (loss) |
|
|
(2.0) |
|
|
44.9 |
|
|
59.1 |
|
|
— |
|
|
102.0 |
|
Other expense (income): |
|
|
|
|
|
|
|
|
|
|
|
|
|
|
|
|
Equity in net (earnings) loss of subsidiaries |
|
|
472.5 |
|
|
(31.9) |
|
|
— |
|
|
(440.6) |
|
|
— |
|
Other expense (income) |
|
|
— |
|
|
(0.9) |
|
|
(0.6) |
|
|
— |
|
|
(1.5) |
|
Interest expense: |
|
|
|
|
|
|
|
|
|
|
|
|
|
|
|
|
Corporate borrowings |
|
|
230.3 |
|
|
239.0 |
|
|
1.3 |
|
|
(239.0) |
|
|
231.6 |
|
Capital and financing lease obligations |
|
|
— |
|
|
7.7 |
|
|
34.7 |
|
|
— |
|
|
42.4 |
|
Equity in (earnings) loss of non-consolidated entities |
|
|
— |
|
|
192.2 |
|
|
(7.0) |
|
|
— |
|
|
185.2 |
|
Investment (income) expense |
|
|
(217.6) |
|
|
(43.0) |
|
|
(1.0) |
|
|
239.0 |
|
|
(22.6) |
|
Total other expense |
|
|
485.2 |
|
|
363.1 |
|
|
27.4 |
|
|
(440.6) |
|
|
435.1 |
|
Earnings (loss) before income taxes |
|
|
(487.2) |
|
|
(318.2) |
|
|
31.7 |
|
|
440.6 |
|
|
(333.1) |
|
Income tax provision (benefit) |
|
|
— |
|
|
154.3 |
|
|
(0.2) |
|
|
— |
|
|
154.1 |
|
Net earnings (loss) |
|
$ |
(487.2) |
|
$ |
(472.5) |
|
$ |
31.9 |
|
$ |
440.6 |
|
$ |
(487.2) |
146
Consolidating Statement of Operations
Year Ended December 31, 2016:
|
|
|
|
|
|
Subsidiary |
|
Subsidiary |
|
Consolidating |
|
Consolidated |
||||
|
(In millions) |
|
Holdings |
|
Guarantors |
|
Non-Guarantors |
|
Adjustments |
|
Holdings |
|||||
|
Revenues |
|
|
|
|
|
|
|
|
|
|
|
|
|
|
|
|
Admissions |
|
$ |
— |
|
$ |
1,945.1 |
|
$ |
104.3 |
|
$ |
— |
|
$ |
2,049.4 |
|
Food and beverage |
|
|
— |
|
|
972.9 |
|
|
46.2 |
|
|
— |
|
|
1,019.1 |
|
Other theatre |
|
|
— |
|
|
152.4 |
|
|
15.0 |
|
|
— |
|
|
167.4 |
|
Total revenues |
|
|
— |
|
|
3,070.4 |
|
|
165.5 |
|
|
— |
|
|
3,235.9 |
|
Operating costs and expenses |
|
|
|
|
|
|
|
|
|
|
|
|
|
|
|
|
Film exhibition costs |
|
|
— |
|
|
1,040.0 |
|
|
49.5 |
|
|
— |
|
|
1,089.5 |
|
Food and beverage costs |
|
|
— |
|
|
134.2 |
|
|
8.0 |
|
|
— |
|
|
142.2 |
|
Operating expense, excluding depreciation and amortization |
|
|
— |
|
|
830.8 |
|
|
42.7 |
|
|
— |
|
|
873.5 |
|
Rent |
|
|
— |
|
|
491.1 |
|
|
14.4 |
|
|
— |
|
|
505.5 |
|
General and administrative: |
|
|
|
|
|
|
|
|
|
|
|
|
|
|
|
|
Merger, acquisition and transaction costs |
|
|
— |
|
|
46.9 |
|
|
1.0 |
|
|
— |
|
|
47.9 |
|
Other, excluding depreciation and amortization |
|
|
2.0 |
|
|
84.0 |
|
|
4.0 |
|
|
— |
|
|
90.0 |
|
Depreciation and amortization |
|
|
— |
|
|
252.9 |
|
|
15.3 |
|
|
— |
|
|
268.2 |
|
Impairment of long-lived assets |
|
|
— |
|
|
5.5 |
|
|
— |
|
|
— |
|
|
5.5 |
|
Operating costs and expenses |
|
|
2.0 |
|
|
2,885.4 |
|
|
134.9 |
|
|
— |
|
|
3,022.3 |
|
Operating income (loss) |
|
|
(2.0) |
|
|
185.0 |
|
|
30.6 |
|
|
— |
|
|
213.6 |
|
Other expense (income): |
|
|
|
|
|
|
|
|
|
|
|
|
|
|
|
|
Equity in net (earnings) loss of subsidiaries |
|
|
(119.7) |
|
|
(32.7) |
|
|
— |
|
|
152.4 |
|
|
— |
|
Other expense (income) |
|
|
— |
|
|
0.4 |
|
|
(0.1) |
|
|
— |
|
|
0.3 |
|
Interest expense: |
|
|
|
|
|
|
|
|
|
|
|
|
|
|
|
|
Corporate borrowings |
|
|
110.5 |
|
|
123.7 |
|
|
— |
|
|
(123.5) |
|
|
110.7 |
|
Capital and financing lease obligations |
|
|
— |
|
|
8.5 |
|
|
2.3 |
|
|
— |
|
|
10.8 |
|
Equity in earnings of non-consolidated entities |
|
|
— |
|
|
(46.9) |
|
|
(0.8) |
|
|
— |
|
|
(47.7) |
|
Investment income |
|
|
(104.5) |
|
|
(28.3) |
|
|
(0.9) |
|
|
123.5 |
|
|
(10.2) |
|
Total other expense (income) |
|
|
(113.7) |
|
|
24.7 |
|
|
0.5 |
|
|
152.4 |
|
|
63.9 |
|
Earnings before income taxes |
|
|
111.7 |
|
|
160.3 |
|
|
30.1 |
|
|
(152.4) |
|
|
149.7 |
|
Income tax provision (benefit) |
|
|
— |
|
|
40.6 |
|
|
(2.6) |
|
|
— |
|
|
38.0 |
|
Net earnings |
|
$ |
111.7 |
|
$ |
119.7 |
|
$ |
32.7 |
|
$ |
(152.4) |
|
$ |
111.7 |
147
Consolidating Statement of Comprehensive Income (Loss)
Year Ended December 31, 2018:
|
|
|
|
|
|
Subsidiary |
|
Subsidiary |
|
Consolidating |
|
Consolidated |
|
||||
|
(In millions) |
|
Holdings |
|
Guarantors |
|
Non-Guarantors |
|
Adjustments |
|
Holdings |
|
|||||
|
Net earnings |
|
$ |
110.1 |
|
$ |
14.5 |
|
$ |
75.4 |
|
$ |
(89.9) |
|
$ |
110.1 |
|
|
Other comprehensive income (loss) |
|
|
|
|
|
|
|
|
|
|
|
|
|
|
|
|
|
Equity in other comprehensive income (loss) of subsidiaries |
|
|
(124.5) |
|
|
(99.1) |
|
|
— |
|
|
223.6 |
|
|
— |
|
|
Unrealized foreign currency translation adjustment, net of tax |
|
|
— |
|
|
(30.7) |
|
|
(97.0) |
|
|
— |
|
|
(127.7) |
|
|
Realized loss on foreign currency transactions, net of tax |
|
|
— |
|
|
1.0 |
|
|
— |
|
|
— |
|
|
1.0 |
|
|
Pension and other benefit adjustments: |
|
|
|
|
|
|
|
|
|
|
|
|
|
|
|
|
|
Net gain (loss) arising during the period, net of tax |
|
|
— |
|
|
6.3 |
|
|
(2.1) |
|
|
— |
|
|
4.2 |
|
|
Equity method investees’ cash flow hedge: |
|
|
|
|
|
|
|
|
|
|
|
|
|
|
|
|
|
Unrealized net holding (loss) gain arising during the period, net of tax |
|
|
— |
|
|
0.2 |
|
|
— |
|
|
— |
|
|
0.2 |
|
|
Realized net gain reclassified to equity in earnings of non-consolidated entities, net of tax |
|
|
— |
|
|
(2.2) |
|
|
— |
|
|
— |
|
|
(2.2) |
|
|
Other comprehensive loss |
|
|
(124.5) |
|
|
(124.5) |
|
|
(99.1) |
|
|
223.6 |
|
|
(124.5) |
|
|
Total comprehensive income (loss) |
|
$ |
(14.4) |
|
$ |
(110.0) |
|
$ |
(23.7) |
|
$ |
133.7 |
|
$ |
(14.4) |
|
148
Consolidating Statement of Comprehensive Income (Loss)
Year Ended December 31, 2017:
|
|
|
|
|
|
Subsidiary |
|
Subsidiary |
|
Consolidating |
|
Consolidated |
|
||||
|
(In millions) |
|
Holdings |
|
Guarantors |
|
Non-Guarantors |
|
Adjustments |
|
Holdings |
|
|||||
|
Net earnings (loss) |
|
$ |
(487.2) |
|
$ |
(472.5) |
|
$ |
31.9 |
|
$ |
440.6 |
|
$ |
(487.2) |
|
|
Other comprehensive income (loss) |
|
|
|
|
|
|
|
|
|
|
|
|
|
|
|
|
|
Equity in other comprehensive income (loss) of subsidiaries |
|
|
128.1 |
|
|
112.1 |
|
|
— |
|
|
(240.2) |
|
|
— |
|
|
Unrealized foreign currency translation adjustment, net of tax |
|
|
— |
|
|
22.0 |
|
|
109.7 |
|
|
— |
|
|
131.7 |
|
|
Pension and other benefit adjustments: |
|
|
|
|
|
|
|
|
|
|
|
|
|
|
|
|
|
Net gain (loss) arising during the period, net of tax |
|
|
— |
|
|
(5.4) |
|
|
2.4 |
|
|
— |
|
|
(3.0) |
|
|
Marketable securities: |
|
|
|
|
|
|
|
|
|
|
|
|
|
|
|
|
|
Unrealized net holding gain arising during the period, net of tax |
|
|
— |
|
|
0.7 |
|
|
— |
|
|
— |
|
|
0.7 |
|
|
Realized net gain reclassified into net investment income, net of tax |
|
|
— |
|
|
(0.4) |
|
|
— |
|
|
— |
|
|
(0.4) |
|
|
Equity method investees’ cash flow hedge: |
|
|
|
|
|
|
|
|
|
|
|
|
|
|
|
|
|
Realized net loss reclassified to equity in earnings of non-consolidated entities, net of tax |
|
|
— |
|
|
(0.9) |
|
|
— |
|
|
— |
|
|
(0.9) |
|
|
Other comprehensive income |
|
|
128.1 |
|
|
128.1 |
|
|
112.1 |
|
|
(240.2) |
|
|
128.1 |
|
|
Total comprehensive income (loss) |
|
$ |
(359.1) |
|
$ |
(344.4) |
|
$ |
144.0 |
|
$ |
200.4 |
|
$ |
(359.1) |
|
149
Consolidating Statement of Comprehensive Income (Loss)
Year Ended December 31, 2016:
|
|
|
|
|
|
Subsidiary |
|
Subsidiary |
|
Consolidating |
|
Consolidated |
||||
|
(In millions) |
|
Holdings |
|
Guarantors |
|
Non-Guarantors |
|
Adjustments |
|
Holdings |
|||||
|
Net earnings |
|
$ |
111.7 |
|
$ |
119.7 |
|
$ |
32.7 |
|
$ |
(152.4) |
|
$ |
111.7 |
|
Other comprehensive income (loss) |
|
|
|
|
|
|
|
|
|
|
|
|
|
|
|
|
Equity in other comprehensive income (loss) of subsidiaries |
|
|
(5.3) |
|
|
(3.6) |
|
|
— |
|
|
8.9 |
|
|
— |
|
Unrealized foreign currency translation adjustment, net of tax |
|
|
— |
|
|
(0.2) |
|
|
(3.7) |
|
|
— |
|
|
(3.9) |
|
Pension and other benefit adjustments: |
|
|
|
|
|
|
|
|
|
|
|
|
|
|
|
|
Net gain (loss) arising during the period, net of tax |
|
|
— |
|
|
(0.4) |
|
|
0.1 |
|
|
— |
|
|
(0.3) |
|
Marketable securities: |
|
|
|
|
|
|
|
|
|
|
|
|
|
|
|
|
Unrealized net holding gain arising during the period, net of tax |
|
|
— |
|
|
0.6 |
|
|
— |
|
|
— |
|
|
0.6 |
|
Realized net gain reclassified into net investment income, net of tax |
|
|
— |
|
|
(1.8) |
|
|
— |
|
|
— |
|
|
(1.8) |
|
Equity method investees’ cash flow hedge: |
|
|
|
|
|
|
|
|
|
|
|
|
|
|
|
|
Unrealized net holding loss arising during the period, net of tax |
|
|
— |
|
|
(0.3) |
|
|
— |
|
|
— |
|
|
(0.3) |
|
Realized net loss reclassified into equity in earnings of non-consolidated entities, net of tax |
|
|
— |
|
|
0.4 |
|
|
— |
|
|
— |
|
|
0.4 |
|
Other comprehensive loss |
|
|
(5.3) |
|
|
(5.3) |
|
|
(3.6) |
|
|
8.9 |
|
|
(5.3) |
|
Total comprehensive income |
|
$ |
106.4 |
|
$ |
114.4 |
|
$ |
29.1 |
|
$ |
(143.5) |
|
$ |
106.4 |
150
Consolidating Balance Sheet
As of December 31, 2018:
|
|
|
|
|
|
Subsidiary |
|
Subsidiary |
|
Consolidating |
|
Consolidated |
|
||||
|
(In millions) |
|
Holdings |
|
Guarantors |
|
Non-Guarantors |
|
Adjustments |
|
Holdings |
|
|||||
|
Assets |
|
|
|
|
|
|
|
|
|
|
|
|
|
|
|
|
|
Current assets: |
|
|
|
|
|
|
|
|
|
|
|
|
|
|
|
|
|
Cash and cash equivalents |
|
$ |
0.3 |
|
$ |
169.5 |
|
$ |
143.5 |
|
$ |
— |
|
$ |
313.3 |
|
|
Restricted cash |
|
|
— |
|
|
— |
|
|
10.7 |
|
|
— |
|
|
10.7 |
|
|
Receivables, net |
|
|
— |
|
|
157.3 |
|
|
106.6 |
|
|
(4.4) |
|
|
259.5 |
|
|
Assets held for sale |
|
|
— |
|
|
— |
|
|
— |
|
|
— |
|
|
— |
|
|
Other current assets |
|
|
— |
|
|
120.8 |
|
|
77.0 |
|
|
— |
|
|
197.8 |
|
|
Total current assets |
|
|
0.3 |
|
|
447.6 |
|
|
337.8 |
|
|
(4.4) |
|
|
781.3 |
|
|
Investment in equity of subsidiaries |
|
|
654.3 |
|
|
1,494.8 |
|
|
— |
|
|
(2,149.1) |
|
|
— |
|
|
Property, net |
|
|
— |
|
|
1,534.9 |
|
|
1,504.7 |
|
|
— |
|
|
3,039.6 |
|
|
Intangible assets, net |
|
|
— |
|
|
209.6 |
|
|
142.5 |
|
|
— |
|
|
352.1 |
|
|
Intercompany advances |
|
|
5,427.0 |
|
|
(3,541.1) |
|
|
(1,885.9) |
|
|
— |
|
|
— |
|
|
Goodwill |
|
|
(2.1) |
|
|
2,422.1 |
|
|
2,368.7 |
|
|
— |
|
|
4,788.7 |
|
|
Deferred tax asset, net |
|
|
— |
|
|
— |
|
|
97.3 |
|
|
(68.7) |
|
|
28.6 |
|
|
Other long-term assets |
|
|
59.8 |
|
|
307.5 |
|
|
138.2 |
|
|
— |
|
|
505.5 |
|
|
Total assets |
|
$ |
6,139.3 |
|
$ |
2,875.4 |
|
$ |
2,703.3 |
|
$ |
(2,222.2) |
|
$ |
9,495.8 |
|
|
Liabilities and Stockholders’ Equity |
|
|
|
|
|
|
|
|
|
|
|
|
|
|
|
|
|
Current liabilities: |
|
|
|
|
|
|
|
|
|
|
|
|
|
|
|
|
|
Accounts payable |
|
$ |
— |
|
$ |
301.5 |
|
$ |
155.6 |
|
$ |
(4.5) |
|
$ |
452.6 |
|
|
Accrued expenses and other liabilities |
|
|
31.5 |
|
|
176.4 |
|
|
170.5 |
|
|
0.1 |
|
|
378.5 |
|
|
Deferred revenues and income |
|
|
— |
|
|
313.0 |
|
|
101.8 |
|
|
— |
|
|
414.8 |
|
|
Current maturities of corporate borrowings and capital and financing lease obligations |
|
|
13.8 |
|
|
11.1 |
|
|
57.3 |
|
|
— |
|
|
82.2 |
|
|
Total current liabilities |
|
|
45.3 |
|
|
802.0 |
|
|
485.2 |
|
|
(4.4) |
|
|
1,328.1 |
|
|
Corporate borrowings |
|
|
4,696.0 |
|
|
— |
|
|
11.8 |
|
|
— |
|
|
4,707.8 |
|
|
Capital and financing lease obligations |
|
|
— |
|
|
63.8 |
|
|
429.4 |
|
|
— |
|
|
493.2 |
|
|
Exhibitor services agreement |
|
|
— |
|
|
564.0 |
|
|
— |
|
|
— |
|
|
564.0 |
|
|
Deferred tax liability, net |
|
|
— |
|
|
86.4 |
|
|
23.9 |
|
|
(68.7) |
|
|
41.6 |
|
|
Other long-term liabilities |
|
|
— |
|
|
704.9 |
|
|
258.2 |
|
|
— |
|
|
963.1 |
|
|
Total liabilities |
|
|
4,741.3 |
|
|
2,221.1 |
|
|
1,208.5 |
|
|
(73.1) |
|
|
8,097.8 |
|
|
Temporary equity |
|
|
0.4 |
|
|
— |
|
|
— |
|
|
— |
|
|
0.4 |
|
|
Stockholders’ equity |
|
|
1,397.6 |
|
|
654.3 |
|
|
1,494.8 |
|
|
(2,149.1) |
|
|
1,397.6 |
|
|
Total liabilities and stockholders’ equity |
|
$ |
6,139.3 |
|
$ |
2,875.4 |
|
$ |
2,703.3 |
|
$ |
(2,222.2) |
|
$ |
9,495.8 |
|
151
Consolidating Balance Sheet
As of December 31, 2017:
|
|
|
|
|
|
Subsidiary |
|
Subsidiary |
|
Consolidating |
|
Consolidated |
|
||||
|
(In millions) |
|
Holdings |
|
Guarantors |
|
Non-Guarantors |
|
Adjustments |
|
Holdings |
|
|||||
|
Assets |
|
|
|
|
|
|
|
|
|
|
|
|
|
|
|
|
|
Current assets: |
|
|
|
|
|
|
|
|
|
|
|
|
|
|
|
|
|
Cash and cash equivalents |
|
$ |
1.1 |
|
$ |
85.0 |
|
$ |
223.9 |
|
$ |
— |
|
$ |
310.0 |
|
|
Restricted cash |
|
|
— |
|
|
— |
|
|
8.3 |
|
|
— |
|
|
8.3 |
|
|
Receivables, net |
|
|
0.4 |
|
|
186.4 |
|
|
84.7 |
|
|
— |
|
|
271.5 |
|
|
Assets held for sale |
|
|
— |
|
|
80.0 |
|
|
— |
|
|
— |
|
|
80.0 |
|
|
Other current assets |
|
|
— |
|
|
118.0 |
|
|
84.6 |
|
|
— |
|
|
202.6 |
|
|
Total current assets |
|
|
1.5 |
|
|
469.4 |
|
|
401.5 |
|
|
— |
|
|
872.4 |
|
|
Investment in equity of subsidiaries |
|
|
2,450.6 |
|
|
1,513.4 |
|
|
— |
|
|
(3,964.0) |
|
|
— |
|
|
Property, net |
|
|
— |
|
|
1,591.1 |
|
|
1,525.4 |
|
|
— |
|
|
3,116.5 |
|
|
Intangible assets, net |
|
|
— |
|
|
218.9 |
|
|
161.6 |
|
|
— |
|
|
380.5 |
|
|
Intercompany advances |
|
|
3,914.1 |
|
|
(1,893.3) |
|
|
(2,020.8) |
|
|
— |
|
|
— |
|
|
Goodwill |
|
|
(2.1) |
|
|
2,422.1 |
|
|
2,511.7 |
|
|
— |
|
|
4,931.7 |
|
|
Deferred tax asset, net |
|
|
— |
|
|
— |
|
|
97.6 |
|
|
(68.7) |
|
|
28.9 |
|
|
Other long-term assets |
|
|
5.8 |
|
|
326.5 |
|
|
143.6 |
|
|
— |
|
|
475.9 |
|
|
Total assets |
|
$ |
6,369.9 |
|
$ |
4,648.1 |
|
$ |
2,820.6 |
|
$ |
(4,032.7) |
|
$ |
9,805.9 |
|
|
Liabilities and Stockholders’ Equity |
|
|
|
|
|
|
|
|
|
|
|
|
|
|
|
|
|
Current liabilities: |
|
|
|
|
|
|
|
|
|
|
|
|
|
|
|
|
|
Accounts payable |
|
$ |
— |
|
$ |
373.7 |
|
$ |
195.9 |
|
$ |
— |
|
$ |
569.6 |
|
|
Accrued expenses and other liabilities |
|
|
24.2 |
|
|
165.3 |
|
|
161.6 |
|
|
— |
|
|
351.1 |
|
|
Deferred revenues and income |
|
|
— |
|
|
270.8 |
|
|
130.2 |
|
|
— |
|
|
401.0 |
|
|
Current maturities of corporate borrowings and capital and financing lease obligations |
|
|
13.8 |
|
|
11.8 |
|
|
62.1 |
|
|
— |
|
|
87.7 |
|
|
Total current liabilities |
|
|
38.0 |
|
|
821.6 |
|
|
549.8 |
|
|
— |
|
|
1,409.4 |
|
|
Corporate borrowings |
|
|
4,218.7 |
|
|
1.4 |
|
|
— |
|
|
— |
|
|
4,220.1 |
|
|
Capital and financing lease obligations |
|
|
— |
|
|
73.5 |
|
|
505.4 |
|
|
— |
|
|
578.9 |
|
|
Exhibitor services agreement |
|
|
— |
|
|
530.9 |
|
|
— |
|
|
— |
|
|
530.9 |
|
|
Deferred tax liability, net |
|
|
— |
|
|
85.3 |
|
|
33.0 |
|
|
(68.7) |
|
|
49.6 |
|
|
Other long-term liabilities |
|
|
— |
|
|
684.8 |
|
|
219.0 |
|
|
— |
|
|
903.8 |
|
|
Total liabilities |
|
|
4,256.7 |
|
|
2,197.5 |
|
|
1,307.2 |
|
|
(68.7) |
|
|
7,692.7 |
|
|
Temporary equity |
|
|
0.8 |
|
|
— |
|
|
— |
|
|
— |
|
|
0.8 |
|
|
Stockholders’ equity |
|
|
2,112.4 |
|
|
2,450.6 |
|
|
1,513.4 |
|
|
(3,964.0) |
|
|
2,112.4 |
|
|
Total liabilities and stockholders’ equity |
|
$ |
6,369.9 |
|
$ |
4,648.1 |
|
$ |
2,820.6 |
|
$ |
(4,032.7) |
|
$ |
9,805.9 |
|
152
Consolidating Statement of Cash Flows
Year Ended December 31, 2018:
|
|
|
|
|
|
Subsidiary |
|
Subsidiary |
|
Consolidating |
|
Consolidated |
|
||||
|
(In millions) |
|
Holdings |
|
Guarantors |
|
Non-Guarantors |
|
Adjustments |
|
Holdings |
|
|||||
|
Cash flows from operating activities: |
|
|
|
|
|
|
|
|
|
|
|
|
|
|
|
|
|
Net cash provided by operating activities |
|
$ |
7.2 |
|
$ |
247.3 |
|
$ |
268.7 |
|
$ |
— |
|
$ |
523.2 |
|
|
Cash flows from investing activities: |
|
|
|
|
|
|
|
|
|
|
|
|
|
|
|
|
|
Capital expenditures |
|
|
— |
|
|
(286.0) |
|
|
(290.3) |
|
|
— |
|
|
(576.3) |
|
|
Proceeds from sale leaseback transactions |
|
|
— |
|
|
50.1 |
|
|
— |
|
|
— |
|
|
50.1 |
|
|
Proceeds from disposition of NCM |
|
|
— |
|
|
162.5 |
|
|
— |
|
|
— |
|
|
162.5 |
|
|
Proceeds from Screenvision merger |
|
|
— |
|
|
— |
|
|
45.8 |
|
|
— |
|
|
45.8 |
|
|
Proceeds from disposition of long-term assets |
|
|
— |
|
|
4.8 |
|
|
9.4 |
|
|
— |
|
|
14.2 |
|
|
Investments in non-consolidated entities, net |
|
|
— |
|
|
(11.4) |
|
|
— |
|
|
— |
|
|
(11.4) |
|
|
Other, net |
|
|
— |
|
|
(4.1) |
|
|
2.0 |
|
|
— |
|
|
(2.1) |
|
|
Net cash used in investing activities |
|
|
— |
|
|
(84.1) |
|
|
(233.1) |
|
|
— |
|
|
(317.2) |
|
|
Cash flows from financing activities: |
|
|
|
|
|
|
|
|
|
|
|
|
|
|
|
|
|
Proceeds from issuance of Senior Unsecured Convertible Notes due 2024 |
|
|
600.0 |
|
|
— |
|
|
— |
|
|
— |
|
|
600.0 |
|
|
Net borrowings under Revolving Credit Facility |
|
|
— |
|
|
— |
|
|
12.1 |
|
|
— |
|
|
12.1 |
|
|
Principal payments under Term Loan |
|
|
(13.8) |
|
|
— |
|
|
— |
|
|
— |
|
|
(13.8) |
|
|
Principal payments under capital and financing lease obligations |
|
|
— |
|
|
(10.4) |
|
|
(60.6) |
|
|
— |
|
|
(71.0) |
|
|
Principal payments under promissory note |
|
|
— |
|
|
(1.4) |
|
|
— |
|
|
— |
|
|
(1.4) |
|
|
Cash used to pay deferred financing costs |
|
|
(15.5) |
|
|
— |
|
|
— |
|
|
— |
|
|
(15.5) |
|
|
Cash used to pay dividends |
|
|
(258.1) |
|
|
— |
|
|
— |
|
|
— |
|
|
(258.1) |
|
|
Taxes paid for restricted unit withholdings |
|
|
(1.7) |
|
|
— |
|
|
— |
|
|
— |
|
|
(1.7) |
|
|
Retirement of Class B common stock |
|
|
(423.6) |
|
|
— |
|
|
— |
|
|
— |
|
|
(423.6) |
|
|
Purchase of treasury stock |
|
|
(21.8) |
|
|
— |
|
|
— |
|
|
— |
|
|
(21.8) |
|
|
Change in intercompany advances |
|
|
167.1 |
|
|
(108.5) |
|
|
(58.6) |
|
|
— |
|
|
— |
|
|
Net cash provided by (used in) financing activities |
|
|
32.6 |
|
|
(120.3) |
|
|
(107.1) |
|
|
— |
|
|
(194.8) |
|
|
Effect of exchange rate changes on cash and cash equivalents and restricted cash |
|
|
(40.6) |
|
|
41.6 |
|
|
(6.5) |
|
|
— |
|
|
(5.5) |
|
|
Net increase (decrease) in cash and cash equivalents and restricted cash |
|
|
(0.8) |
|
|
84.5 |
|
|
(78.0) |
|
|
— |
|
|
5.7 |
|
|
Cash and cash equivalents and restricted cash at beginning of period |
|
|
1.1 |
|
|
85.0 |
|
|
232.2 |
|
|
— |
|
|
318.3 |
|
|
Cash and cash equivalents and restricted cash at end of period |
|
$ |
0.3 |
|
$ |
169.5 |
|
$ |
154.2 |
|
$ |
— |
|
$ |
324.0 |
|
153
Consolidating Statement of Cash Flows
Year Ended December 31, 2017:
|
|
|
|
|
|
Subsidiary |
|
Subsidiary |
|
Consolidating |
|
Consolidated |
||||
|
(In millions) |
|
Holdings |
Guarantors |
|
Non-Guarantors |
|
Adjustments |
|
Holdings |
||||||
|
Cash flows from operating activities: |
|
|
|
|
|
|
|
|
|
|
|
|
|
|
|
|
Net cash provided by (used in) operating activities |
|
$ |
(10.2) |
|
$ |
231.3 |
|
$ |
316.3 |
|
$ |
— |
|
$ |
537.4 |
|
Cash flows from investing activities: |
|
|
|
|
|
|
|
|
|
|
|
|
|
|
|
|
Capital expenditures |
|
|
— |
|
|
(407.5) |
|
|
(219.3) |
|
|
— |
|
|
(626.8) |
|
Acquisition of Nordic, net of cash acquired |
|
|
— |
|
|
(654.9) |
|
|
77.3 |
|
|
— |
|
|
(577.6) |
|
Proceeds from sale leaseback transactions |
|
|
— |
|
|
136.2 |
|
|
— |
|
|
— |
|
|
136.2 |
|
Proceeds from disposition of NCM shares |
|
|
— |
|
|
89.0 |
|
|
— |
|
|
— |
|
|
89.0 |
|
Proceeds from disposition of Open Road |
|
|
— |
|
|
9.2 |
|
|
— |
|
|
— |
|
|
9.2 |
|
Proceeds from disposition of long-term assets |
|
|
— |
|
|
10.5 |
|
|
13.6 |
|
|
— |
|
|
24.1 |
|
Investments in non-consolidated entities, net |
|
|
— |
|
|
(11.1) |
|
|
— |
|
|
— |
|
|
(11.1) |
|
Other, net |
|
|
— |
|
|
(2.1) |
|
|
(0.2) |
|
|
— |
|
|
(2.3) |
|
Net cash used in investing activities |
|
|
— |
|
|
(830.7) |
|
|
(128.6) |
|
|
— |
|
|
(959.3) |
|
Cash flows from financing activities: |
|
|
|
|
|
|
|
|
|
|
|
|
|
|
|
|
Proceeds from the issuance of Senior Subordinated Sterling Notes due 2024 |
|
|
327.8 |
|
|
— |
|
|
— |
|
|
— |
|
|
327.8 |
|
Proceeds from the issuance of Senior Subordinated Notes due 2027 |
|
|
475.0 |
|
|
— |
|
|
— |
|
|
— |
|
|
475.0 |
|
Payment of Nordic SEK Term Loan |
|
|
(144.4) |
|
|
— |
|
|
— |
|
|
— |
|
|
(144.4) |
|
Payment of Nordic EUR Term Loan |
|
|
(169.5) |
|
|
— |
|
|
— |
|
|
— |
|
|
(169.5) |
|
Net proceeds from equity offering |
|
|
616.8 |
|
|
— |
|
|
— |
|
|
— |
|
|
616.8 |
|
Principal payment of Bridge Loan due 2017 |
|
|
(350.0) |
|
|
— |
|
|
— |
|
|
— |
|
|
(350.0) |
|
Principal payments under Term Loan |
|
|
(12.6) |
|
|
— |
|
|
— |
|
|
— |
|
|
(12.6) |
|
Principal payments under capital and financing lease obligations |
|
|
— |
|
|
(9.5) |
|
|
(61.2) |
|
|
— |
|
|
(70.7) |
|
Principal payments under promissory note |
|
|
— |
|
|
(1.4) |
|
|
— |
|
|
— |
|
|
(1.4) |
|
Cash used to pay deferred financing costs |
|
|
(29.8) |
|
|
— |
|
|
(3.8) |
|
|
— |
|
|
(33.6) |
|
Cash used to pay dividends |
|
|
(104.6) |
|
|
— |
|
|
— |
|
|
— |
|
|
(104.6) |
|
Taxes paid for restricted unit withholdings |
|
|
(6.5) |
|
|
— |
|
|
— |
|
|
— |
|
|
(6.5) |
|
Purchase of treasury stock |
|
|
(34.0) |
|
|
— |
|
|
— |
|
|
— |
|
|
(34.0) |
|
Change in intercompany advances |
|
|
(616.7) |
|
|
654.1 |
|
|
(37.4) |
|
|
— |
|
|
— |
|
Net cash provided by (used in) financing activities |
|
|
(48.5) |
|
|
643.2 |
|
|
(102.4) |
|
|
— |
|
|
492.3 |
|
Effect of exchange rate changes on cash and cash equivalents and restricted cash |
|
|
56.8 |
|
|
(53.5) |
|
|
14.4 |
|
|
— |
|
|
17.7 |
|
Net increase (decrease) in cash and cash equivalents and restricted cash |
|
|
(1.9) |
|
|
(9.7) |
|
|
99.7 |
|
|
— |
|
|
88.1 |
|
Cash and cash equivalents and restricted cash at beginning of period |
|
|
3.0 |
|
|
94.7 |
|
|
132.5 |
|
|
— |
|
|
230.2 |
|
Cash and cash equivalents and restricted cash at end of period |
|
$ |
1.1 |
|
$ |
85.0 |
|
$ |
232.2 |
|
$ |
— |
|
$ |
318.3 |
154
Consolidating Statement of Cash Flows
Year Ended December 31, 2016:
|
|
|
|
|
|
Subsidiary |
|
Subsidiary |
|
Consolidating |
|
Consolidated |
||||
|
(In millions) |
|
Holdings |
Guarantors |
|
Non-Guarantors |
|
Adjustments |
|
Holdings |
||||||
|
Cash flows from operating activities: |
|
|
|
|
|
|
|
|
|
|
|
|
|
|
|
|
Net cash provided by (used in) operating activities |
|
$ |
7.3 |
|
$ |
438.6 |
|
$ |
(14.2) |
|
$ |
— |
|
$ |
431.7 |
|
Cash flows from investing activities: |
|
|
|
|
|
|
|
|
|
|
|
|
|
|
|
|
Capital expenditures |
|
|
— |
|
|
(410.9) |
|
|
(10.8) |
|
|
— |
|
|
(421.7) |
|
Acquisition of Odeon, net of cash acquired |
|
|
— |
|
|
(480.3) |
|
|
64.7 |
|
|
— |
|
|
(415.6) |
|
Acquisition of Carmike, net of cash acquired |
|
|
— |
|
|
(584.3) |
|
|
86.5 |
|
|
— |
|
|
(497.8) |
|
Acquisition of Starplex Cinemas, net of cash |
|
|
— |
|
|
0.7 |
|
|
— |
|
|
— |
|
|
0.7 |
|
Proceeds from disposition of long-term assets |
|
|
— |
|
|
19.9 |
|
|
— |
|
|
— |
|
|
19.9 |
|
Investments in non-consolidated entities, net |
|
|
— |
|
|
(10.5) |
|
|
— |
|
|
— |
|
|
(10.5) |
|
Other, net |
|
|
— |
|
|
(6.5) |
|
|
— |
|
|
— |
|
|
(6.5) |
|
Net cash provided by (used in) investing activities |
|
|
— |
|
|
(1,471.9) |
|
|
140.4 |
|
|
— |
|
|
(1,331.5) |
|
Cash flows from financing activities: |
|
|
|
|
|
|
|
|
|
|
|
|
|
|
|
|
Proceeds from the issuance of Term Loan due 2023 |
|
|
498.7 |
|
|
— |
|
|
— |
|
|
— |
|
|
498.7 |
|
Proceeds from the issuance of Senior Subordinated Sterling Notes due 2024 |
|
|
310.0 |
|
|
— |
|
|
— |
|
|
— |
|
|
310.0 |
|
Proceeds from the issuance of Senior Subordinated Notes due 2026 |
|
|
595.0 |
|
|
— |
|
|
— |
|
|
— |
|
|
595.0 |
|
Proceeds from the issuance of Bridge Loan due 2017 |
|
|
350.0 |
|
|
— |
|
|
— |
|
|
— |
|
|
350.0 |
|
Payment of Odeon Senior Subordinated GBP Notes due 2018 |
|
|
(380.7) |
|
|
— |
|
|
— |
|
|
— |
|
|
(380.7) |
|
Payment of Odeon Senior Subordinated EUR Notes due 2018 |
|
|
(212.5) |
|
|
— |
|
|
— |
|
|
— |
|
|
(212.5) |
|
Payments under Revolving Credit Facility |
|
|
(75.0) |
|
|
— |
|
|
— |
|
|
— |
|
|
(75.0) |
|
Payments of stock issuance costs |
|
|
(0.8) |
|
|
— |
|
|
— |
|
|
— |
|
|
(0.8) |
|
Principal payments under Term Loan |
|
|
(8.8) |
|
|
— |
|
|
— |
|
|
— |
|
|
(8.8) |
|
Principal payments under capital and financing lease obligations |
|
|
— |
|
|
(8.6) |
|
|
(2.2) |
|
|
— |
|
|
(10.8) |
|
Principal payments under promissory note |
|
|
— |
|
|
(1.4) |
|
|
— |
|
|
— |
|
|
(1.4) |
|
Cash used to pay deferred financing fees |
|
|
(65.9) |
|
|
— |
|
|
— |
|
|
— |
|
|
(65.9) |
|
Cash used to pay dividends |
|
|
(79.6) |
|
|
— |
|
|
— |
|
|
— |
|
|
(79.6) |
|
Change in intercompany advances |
|
|
(935.1) |
|
|
968.1 |
|
|
(33.0) |
|
|
— |
|
|
— |
|
Net cash provided by (used) in financing activities |
|
|
(4.7) |
|
|
958.1 |
|
|
(35.2) |
|
|
— |
|
|
918.2 |
|
Effect of exchange rate changes on cash and equivalents |
|
|
(1.5) |
|
|
2.9 |
|
|
(0.8) |
|
|
— |
|
|
0.6 |
|
Net increase (decrease) in cash and equivalents |
|
|
1.1 |
|
|
(72.3) |
|
|
90.2 |
|
|
— |
|
|
19.0 |
|
Cash and equivalents at beginning of period |
|
|
1.9 |
|
|
167.0 |
|
|
42.3 |
|
|
— |
|
|
211.2 |
|
Cash and equivalents at end of period |
|
$ |
3.0 |
|
$ |
94.7 |
|
$ |
132.5 |
|
$ |
— |
|
$ |
230.2 |
|
|
|
|
|
|
|
|
|
|
|
|
|
|
|
|
|
155
Independent Auditor's Report
The Members
Digital Cinema Implementation Partners, LLC
We have audited the accompanying consolidated financial statements of Digital Cinema Implementation Partners, LLC and Subsidiaries, which comprise the consolidated balance sheets as of December 31, 2018 and 2017, and the related consolidated statements of operations and comprehensive income, members' equity and cash flows for each of the three years in the period ended December 31, 2018, and the related notes to the financial statements.
Management's Responsibility for the Financial Statements
Management is responsible for the preparation and fair presentation of these consolidated financial statements in accordance with accounting principles generally accepted in the United States of America; this includes the design, implementation, and maintenance of internal control relevant to the preparation and fair presentation of consolidated financial statements that are free from material misstatement, whether due to fraud or error.
Auditor's Responsibility
Our responsibility is to express an opinion on these consolidated financial statements based on our audits. We conducted our audits in accordance with auditing standards generally accepted in the United States of America. Those standards require that we plan and perform the audit to obtain reasonable assurance about whether the consolidated financial statements are free from material misstatement.
An audit involves performing procedures to obtain audit evidence about the amounts and disclosures in the consolidated financial statements. The procedures selected depend on the auditor's judgment, including the assessment of the risks of material misstatement of the consolidated financial statements, whether due to fraud or error. In making those risk assessments, the auditor considers internal control relevant to the entity's preparation and fair presentation of the consolidated financial statements in order to design audit procedures that are appropriate in the circumstances, but not for the purpose of expressing an opinion on the effectiveness of the entity's internal control. Accordingly, we express no such opinion. An audit also includes evaluating the appropriateness of accounting policies used and the reasonableness of significant accounting estimates made by management, as well as evaluating the overall presentation of the consolidated financial statements.
We believe that the audit evidence we have obtained is sufficient and appropriate to provide a basis for our audit opinion.
Opinion
In our opinion, the consolidated financial statements referred to above present fairly, in all material respects, the financial position of Digital Cinema Implementation Partners, LLC and Subsidiaries as of December 31, 2018 and 2017, and the results of their operations and their cash flows for each of the three years in the period ended December 31, 2018 in accordance with accounting principles generally accepted in the United States of America.
/s/ CohnReznick LLP
Roseland, New Jersey
156
DIGITAL CINEMA IMPLEMENTATION PARTNERS, LLC
($ in thousands)
|
December 31, |
||||
|
2018 |
2017 |
|||
|
ASSETS |
||||
|
Current assets: |
||||
|
Cash and cash equivalents |
$ 17,522 |
$ 10,892 |
||
|
Accounts receivable, net |
40,193 |
45,211 |
||
|
Other current assets |
192 |
193 |
||
|
Total current assets |
57,907 |
56,296 |
||
|
Property and equipment, net |
606,864 |
661,728 |
||
|
Deferred warranty reimbursement costs, net |
52,070 |
75,999 |
||
|
Restricted cash |
3,702 |
5,891 |
||
|
Derivative assets |
472 |
1,279 |
||
|
Other noncurrent assets |
21,174 |
26,394 |
||
|
Total assets |
$ 742,189 |
$ 827,587 |
||
|
LIABILITIES AND MEMBERS' EQUITY |
||||
|
Current liabilities: |
||||
|
Accounts payable and accrued liabilities |
$ 14,604 |
$ 10,717 |
||
|
Warranty reimbursement liability, current |
46,050 |
41,784 |
||
|
Total current liabilities |
60,654 |
52,501 |
||
|
Warranty reimbursement liability (excluding current) |
55,530 |
101,779 |
||
|
Long-term debt, net |
69,737 |
193,853 |
||
|
Other noncurrent liabilities |
6,820 |
6,762 |
||
|
Total liabilities |
192,741 |
354,895 |
||
|
Commitments |
||||
|
Members' equity |
549,448 |
472,692 |
||
|
Total liabilities and members' equity |
$ 742,189 |
$ 827,587 |
||
See Notes to Consolidated Financial Statements.
157
DIGITAL CINEMA IMPLEMENTATION PARTNERS, LLC
CONSOLIDATED STATEMENTS OF OPERATIONS AND COMPREHENSIVE INCOME
($ in thousands)
|
Years Ended December 31, |
|||||
|
2018 |
2017 |
2016 |
|||
|
REVENUES |
|||||
|
Virtual print fees |
$ 178,998 |
$ 180,101 |
$ 183,242 |
||
|
Exhibitor lease fees |
14,976 |
14,938 |
14,998 |
||
|
Alternative content fees |
2,873 |
2,147 |
1,659 |
||
|
Peak period payments |
5,072 |
5,499 |
4,393 |
||
|
Management fees |
3,328 |
3,413 |
3,284 |
||
|
Sales revenue |
349 |
394 |
456 |
||
|
Subtotal, operating revenues |
205,596 |
206,492 |
208,032 |
||
|
Warranty reimbursement costs |
(23,663) |
(23,803) |
(23,887) |
||
|
Exhibitor lease, step-up rent adjustment |
(5,201) |
(5,307) |
(5,308) |
||
|
Net operating revenues |
176,732 |
177,382 |
178,837 |
||
|
OPERATING EXPENSES |
|||||
|
General and administrative |
9,280 |
9,637 |
9,825 |
||
|
Bad debt expense |
4,198 |
- |
- |
||
|
Depreciation and amortization |
61,018 |
61,058 |
61,092 |
||
|
Total operating expenses |
74,496 |
70,695 |
70,917 |
||
|
Operating income |
102,236 |
106,687 |
107,920 |
||
|
INTEREST EXPENSE |
|||||
|
Interest expense |
5,327 |
10,602 |
15,472 |
||
|
Amortization of deferred financing costs |
885 |
1,536 |
1,953 |
||
|
Total interest expense |
6,212 |
12,138 |
17,425 |
||
|
OTHER INCOME (EXPENSE) |
|||||
|
Interest income |
313 |
91 |
9 |
||
|
Loss on sale of assets |
(1,250) |
(1,253) |
(1,121) |
||
|
Other income |
78 |
106 |
102 |
||
|
Total other expense |
(859) |
(1,056) |
(1,010) |
||
|
Income before taxes |
95,165 |
93,493 |
89,485 |
||
|
Income tax expense |
408 |
390 |
333 |
||
|
Net income |
94,757 |
93,103 |
89,152 |
||
|
OTHER COMPREHENSIVE INCOME (LOSS) |
|||||
|
Gain (loss) on interest rate swap contracts |
(809) |
659 |
176 |
||
|
Comprehensive income |
$ 93,948 |
$ 93,762 |
$ 89,328 |
||
See Notes to Consolidated Financial Statements.
158
DIGITAL CINEMA IMPLEMENTATION PARTNERS, LLC
CONSOLIDATED STATEMENTS OF MEMBERS’ EQUITY
($ in thousands)
|
Years Ended December 31, |
||||||
|
2018 |
2017 |
2016 |
||||
|
Balance, beginning of year |
$ 472,692 |
$ 397,360 |
$ 329,565 |
|||
|
Capital contributions |
5,108 |
4,070 |
2,528 |
|||
|
Distributions to Members |
(22,300) |
(22,500) |
(24,061) |
|||
|
Net income |
94,757 |
93,103 |
89,152 |
|||
|
Balance before other comprehensive income (loss) |
550,257 |
472,033 |
397,184 |
|||
|
Other comprehensive income (loss) - gain (loss) on derivatives |
(809) |
659 |
176 |
|||
|
Balance, end of year |
$ 549,448 |
$ 472,692 |
$ 397,360 |
|||
See Notes to Consolidated Financial Statements.
159
DIGITAL CINEMA IMPLEMENTATION PARTNERS, LLC
CONSOLIDATED STATEMENTS OF CASH FLOWS
($ in thousands)
|
Years Ended December 31, |
||||||
|
2018 |
2017 |
2016 |
||||
|
Operating activities: |
||||||
|
Net income |
$ 94,757 |
$ 93,103 |
$ 89,152 |
|||
|
Adjustments to reconcile net income to net cash |
||||||
|
provided by operating activities: |
||||||
|
Depreciation and amortization |
61,018 |
61,058 |
61,092 |
|||
|
Amortization of deferred warranty reimbursement costs |
23,663 |
23,803 |
23,887 |
|||
|
Amortization of deferred financing costs |
885 |
1,536 |
1,953 |
|||
|
Amortization of derivative assets |
(2) |
- |
- |
|||
|
Loss on sale of assets |
1,250 |
1,253 |
1,121 |
|||
|
Changes in operating assets and liabilities: |
||||||
|
Accounts receivable |
5,018 |
(4,469) |
(9,774) |
|||
|
Other current and noncurrent assets |
5,221 |
5,311 |
5,356 |
|||
|
Accounts payable and accrued liabilities |
2,013 |
113 |
(2,518) |
|||
|
Warranty reimbursement liability |
(30,546) |
(23,639) |
(17,060) |
|||
|
Payment of prior period warranty reimbursement liability |
(9,041) |
(6,641) |
(4,695) |
|||
|
Other noncurrent liabilities |
58 |
2,779 |
3,977 |
|||
|
Net cash provided by operating activities |
154,294 |
154,207 |
152,491 |
|||
|
Investing activities: |
||||||
|
Purchase of property and equipment |
(7,668) |
(5,199) |
(1,447) |
|||
|
Payment of prior period property and equipment |
(298) |
(123) |
(312) |
|||
|
Sale of property and equipment |
305 |
2,783 |
1,657 |
|||
|
Net cash used in investing activities |
(7,661) |
(2,539) |
(102) |
|||
|
Financing activities: |
||||||
|
Paydown of long-term debt |
(125,000) |
(125,000) |
(145,000) |
|||
|
Capital contributions from Members |
5,108 |
4,070 |
2,528 |
|||
|
Distributions to Members |
(22,300) |
(22,500) |
(24,061) |
|||
|
Deferred financing costs |
- |
- |
(847) |
|||
|
Net cash used in financing activities |
(142,192) |
(143,430) |
(167,380) |
|||
|
Net increase (decrease) in cash, cash equivalents and restricted cash |
4,441 |
8,238 |
(14,991) |
|||
|
Cash, cash equivalents and restricted cash, beginning of year |
16,783 |
8,545 |
23,536 |
|||
|
Cash, cash equivalents and restricted cash, end of year |
$ 21,224 |
$ 16,783 |
$ 8,545 |
|||
|
Supplemental schedule of non-cash investing and financing activities: |
||||||
|
Additions to property and equipment included in accounts payable |
||||||
|
and accrued liabilities |
$ 42 |
$ 298 |
$ 123 |
|||
160
|
Warranty reimbursement payable in accounts payable and accrued liabilities |
$ 11,171 |
$ 9,041 |
$ 6,641 |
|||
|
Deferred warranty asset and warranty reimbursement obligation |
$ (265) |
$ (802) |
$ (650) |
See Notes to Consolidated Financial Statements.
161
DIGITAL CINEMA IMPLEMENTATION PARTNERS, LLC
NOTES TO CONSOLIDATED FINANCIAL STATEMENTS
Note 1 - Nature of Operations
Digital Cinema Implementation Partners, LLC, ("DCIP", and together with its consolidated wholly-owned subsidiaries, the "Company") was formed as a Delaware limited liability company on February 12, 2007 for the purpose of raising third-party capital to purchase and deploy digital cinema projection equipment ("Digital Systems") in theatres located throughout the United States and Canada. The Company will continue in perpetuity. The Company is headquartered in New Jersey and has offices in Colorado and Minnesota. The Company is owned by its founding members American Multi-Cinema, Inc. ("AMC"), Cinemark Media, Inc. ("Cinemark") and Regal/DCIP Holdings, LLC ("Regal") (collectively, the "Founding Members").
On March 10, 2010, the Company completed an initial financing transaction for the deployment of Digital Systems utilizing its subsidiary entities Kasima, LLC ("Kasima"), Kasima Holdings, LLC ("Holdings") and Kasima Parent Holdings, LLC ("Parent") to execute its business plan. Kasima is a wholly-owned subsidiary of Holdings, Holdings is a wholly-owned subsidiary of Parent and Parent is a wholly-owned subsidiary of DCIP. As part of the initial financing transaction, Parent entered into a note purchase agreement with a third-party investment fund. On March 31, 2011, the Company obtained the incremental financing necessary to complete its planned deployment of Digital Systems and on May 17, 2013, the Company refinanced all of its outstanding senior secured debt, extending the term of that debt and lowering its effective interest rate. On March 31, 2014, Parent repaid, in full, the outstanding notes under the note purchase agreement.
Digital Systems are purchased by Kasima and leased to each Founding Member or one of its affiliates (each such entity, an "Exhibitor") pursuant to the terms of a Master Equipment Lease Agreement ("ELA"). Kasima facilitates the installation of the leased Digital Systems into each Exhibitor's theatres pursuant to the terms of an Installation Agreement. The Exhibitor is responsible for the ongoing maintenance and insurance of the Digital Systems. The Company has also entered into (and assigned to Kasima) long-term Digital Cinema Deployment Agreements ("DCDAs") with six major motion picture studios ("Major Studios") pursuant to which Kasima receives a virtual print fee ("VPF") each time the studio books a film or certain other content on the Digital Systems. Other content distributors have entered into DCDAs or shorter term agreements with the Company that provide for the payment of VPFs (or as more fully described and defined in Note 2, alternative content fees or "ACFs") to Kasima for bookings of the distributor's content on a Digital System. One such distributor, AC JV, LLC ("Fathom Events"), is related to DCIP through common ownership.
On June 20, 2011, DCIP and Canadian Digital Cinema Partnership ("CDCP") entered into a long-term management services agreement (an "MSA" and with respect to CDCP, the "CDCP MSA") to manage a similar deployment of Digital Systems in Canada and to perform certain other specified services for CDCP related thereto (see Note 2). CDCP is a Canadian limited partnership formed by Cineplex Entertainment LP ("Cineplex") and Empire Theatres Ltd. ("Empire") to facilitate the purchase and deployment of Digital Systems to their theatres in Canada. On April 1, 2012, DCIP entered into a long-term MSA with Cinemark USA, Inc., a Texas corporation and an affiliate of Cinemark, to manage deployment of Digital Systems to theatres operated by its affiliates in Latin America (the "CNI MSA"). On September 1, 2014, DCIP entered into a long-term MSA with Fathom Events to provide it with management and software related services. The services we provide under this agreement have changed from time to time.
Note 2 - Summary of Significant Accounting Policies
Principles of consolidation
The consolidated financial statements include the accounts of DCIP and its subsidiaries. Intercompany accounts have been eliminated in consolidation.
New accounting standards
162
In May 2014, the Financial Accounting Standards Board ("FASB") issued guidance on revenue from contracts with customers. This update is a comprehensive new revenue recognition model that requires a company to recognize revenue upon transfer of goods or services to a customer at an amount that reflects the consideration it expects to receive in exchange for those goods or services. It also requires additional disclosure about the nature, amount, timing and uncertainty of revenue and cash flows arising from customer contracts, including significant judgements and changes in judgements and assets recognized from costs incurred to obtain or fulfill a contract. This accounting guidance is effective prospectively for annual reporting periods, and interim periods within those periods, beginning after December 15, 2017.
The Company adopted the new standard and related updates on January 1, 2018 and used the modified retrospective method of adoption. The Company reviewed the terms and conditions of its existing customer contracts and applied the five discrete criteria required for recognizing revenue as set forth in ASU 2014-09. Based upon its analysis, the new revenue recognition guidance had no significant impact on the Company's consolidated financial statements.
In February 2016, the FASB issued guidance related to leases. This new guidance requires lessees to recognize on the balance sheet a right-of-use asset, representing its right to use the underlying asset for the lease term, and a lease liability for all leases with a term greater than 12 months. The guidance also requires qualitative and quantitative disclosures designed to assess the amount, timing, and uncertainty of cash flows arising from leases. The standard requires the use of a modified retrospective transition approach, which includes optional practical expedients that entities may elect to apply. This new guidance is effective for fiscal years beginning after December 15, 2018, including interim periods within those fiscal years. Early application is permitted. The Company is in the process of evaluating the effect the guidance will have on its consolidated financial statements and related disclosures and does not expect this new standard to have a material effect on its consolidated financial statements.
In November 2016, the FASB issued guidance related to the classification and presentation of restricted cash in the statement of cash flows. This guidance requires entities to include in its cash and cash equivalent balances any amounts that are deemed restricted cash and restricted cash equivalents. This accounting guidance is effective prospectively for annual reporting periods, and interim periods within those periods, beginning after December 15, 2017. The Company adopted this standard retrospectively on January 1, 2018.
In August 2017, the FASB amended the requirements of the Derivatives and Hedging Topic of the Accounting Standards Codification to improve the financial reporting of hedging relationships to better portray the economic results of an entity's risk management activities in its financial statements. The amendments will be effective for the Company beginning after December 15, 2018. Early adoption is permitted. The Company does not anticipate that the adoption of this guidance will have a significant impact on its consolidated financial statements.
Use of estimates
The preparation of financial statements in conformity with U.S. generally accepted accounting principles ("GAAP") requires management to make estimates and assumptions that affect the amounts reported in the financial statements and accompanying notes. The Company's most significant estimates relate to depreciation and recoverability of property and equipment, amortization, the valuation of derivative agreements and the reimbursement liability concerning equipment warranty and replacement costs under the ELAs. The Company bases its estimates on historical experience and on various other assumptions that the Company believes to be reasonable under the circumstances, the results of which form the basis for making judgments about the carrying values of assets and liabilities that are not readily apparent from other sources. Actual results could differ from these estimates under different assumptions or conditions.
Cash and cash equivalents
The Company considers all highly-liquid investments with an original maturity of three months or less to be cash equivalents. The carrying amount of the Company's cash equivalents approximates fair value due to the short maturities of these investments and consists primarily of money market funds and other overnight investments. The Company maintains bank accounts with major banks, which from time to time may exceed the Federal Deposit Insurance Corporation's insured limits. The Company periodically assesses the financial condition of the institutions and believes that the risk of any loss is minimal.
163
Concentration of credit risk
For the years ended December 31, 2018 and 2017, the Company had three customers that represented 33% and 34%, respectively, of operating revenues and for the year ended December 31, 2016, the Company had four customers that represented 44% of operating revenues. At December 31, 2018 and 2017, four and three customers represented 55% and 39%, respectively, of net accounts receivable. These customers are each parties to DCDAs. None of the Company's other customers individually represented more than 10% of operating revenues or accounts receivable at December 31, 2018 or 2017, or for the years ended December 31, 2018, 2017 and 2016.
The Company has credit risk associated with certain accounts receivable, which consists primarily of amounts owed by the Major Studios and other digital content distributors. The Company actively monitors the status of its accounts receivable and has mechanisms in place to minimize the potential for incurring material accounts receivable credit losses. During 2018, the Company incurred bad debt expense of $4,198,000 related primarily to two studio bankruptcies. At December 31, 2018 and 2017, management has determined that there is no requirement for an allowance for doubtful accounts.
Concentration in foreign countries
The Company originally leased Digital Systems to AMC (pursuant to its ELA) for theatres located in Canada and receives revenues from CDCP pursuant to the CDCP MSA. In 2013, AMC sold the last of its Canadian theatres and, as a result, the Company no longer leases Digital Systems to AMC in Canada. The revenue previously earned from these operations was paid to the Company in U.S. dollars. For the years ended December 31, 2018, 2017 and 2016, revenues earned from Canadian sources totaled $1,812,000, $1,799,000 and $1,812,000, respectively. The carrying value of equipment deployed in Canada at December 31, 2018 and 2017 was zero. Revenue earned by the Company under the CNI MSA for theatres located in Latin America was $722,000, $818,000 and $825,000, for the years ended December 31, 2018, 2017 and 2016, respectively.
Fair value and credit risk
All current assets and liabilities are carried at cost, which approximates fair value due to the short-term maturities of those instruments. The Company's Credit Facility (see Note 7) is comprised of floating rate instruments and management believes fair value approximates carrying value.
Property and equipment, net
Property and equipment, net, is stated at cost, less accumulated depreciation and amortization. Depreciation is calculated using the straight-line method over the estimated useful lives of the respective assets as follows:
|
Computer equipment and software |
3-5 years |
|
Leasehold improvements |
5 years |
|
Digital cinema projection equipment |
17.5 years |
|
Furniture and fixtures |
7 years |
Leasehold improvements are amortized over the shorter of the lease term or the estimated useful life of the assets. Certain costs of computer software developed or obtained for internal use are capitalized and amortized on a straight-line basis over three to five years. Costs for general and administrative expenses, overhead, maintenance and training, as well as the cost of software coding that does not add functionality to existing systems, are expensed as incurred. Upon the sale or other disposition of any property and equipment, the cost and related accumulated depreciation and amortization are removed from the accounts and the gain or loss on disposal is included in the consolidated statements of operations and comprehensive income.
Deferred financing costs, net
Deferred financing costs are amortized on the interest method basis for the Credit Facility as described in Note 7 and by a charge to interest expense over the term of the Credit Facility and reported as a reduction of long-term debt, net. Accumulated amortization of deferred financing costs at December 31, 2018 and 2017 totaled $11,713,000 and $10,828,000, respectively.
164
Fair value measurements
The Company accounts for and reports the fair value of certain assets and liabilities. The Company applies fair value accounting for financial assets and liabilities that are recognized or disclosed at fair value in its consolidated financial statements.
The Company utilizes valuation techniques that maximize the use of observable inputs (Levels 1 and 2) and minimize the use of unobservable inputs (Level 3) within the fair value hierarchy established by the Financial Accounting Standards Board Accounting Standards Codification ("ASC"):
Level 1:Quoted market prices in active markets for identical assets or liabilities.
Level 2:Observable market-based inputs or unobservable inputs that are corroborated by market data.
Level 3:Unobservable inputs reflecting the reporting entity's own assumptions.
The following table sets forth, by level, the fair value measurements of the Company's consolidated financial assets ($ in thousands):
Fair Value Measurements
|
|
|
|
|
|
|
|
|
|
|
|
|
|
December 31, |
|
|
|
|
|
|
|
|
|
|
2018 |
|
Level 1 |
|
Level 2 |
|
Level 3 |
|
|
Fair value of Interest Rate Swap |
|
$472(1) |
|
$ - |
|
$ 472
|
|
$ - |
|
|
|
|||||||||
|
(1) Reported in derivative assets on the consolidated balance sheets. |
|||||||||
The fair value of the Company's assets under its Interest Rate Swap (as defined below) is based upon observable market-based inputs that reflect the present values of the difference between estimated future fixed rate payments and future variable receipts and, therefore, is classified within Level 2. The Level 2 fair value of the Company's Interest Rate Swap at December 31, 2017 was $1,279,000.
Accounting for derivatives
In May 2013, the Company terminated an existing swap arrangement and executed new interest rate swap agreements (the "Interest Rate Swap"). Derivative financial instruments are recorded at fair value. Changes in the fair value of derivative financial instruments are either recognized in accumulated other comprehensive income (loss) (a component of members' equity) or in the consolidated statements of operations and comprehensive income depending on whether the derivative is being used to hedge changes in cash flows or fair value. The Company determined that the Interest Rate Swap was an effective cash flow hedging instrument through December 31, 2017 and, as a result, changes in the fair value of the Interest Rate Swap are recognized in other comprehensive income (loss). During 2018, a portion of the hedge was designated as ineffective and an immaterial amount was recognized as interest expense in the consolidated statements of operations and comprehensive income.
Income taxes
The Company is a limited liability company and, as such, is treated as a partnership for federal and state income tax purposes. Accordingly, as a partnership for tax purposes, the Company is not a taxable entity for federal income taxes and is not subject to significant state income taxes. However, the Company does pay certain state taxes based on revenue or net income that are reported as income tax expense on the consolidated statements of operations and comprehensive income. Income or loss of the Company as a limited liability company is reported to and included in the individual income tax returns of its members. Tax years ended December 31, 2017, 2016 and 2015 remain open to examination by federal and state taxing authorities with regard to the allocation of income or losses by the Company to its members.
165
Impairment of long-lived assets
The Company reviews the recoverability of its long-lived assets when events or conditions exist that indicate a possible impairment. The assessment for recoverability is based primarily on the Company's ability to recover the carrying value of its long-lived assets from expected future undiscounted net cash flows. If the total of expected future undiscounted net cash flows is less than the total carrying value of an asset, the asset is deemed not to be recoverable and possibly impaired. The Company then estimates the fair value of the asset to determine whether an impairment loss should be recognized. An impairment loss will be recognized if the carrying value of the asset exceeds its fair value. Fair value is determined by computing the expected future discounted cash flows. No impairment charges were recorded for the years ended December 31, 2018, 2017 or 2016.
Revenue recognition
The Company has analyzed the provisions of the FASB's ASC Topic 606, Revenue from Contracts with Customers, and has concluded that no changes are necessary to conform with the new standard.
The majority of the Company's revenues are VPFs from Major Studios under the DCDAs. The Company earns VPF revenue when movies and certain other content distributed by Major Studios and other content distributors are booked and exhibited on screens utilizing the Company's Digital Systems. VPFs are earned and payable based on a fee schedule outlined in the DCDAs and other VPF agreements. The VPF revenue is recognized in the period in which it is earned, generally the first time the content is booked and exhibited in the theatre auditorium for which a Digital System has been installed.
The DCDAs with the Major Studios require the payment of VPFs for a period that ends on the earlier to occur of (i) the tenth anniversary of the "mean deployment date" for all Digital Systems scheduled to be deployed over a period of up to five years, or (ii) the date the Company achieves "cost recoupment", each as defined in the DCDAs. Cost recoupment occurs when revenues attributable to the Digital Systems exceed the costs associated with their purchase (including financing), deployment, administration and other allowed amounts, all as defined in the DCDAs.
In addition to VPF revenue, the Company also earns a fee each time certain digital content other than feature films (e.g., concerts, sporting events and opera performances) is booked and exhibited on a Digital System. The Company refers to fees derived on a per-exhibition basis from these alternative forms of digital content as alternative content fees ("ACFs"). ACFs may be paid by the distributor of the alternative content pursuant to an agreement with the Company or by the Exhibitor showing the content pursuant to its ELA. ACF revenue is recognized in the period in which the alternative content is exhibited.
Lease revenues in respect of the Digital Systems and certain other rental and usage fees are earned by the Company in accordance with the terms of the ELAs. All amounts due to the Company under these agreements are recognized as revenue when earned and any unearned amounts are recorded as deferred revenue. The initial lease term for each piece of equipment deployed under the ELAs begins on the date the equipment is placed in service and continues for 12 years, with the first and last month incurring one-half of the monthly lease payment otherwise due.
The Company generates multiple revenue streams from the leased Digital Systems under the ELAs as follows:
Lease fees are payable by the Exhibitors monthly and prior to March 31, 2014 were comprised of a fixed base lease rate plus a "step-up" rate component for all equipment (regardless of lease commencement date) that was to occur on October 1, 2016. The Company recognized lease revenue from these fees on a straight-line method making an allowance for the step-up in rent that was to occur. On March 31, 2014, the ELAs were amended to remove the scheduled step-up lease payments. The accumulated effects of the amendments are being amortized on a straight-line basis as a reduction in revenue over the remaining terms of the ELAs.
Contingent rent may be due under the ELAs if total revenues in respect of the Digital Systems deployed thereunder (calculated quarterly on a rolling last twelve-month basis) fail to meet certain minimum revenue thresholds. The minimum revenue thresholds were prorated for the initial four quarters of the ELAs. Contingent rent, if any, is calculated and recognized monthly, but billed and paid quarterly. No Contingent rent was due for the years ending December 31, 2018, 2017 or 2016.
166
Peak period payments are due under the ELAs when the leased Digital Systems are taken out of service by an Exhibitor for one or more consecutive defined "peak periods" (generally a weekend) as a result of relocation, damage or a complex closing. Peak period payments, if any, are recognized, billed and paid monthly.
In accordance with the ELAs, the Exhibitors are required to acquire extended warranties with respect to the leased Digital Systems covering the period from the expiration of the initial included manufacturer's warranty through the date of repayment of the Credit Facility (the "Warranty End Date"), but in no event later than 12 years from the effective date of the ELAs. Following the Warranty End Date, the Exhibitors may choose to continue extended warranty coverage through the expiration of the DCDAs (the "DCDA End Date"). The DCDA End Date will occur on the earlier of (i) the tenth anniversary of the "mean deployment date" of the Digital Systems or (ii) the date the Company achieves "cost recoupment", each as defined in the DCDAs. The Company expects that the Exhibitors will maintain extended warranty coverage through the DCDA End Date. Pursuant to the ELAs, the Company is required to reimburse the Exhibitor for the costs of the extended warranties (and/or equipment replacement costs) subject to quarterly caps set forth in the ELAs. This contractual obligation by the Company to incur costs at a future date for the extended warranties or replacement costs when the leased equipment is purchased creates a liability at the purchase date and a contra revenue adjustment in respect of revenues derived under the ELAs that is recognized on a straight-line basis over the term of the lease.
The Company also earns revenues in respect of the services DCIP provides under the MSAs. The revenues are earned ratably as the services are performed under the agreement.
Subsequent events
The Company has evaluated subsequent events through February 18, 2019, which is the date the consolidated financial statements were available to be issued.
Note 3 - Financing Transactions
On May 17, 2013, the Company refinanced its then outstanding senior secured debt, extending its term and lowering its effective interest rate. The transaction consisted of a $755,000,000 senior secured loan commitment (the Credit Facility described in Note 7) to Kasima from a group of commercial banks and institutional investors.
Note 4 - Consolidated Balance Sheet Components
Restricted cash
The Company had restricted cash of $3,702,000 and $5,891,000 at December 31, 2018 and 2017, respectively, in the form of an interest reserve escrow account related to the Credit Facility (see Note 7) and an excess cost escrow account for the funding of Digital Systems in excess of costs caps established in the related credit agreement.
Accounts receivable, net
Accounts receivable, net consists of the following ($ in thousands):
|
December 31, |
|||
|
2018 |
2017 |
||
|
Accounts receivable |
$ 40,676 |
$ 45,891 |
|
|
Accrued revenue |
766 |
606 |
|
|
Deferred revenue(1) |
(1,249) |
(1,286) |
|
|
Total accounts receivable, net |
$ 40,193 |
$ 45,211 |
|
(1) Deferred revenue consists of unearned amounts billed but not collected at December 31, 2018 and 2017.
167
Accounts payable and accrued liabilities
Accounts payable and accrued liabilities consists of the following ($ in thousands):
|
December 31, |
|||
|
2018 |
2017 |
||
|
Warranty reimbursement payable |
$ 11,171 |
$ 9,041 |
|
|
Accrued bonus and compensation |
3,040 | 894 | |
|
Accrued equipment purchases leased to others |
27 | 241 | |
|
Other accrued liabilities |
160 | 185 | |
|
Accounts payable |
44 | 147 | |
|
Accrued taxes payable |
152 | 140 | |
|
Accrued interest payable |
10 | 69 | |
|
Total accounts payable and accrued liabilities |
$ 14,604 |
$ 10,717 |
|
Other noncurrent liabilities
Other noncurrent liabilities consist primarily of accrued long-term incentive compensation.
168
Note 5 - Property and Equipment, net
Property and equipment, net consists of the following ($ in thousands):
|
December 31, |
|||
|
2018 |
2017 |
||
|
Equipment leased to others(1) |
$ 1,053,029 |
$ 1,050,035 |
|
|
Equipment, not deployed |
3,520 | 1,593 | |
|
Computer equipment and software |
6,228 | 6,151 | |
|
Leasehold improvements |
292 | 292 | |
|
Furniture and fixtures |
124 | 124 | |
|
Total property and equipment |
1,063,193 | 1,058,195 | |
|
Less accumulated depreciation and amortization |
(456,329) | (396,467) | |
|
Property and equipment, net |
$ 606,864 |
$ 661,728 |
|
(1)At December 31, 2018 and 2017, the approximate carrying value of equipment leased to others was $603,000 and
$659,000, respectively.
Note 6 - Exhibitor Lease Fees
The Company earns lease revenues and other fees through the lease of Digital Systems to the Exhibitors in accordance with the ELAs described in Note 2. The aggregate future minimum lease revenues due under non-cancellable equipment lease agreements that have initial or remaining terms in excess of one year as of December 31, 2018 are as follows ($ in thousands):
|
Year ending December 31, |
|
Amount |
|
| 2019 |
|
|
$ 14,997 |
| 2020 |
|
|
14,997 |
| 2021 |
|
|
14,997 |
| 2022 |
|
|
12,625 |
| 2023 |
|
|
6,521 |
|
Thereafter |
|
|
3,901 |
|
Total |
|
|
$ 68,038 |
Revenues earned under the ELAs for the years ended December 31, 2018, 2017 and 2016 totaled $20,409,000, $20,629,000 and $19,699,000, respectively.
Note 7- Long-term Debt, net
Credit facilities
On May 17, 2013, DCIP, Holdings and Kasima entered into a credit agreement with Barclays Bank PLC as Administrative Agent and a group of lenders which agreed to provide Kasima a $75 million revolving line of credit ("Revolver") and a $680 million term loan ("Term Loan B" and together with the Revolver, the "Credit Facility"). The Term Loan B was fully funded at the closing of the Credit Facility. Proceeds from the Term Loan B were used to repay all amounts under the then outstanding credit facility and to repay fees, transaction costs and other expenses incurred in connection with such repayment and the establishment of the Credit Facility. All costs of Digital Systems exceeding established caps must be funded by capital contributions from the Founding Members.
The Revolver was available, subject to certain conditions, through May 17, 2018, its maturity date, at which time no amounts were outstanding. The maturity date of the Term Loan B is May 17, 2021 (the "Term Loan B Maturity Date"). At December 31, 2017, the Revolver was undrawn. The Term Loan B borrowings bear interest, at the option of Kasima,
169
at either the Adjusted LIBO Rate or the Alternate Base Rate, each as defined in the Credit Facility, plus the defined Applicable Rate, which is 1.50% in the case of borrowings based on the Alternate Base Rate and 2.50% for borrowings based on the Adjusted LIBO Rate. The Term Loan B is further subject to an Adjusted LIBO Rate floor of 0.75%. The commitment fee on undrawn amounts in respect of the Revolver was 0.50% per annum through its maturity date.
The Term Loan B amortizes at 1.25% of its original principal amount per annum, payable in quarterly increments of $8.5 million commencing on September 30, 2014 with the remaining balance, including any unpaid interest and fees, payable on the Term Loan B Maturity Date. Prepayments of the Term Loan B reduce future mandatory amortization payments on a dollar-for-dollar basis. Commencing with the defined Test Date in respect of the fiscal year ended December 31, 2014 and annually on each Test Date thereafter, Kasima will prepay Term Loan B borrowings in an aggregate amount equal to 100% of defined Excess Cash Flow (generally the amount by which Cash Flow from Operations exceeds Consolidated Fixed Charges, each as defined, for the prior fiscal year). Kasima may at any time terminate or permanently reduce commitments under the Credit Facility without premium or penalty in $5 million increments of not less than $20 million.
The "Borrower" under the Credit Facility is Kasima and the Credit Facility is guaranteed by Holdings and each direct or indirect subsidiary of Holdings other than the Borrower. The Credit Facility is secured by a first priority lien on all of the assets of the Company (with certain negotiated exclusions), including contract rights, cash and securities accounts and the Digital Systems on Exhibitors' premises.
Under the Credit Facility, the Borrower is required to maintain compliance with certain financial covenants. Material covenants included an interest coverage ratio, minimum average revenues per deployed screen, capital expenditure limitations and excess cash flow. At December 31, 2018, the Company had excess cash flow of $3.4 million which will be paid in the first quarter of 2019. At December 31, 2018, the Borrower was in compliance with all of its Credit Facility covenants.
On September 27, 2016, the Credit Facility was amended to allow Kasima to make up to $20.0 million in distributions each fiscal year subject to the satisfaction of certain conditions, including having revenue per average screen of no less than $12,475 for the most recently completed four fiscal quarter period prior to any such distribution. As part of the same amendment, the Revolver was reduced from $75.0 million to $35.0 million. Following the effective date of the amendment in 2016, Kasima is making an annual distribution of $20.0 million to its member.
The Company's long-term debt consists of the Term Loan B with balances at December 31, 2018 and 2017 of $70.0 million and $195.0 million, respectively, and interest rates of 5.26% and 4.17%, respectively.
The Company's aggregate maturities of long-term debt are as follows ($ in thousands):
|
Year Ending December 31, |
Amount |
||||
| 2019 |
|
|
$ - |
||
| 2020 |
|
|
- |
||
| 2021 | 70,000 | ||||
|
Total |
|
|
$ 70,000 |
||
Interest expense on long-term debt was $5,327,000, $10,602,000 and $15,472,000, for the years ended December 31, 2018, 2017 and 2016, respectively.
Long-term debt, net consists of the following ($ in thousands):
|
December 31, |
|||
|
2018 |
2017 |
||
|
Long-term debt |
$ 70,000 |
$ 195,000 |
|
|
Deferred financing costs, net |
(263) |
(1,147) |
|
|
Total long-term debt, net |
$ 69,737 |
$ 193,853 |
|
Derivatives
The Interest Rate Swap contracts were entered into for interest expense cost protection from rising variable interest rates and are associated with the Company's Term Loan B which matures on May 17, 2021. Under the Interest Rate Swap
170
contracts, the Company receives current market LIBO Rate interest payments, subject to an interest rate floor for the Term Loan B of 0.75% per annum, and pays a fixed rate of 1.29% calculated on the same notional principal amount (the "Notional Swap Amount") which changes for each fiscal quarter commencing as of the quarter ended June 30, 2013 and terminating on the contract expiration date of December 31, 2019. The Notional Swap Amount for the quarterly period ended December 31, 2018 was $68,127,000 and the then-current market LIBO Rate interest was (1.52%) per annum. The protection afforded by the Interest Rate Swap extends until December 31, 2019 and the Notional Swap Amount decreases quarterly beginning September 30, 2014.
Note 8 - Retirement Plan
The Company maintains a defined contribution plan for eligible employees under Section 401(k) of the Internal Revenue Code. The Company's plan provides for eligible employees to contribute up to 80% of eligible compensation with a Company contribution of 4% of eligible wages. All employees are eligible to participate in the plan upon hire. The Company's contributions to the plan totaled $139,000, $140,000 and $146,000 for the years ended December 31, 2018, 2017 and 2016, respectively.
Note 9 - Commitments
Operating leases
The Company has leased facilities in the states of New Jersey, Colorado and Minnesota. The aggregate future minimum lease payments under non-cancellable operating leases that have initial or remaining terms in excess of one year as of December 31, 2018 are as follows ($ in thousands):
|
Year Ending December 31, |
|
|
Amount |
|
2019 |
|
|
$ 179 |
|
2020 |
|
|
119 |
|
2021 |
|
|
101 |
|
2022 |
|
|
8 |
|
Total |
|
|
$ 407 |
Rent expense for operating leases for the years ended December 31, 2018, 2017 and 2016 totaled $181,000, $201,000 and $168,000, respectively.
Employment agreements
The Company has employment agreements with two of its key executives setting forth key compensation terms (generally annual salary plus a defined bonus) and providing each executive with a severance benefit in the case the executive's employment is terminated without cause or the executive resigns with good reason, each as defined.
Note 10 - Related Party Transactions
At December 31, 2018, all of the Company's Digital Systems are leased to the Exhibitors under the ELAs. For the years ended December 31, 2018, 2017 and 2016, revenues earned from the Exhibitors totaled $20,409,000, $20,629,000 and $19,699,000, respectively. Net accounts receivable due from the Exhibitors totaled $1,092,000 and $1,762,000, at December 31, 2018 and 2017, respectively, and will be settled in cash. Payments under the ELAs are generally due on the fifth day of the month after billing. At times, the Company purchases digital equipment from the Exhibitors at cost subject to caps established in the ELAs. For the years ended December 31, 2018 and 2017, the Company had no liability for reimbursement of equipment purchases due to the Exhibitors. The $11,171,000 warranty reimbursement liability represents a liability to reimburse the Exhibitors for the extended equipment warranty and other replacement costs (as defined in the ELAs) as cash payments that began in 2011 and continues through the DCDA End Date (see Note 2). Warranty reimbursements earned for the years ended December 31, 2018, 2017 and 2016 totaled $41,717,000, $32,680,000 and $23,700,000, respectively. Cash reimbursement payments for the years ended December 31, 2018, 2017
171
and 2016 totaled $39,587,000, $30,280,000 and $21,755,000, respectively, and payables totaled $11,171,000 and $9,041,000 as of December 31, 2018 and 2017, respectively.
In 2018, 2017 and 2016, the Exhibitors terminated their ELAs with respect to an aggregate of 38, 81, and 54 Digital Systems, respectively. Pursuant to the terms of the ELAs, the Exhibitors were required to purchase these Digital Systems from the Company at a defined Termination Amount per Digital System. In 2018, 2017 and 2016, total Termination Amounts paid by the Exhibitors in the aggregate were $305,000, $2,783,000 and $1,657,000, respectively, resulting in a loss on sale to the Company of $1,250,000, $1,252,000 and $1,121,000 in 2018, 2017 and 2016, respectively.
For the years ended December 31, 2018, 2017 and 2016, revenues earned from Fathom Events totaled $3,719,000, $3,004,000 and $2,689,000, respectively, (see Note 1). Accounts receivable due from Fathom Events at December 31, 2018 and 2017 totaled $635,000 and $381,000, respectively.
172
Item 9. Changes in and Disagreements With Accountants on Accounting and Financial Disclosure
Not applicable
Item 9A. Controls and Procedures
|
(a) |
Evaluation of disclosure controls and procedures. |
The Company maintains a set of disclosure controls and procedures designed to ensure that material information required to be disclosed in its filings under the Securities Exchange Act of 1934 is recorded, processed, summarized and reported within the time periods specified in the Securities and Exchange Commission’s rules and forms and that material information is accumulated and communicated to the Company’s management, including its Chief Executive Officer and Chief Financial Officer, as appropriate, to allow timely decisions regarding required disclosure. The Company’s Chief Executive Officer and Chief Financial Officer have evaluated these disclosure controls and procedures as of the end of the period covered by this Annual Report on Form 10-K and have determined that such disclosure controls and procedures were effective.
|
(b) |
Management’s annual report on internal control over financial reporting. |
Management is responsible for establishing and maintaining adequate internal control over financial reporting for the Company as defined in Rule 13a-15(f) of the Exchange Act. With management’s participation, an evaluation of the effectiveness of internal control over financial reporting was conducted as of December 31, 2018, based on the framework and criteria established in Internal Control—Integrated Framework (2013) issued by the Committee of Sponsoring Organizations of the Treadway Commission. Based on this evaluation, management has concluded that the Company’s internal control over financial reporting was effective as of December 31, 2018. The effectiveness of our internal control over financial reporting has been audited by KPMG LLP, an independent registered public accounting firm, as stated in their attestation report in Item 8 of Part II of this Annual Report on Form 10-K.
|
(c) |
Changes in internal control over financial reporting. |
As part of the adoption of ASC Topic 606, the Company implemented changes to its control activities related to revenue recognition to ensure adequate evaluation of its contracts and proper assessment of the impact of the new accounting standard. There were no significant changes in the Company’s internal control over financial reporting due to the adoption of the new standard, and no other changes in its internal control over financial reporting as defined in Exchange Act Rule 13a-15(f) during the year ended December 31, 2018, that has materially affected, or is reasonably likely to materially affect, the Company’s internal control over financial reporting.
None
173
Item 10. Directors, Executive Officers and Corporate Governance
For information with respect to the executive officers of the Company, see “Executive Officers” included as a separate item at the end of Part I, Item 1. of this Report.
All other information called for by this item is hereby incorporated herein by reference to the relevant information under the headings “Proposal 1 - Election of Directors”, “Section 16(A) Beneficial Ownership Reporting Compliance”, and “Corporate Governance” portions of our definitive proxy statement on Schedule 14A in connection with our 2019 Annual Meeting of Stockholders, to be filed within 120 days after December 31, 2018 (the “Proxy Statement”).
Item 11. Executive Compensation.
The information called for by this item is set forth under the headings “Executive Compensation”, “Compensation Committee Report on Executive Compensation”, “Compensation Committee Interlocks and Insider Participation”, “Compensation Policies and Practices as They Relate to Risk Management”, “Director Compensation” and “Compensation Discussion and Analysis” in the Company’s 2019 Proxy Statement to be filed with the SEC within 120 days after December 31, 2018 and is incorporated herein by reference.
Item 12. Security Ownership of Certain Beneficial Owners and Management and Related Stockholder Matters.
The information called for by this item is set forth under the headings “Security Ownership of Certain Beneficial Owners and Management and Related Stockholder Matters” and “Equity Compensation Plan Information” in the Company’s 2019 Proxy Statement to be filed with the SEC within 120 days after December 31, 2018 and is incorporated herein by reference.
Item 13. Certain Relationships and Related Transactions, and Director Independence.
The information called for by this item is set forth under the headings “Certain Relationships and Related Transactions” and “Director Independence” in the Company’s 2019 Proxy Statement to be filed with the SEC within 120 days after December 31, 2018 and is incorporated herein by reference.
Item 14. Principal Accounting Fees and Services
The information called for by this item is set forth under the headings “Principal Accounting Fees and Services” and “Audit Committee Pre-Approval Policy” in the Company’s 2019 Proxy Statement to be filed with the SEC within 120 days after December 31, 2018 and is incorporated herein by reference.
174
Item 15. Exhibits, Financial Statement Schedules
(a)(1)The following financial statements are included in Part II, Item 8.
|
|
|
Page |
|
|
75 | |
|
|
77 | |
|
|
78 | |
|
Consolidated Balance Sheets—December 31, 2018 and December 31, 2017 |
|
79 |
|
|
80 | |
|
|
82 | |
|
|
84 |
(a)(2)Financial Statement Schedules—All schedules have been omitted because the necessary information is included in the Notes to the Consolidated Financial Statements.
|
(b) |
Exhibits |
The Company has attached or incorporated by reference herein certain exhibits as specified below.
175
|
Exhibit |
|
Description |
|
| 2.1 |
|
||
|
|
|
|
|
| 2.2 |
|
||
|
|
|
|
|
| 2.3 |
|
||
|
|
|
|
|
| 2.4 |
|
||
|
|
|
|
|
| 3.1 |
|
||
|
|
|
|
|
| 3.2 |
|
||
|
|
|
|
|
| 3.3 |
|
||
|
|
|
|
|
|
4.1(a) |
|
||
|
|
|
|
|
|
4.1(b) |
|
||
|
|
|
|
|
|
4.1(c) |
|
||
|
|
|
|
|
176
|
Exhibit |
|
Description |
|
|
4.1(d) |
|
||
|
|
|
|
|
|
4.1(e) |
|
||
|
|
|
|
|
| 4.2 |
|
||
|
|
|
|
|
| 4.3 |
|
||
|
|
|
|
|
| 4.4 |
|
||
|
|
|
|
|
| 4.5 |
|
||
|
|
|
|
|
| 4.6 |
|
||
|
|
|
|
|
|
4.6(a) |
|
||
|
|
|
|
|
| 4.7 |
|
||
|
|
|
|
|
177
|
Exhibit |
|
Description |
|
| 4.8 |
|
Form of 6.00% Senior Secured Note due 2023 (included in Exhibit 4.7) |
|
|
|
|
|
|
| 4.9 |
|
||
|
|
|
|
|
| 4.10 |
|
||
|
|
|
|
|
| 4.11 |
|
||
|
|
|
|
|
| 4.12 |
|
||
|
|
|
|
|
| 4.13 |
|
||
|
|
|
|
|
|
***10.1 |
|
||
|
|
|
|
|
|
***10.1(a) |
|
||
|
|
|
|
|
|
***10.2 |
|
||
|
|
|
|
|
178
|
Exhibit |
|
Description |
|
|
***10.2(a) |
|
||
|
|
|
|
|
|
***10.3 |
|
||
|
|
|
|
|
|
***10.4 |
|
||
|
|
|
|
|
| 10.5 |
|
||
|
|
|
|
|
| 10.6 |
|
||
|
|
|
|
|
|
10.6(a) |
|
||
|
|
|
|
|
|
10.6(b) |
|
||
|
|
|
|
|
|
10.6(c) |
|
||
|
|
|
|
|
|
***10.7 |
|
||
179
|
Exhibit |
|
Description |
|
|
|
|
|
|
|
***10.8 |
|
||
|
|
|
|
|
|
***10.9 |
|
||
|
|
|
|
|
|
***10.10 |
|
||
|
|
|
|
|
|
***10.11 |
|
||
|
|
|
|
|
|
***10.12 |
|
||
|
|
|
|
|
|
***10.13 |
|
||
|
|
|
|
|
|
***10.14 |
|
||
|
|
|
|
|
| 10.15 |
|
||
|
|
|
|
|
| 10.16 |
|
||
|
|
|
|
|
|
***10.17 |
|
||
|
|
|
|
|
| 10.18 |
|
||
|
|
|
|
|
180
|
Exhibit |
|
Description |
|
|
|
***10.19 |
Form of Stock Award Agreement (incorporated by reference from Exhibit 10.29 to the Company’s Registration Statement on Form S-1 (File No. 333-190904) filed on November 27, 2013, as amended). |
|
|
|
|
|
|
|
***10.20 |
|
||
|
|
|
|
|
|
***10.20(a) |
|
||
|
|
|
|
|
|
***10.21 |
|
||
|
|
|
|
|
|
***10.22 |
|
||
|
|
|
|
|
|
***10.23 |
|
||
|
|
|
|
|
|
***10.24 |
|
||
|
|
|
|
|
|
***10.25 |
|
||
|
|
|
|
|
|
***10.26 |
|
Form of Restricted and/or Performance Stock Unit Award Notice and Agreement under the AMC Entertainment Holdings, Inc. 2013 Equity Incentive Plan.(incorporated by reference from Exhibit 10.2 to the Company’s Quarterly Report on Form 10-Q (File No. 1-33892) filed on May 8, 2017). |
|
|
|
|
|
|
| 10.27 |
|
||
|
|
|
|
|
| 10.28 |
|
||
181
|
Exhibit |
|
Description |
|
|
|
|
|
|
|
***10.29 |
|
||
|
|
|
|
|
|
***10.30 |
|
||
|
|
|
|
|
|
***10.31 |
|
||
|
|
|
|
|
|
***10.32 |
|
||
|
|
|
|
|
| 10.33 |
|
||
|
|
|
|
|
| 10.34 |
|
||
|
|
|
|
|
| 10.35 |
|
||
|
|
|
|
|
| 10.36 |
|
||
|
|
|
|
|
|
***10.37 |
|
||
|
|
|
|
|
|
*21 |
|
||
|
|
|
|
|
|
*23.1 |
|
Consent of KPMG LLP, Independent Registered Public Accounting Firm. |
|
|
|
|
|
|
182
|
Exhibit |
|
Description |
|
|
*23.2 |
|
Consent of CohnReznick LLP as to Digital Cinema Implementation Partners, LLC’s financial statements. |
|
|
|
|
|
|
|
*31.1 |
|
Certification of Chief Executive Officer pursuant to Section 302 of the Sarbanes-Oxley Acts of 2002. |
|
|
|
|
|
|
|
*31.2 |
|
Certification of Chief Financial Officer pursuant to Section 302 of the Sarbanes-Oxley Acts of 2002. |
|
|
|
|
|
|
|
*32.1 |
|
||
|
|
|
|
|
|
**101.INS |
|
XBRL Instance Document |
|
|
|
|
|
|
|
**101.SCH |
|
XBRL Taxonomy Extension Schema Document |
|
|
|
|
|
|
|
**101.CAL |
|
XBRL Taxonomy Extension Calculation Linkbase Document |
|
|
|
|
|
|
|
**101.DEF |
|
XBRL Taxonomy Extension Definition Linkbase Document |
|
|
|
|
|
|
|
**101.LAB |
|
XBRL Taxonomy Extension Label Linkbase Document |
|
|
|
|
|
|
|
**101.PRE |
|
XBRL Taxonomy Extension Presentation Linkbase Document |
|
183
184
|
(c) |
Separate Financial Statements of Subsidiaries Not Consolidated |
The following financial statements of Digital Cinema Implementation Partners, LLC are as follows:
|
|
|
Page |
|
|
156 | |
|
|
157 | |
|
|
158 | |
|
Consolidated Statements of Members' Equity |
|
159 |
|
Consolidated Statements of Cash Flows |
|
160 |
|
|
162 |
* Filed herewith.
** Submitted electronically with this Report.
*** Management contract, compensatory plan or arrangement.
None.
185
SIGNATURES
Pursuant to the requirements of Section 13 or 15(d) of the Securities Exchange Act of 1934, the registrant has duly caused this report to be signed on its behalf by the undersigned, thereunto duly authorized.
|
|
AMC ENTERTAINMENT HOLDINGS, INC. |
|
|
|
|
|
|
|
By: |
/s/ Chris A. Cox |
|
|
|
Chris A. Cox |
|
|
|
Senior Vice President and Chief Accounting Officer |
|
|
Date: February 28, 2019 |
|
Pursuant to the requirements of the Securities Exchange Act of 1934, this report has been signed below by the following persons on behalf of the registrant and in the capacities and on the dates indicated.
|
/s/ MAOJUN JOHN ZENG |
|
|
|
Maojun (JOHN) Zeng |
Chairman of the Board |
|
|
|
|
February 28, 2019 |
|
/s/ ADAM M. ARON |
Chief Executive Officer, Director and President |
|
|
Adam M. Aron |
(principal executive officer) |
|
|
|
|
February 28, 2019 |
|
/s/ ANTHONY J. SAICH |
|
|
|
Anthony J. Saich |
Director |
|
|
|
|
February 28, 2019 |
|
/s/ LEE E. WITTLINGER |
|
|
|
Lee E. Wittlinger |
Director |
|
|
|
|
February 28, 2019 |
|
/s/ LLOYD HILL |
|
|
|
Lloyd Hill |
Director |
|
|
|
|
February 28, 2019 |
|
/s/ GARY F. LOCKE |
|
|
|
Gary F. Locke |
Director |
|
|
|
|
February 28, 2019 |
|
/s/ KATHLEEN M. PAWLUS |
|
|
|
Kathleen M. Pawlus |
Director |
|
|
|
|
February 28, 2019 |
|
/s/ HOWARD KOCH, JR. |
|
|
|
Howard Koch, Jr. |
Director |
|
|
|
|
February 28, 2019 |
|
/s/ CRAIG R. RAMSEY |
Executive Vice President and Chief Financial |
|
|
Craig R. Ramsey |
Officer (principal financial officer) |
|
|
|
|
February 28, 2019 |
|
/s/ CHRIS A. COX |
Senior Vice President and Chief Accounting |
|
|
Chris A. Cox |
Officer (principal accounting officer) |
|
|
|
|
February 28, 2019 |
186