8-K: Current report filing
Published on July 12, 2016
Exhibit 99.2
Creating the Worlds Biggest and Best Theatre Operator Odeon & UCI: Transaction Overview July 12, 2016
Disclaimer 2 This presentation includes forward-looking statements within the meaning of the safe harbor provisions of the United States Private Securities Litigation Reform Act of 1995. Forward-looking statements may be identified by the use of words such as forecast, plan, estimate, will, would, project, maintain, intend, expect, anticipate, strategy, future, likely, may, should, believe, continue, and other similar expressions that predict or indicate future events or trends or that are not statements of historical matters. Similarly, statements made herein and elsewhere regarding the pending acquisitions of Odeon & UCI and Carmike Cinemas (collectively the targets) are also forward-looking statements, including statements regarding the anticipated closing date of the acquisitions, the source and structure of financing, managements statements about effect of the acquisitions on AMCs future business, operations and financial performance and AMCs ability to successfully integrate the targets into its operations. These forward-looking statements are based on information available at the time the statements are made and/or managements good faith belief as of that time with respect to future events, and are subject to risks, trends, uncertainties and other facts that could cause actual performance or results to differ materially from those expressed in or suggested by the forward-looking statements. These risks, trends, uncertainties and facts include, but are not limited to, risks related to: the parties ability to satisfy closing conditions in the anticipated time frame or at all; obtaining regulatory approval, including the risk that any approval may be on terms, or subject to conditions, that are not anticipated; obtaining the Carmike stockholders approval for the Carmike transaction; the possibility that these acquisitions do not close, including in circumstances in which AMC would be obligated to pay a termination fee or other damages or expenses; related to financing these transactions, including AMCs ability to finance the transactions on acceptable terms and to issue equity at favorable prices; responses of activist stockholders to the transactions; AMCs ability to realize expected benefits and synergies from the acquisitions; AMCs effective implementation, and customer acceptance, of its marketing strategies; disruption from the proposed transactions- making it more difficult to maintain relationships with customers, employees or suppliers; the diversion of management time on transaction-related issues; the negative effects of this announcement or the consummation of the proposed acquisitions- on the market price of AMCs common stock; unexpected costs, charges or expenses relating to the acquisitions; unknown liabilities; litigation and/or regulatory actions related to the proposed transactions; AMCs significant indebtedness, including the indebtedness incurred to acquire the targets; AMCs ability to utilize net operating loss carry-forwards to reduce future tax liability; continued effectiveness of AMCs strategic initiatives; the impact of governmental regulation, including anti-trust investigations concerning potentially anticompetitive conduct, including film clearances and participation in certain joint ventures; operating a business in markets AMC is unfamiliar with; the United Kingdoms exit from the European Union and other business effects, including the effects of industry, market, economic, political or regulatory conditions, future exchange or interest rates, changes in tax laws, regulations, rates and policies; and risks, trends, uncertainties and other facts discussed in the reports AMC has filed with the SEC. Should one or more of these risks, trends, uncertainties or facts materialize, or should underlying assumptions prove incorrect, actual results may vary materially from those indicated or anticipated by the forward-looking statements contained herein. Accordingly, you are cautioned not to place undue reliance on these forward-looking statements, which speak only as of the date they are made. Forward-looking statements should not be read as a guarantee of future performance or results, and will not necessarily be accurate indications of the times at, or by, which such performance or results will be achieved. For a detailed discussion of risks, trends and uncertainties facing AMC, see the section entitled Risk Factors in AMCs Annual Report on Form 10-K, filed with the SEC on March 8, 2016, and the risks, trends and uncertainties identified in their other public filings. AMC does not intend, and undertakes no duty, to update any information contained herein to reflect future events or circumstances, except as required by applicable law.
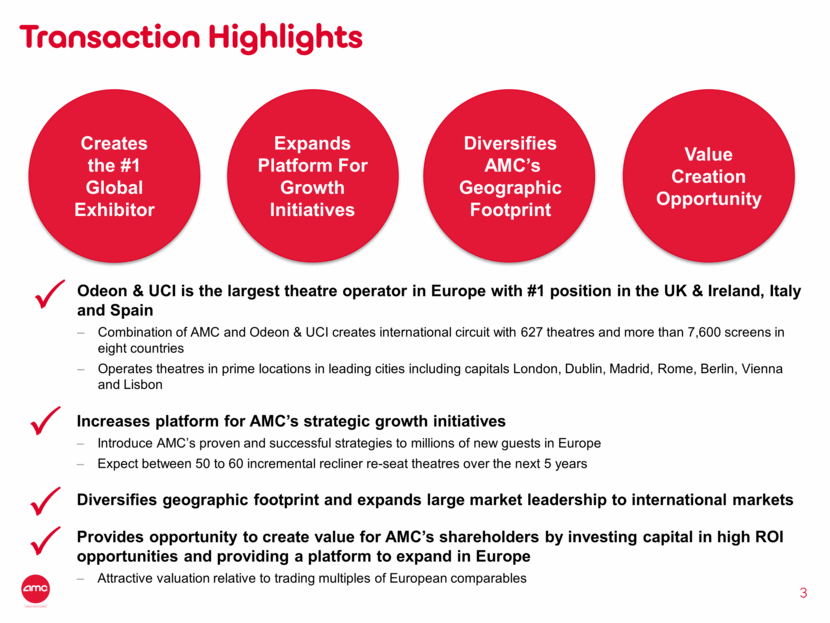
Transaction Highlights Increases platform for AMCs strategic growth initiatives Introduce AMCs proven and successful strategies to millions of new guests in Europe Expect between 50 to 60 incremental recliner re-seat theatres over the next 5 years Creates the #1 Global Exhibitor Expands Platform For Growth Initiatives Diversifies AMCs Geographic Footprint Value Creation Opportunity Provides opportunity to create value for AMCs shareholders by investing capital in high ROI opportunities and providing a platform to expand in Europe Attractive valuation relative to trading multiples of European comparables Odeon & UCI is the largest theatre operator in Europe with #1 position in the UK & Ireland, Italy and Spain Combination of AMC and Odeon & UCI creates international circuit with 627 theatres and more than 7,600 screens in eight countries Operates theatres in prime locations in leading cities including capitals London, Dublin, Madrid, Rome, Berlin, Vienna and Lisbon Diversifies geographic footprint and expands large market leadership to international markets 3
Transaction Overview 4 Key Transaction Terms Transaction Financing 75% in cash / 25% in stock consideration, subject to lock-ups The transaction has fully committed debt financing in place Permanent financing will be a combination of term loans and bonds, targeting leverage in the near term of approximately 4.0x Adjusted EBITDA Transaction does not impact AMCs ability to complete the proposed Carmike transaction Closing Conditions & Timing Antitrust clearance by European Commission and subject to consultation with the European Works Council Expected to close in the fourth quarter of 2016 Transaction valued at approximately £921 million(1) Cash consideration to seller of £375 million Stock consideration to seller of £125 million(2) Assumed net debt of £407 million(3) to be simultaneously refinanced at closing Represents 9.1x Enterprise Value / LTM EBITDA(3) Assuming a Dec 31, 2016 close, transaction valued at $1,199 million(4) Annual cost synergies expected to be approximately $10 million Combined Operating Strategy Odeon & UCI will be headquartered in London and will operate as a subsidiary of AMC Will continue to be led by Paul Donovan, Group CEO, and his management team Maintain existing brand names (Odeon, UCI, and Cinesa) US GAAP Adjustments Purchase accounting and other adjustments to conform Odeon & UCI financial statements to US GAAP Includes currency translation and classification of $195mm(4) of operating leases as capital and financing lease obligations Includes approximately £14 million of employee incentive costs. Number of shares to seller to be set based on a formula prior to the date of closing. Based on Odeon public filings as of March 31, 2016. Based on GBP/USD spot rate of 1.30 as of July 5, 2016.
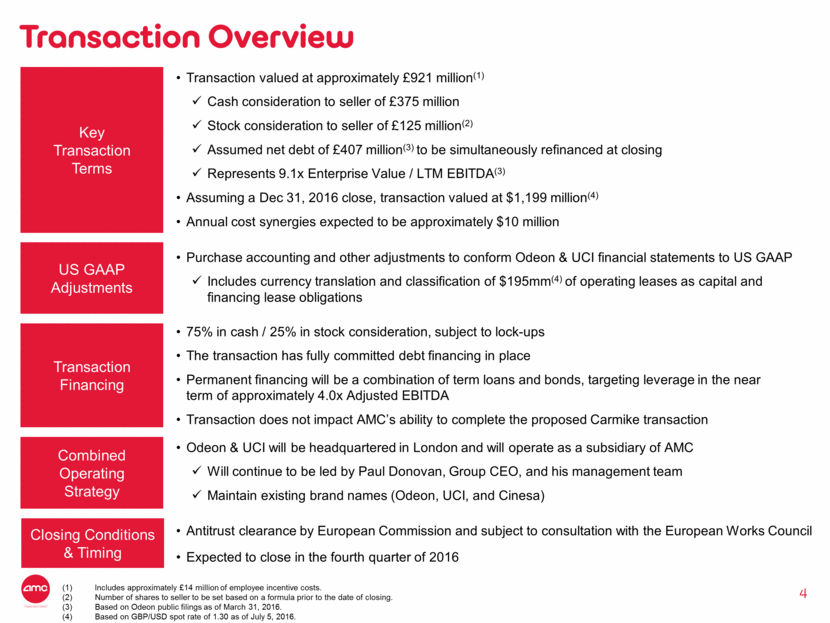
Value Creation Opportunity for AMC Shareholders Transformative transaction with significant growth opportunity Attractive valuation relative to trading multiples of European comparables Transaction structure creates alignment of interest and provides AMC flexibility Expands opportunity for deployment of AMCs proven growth initiatives Leverage Odeon & UCIs innovative marketing, CRM and pricing expertise Expected annual cost synergies of approximately $10 million Expects to maintain quarterly dividend 5 Global Screen Count (1) + Trading Multiples of European Theatre Companies (Firm Value / LTM EBITDA) Note: Market data as of 7/6/2016. Excludes Carmike. Public filings. On UK GAAP basis. Transaction Multiple: 9.1x(2) 1,666 1,753 2,011 2,236 2,565 4,548 5,380 5,840 7,329 7,616 Cineplex Vue Cineworld Odeon Cinemex Cinepolis AMC Cinemark Regal AMC + Odeon 10.5x 13.4x Cineworld Kinepolis
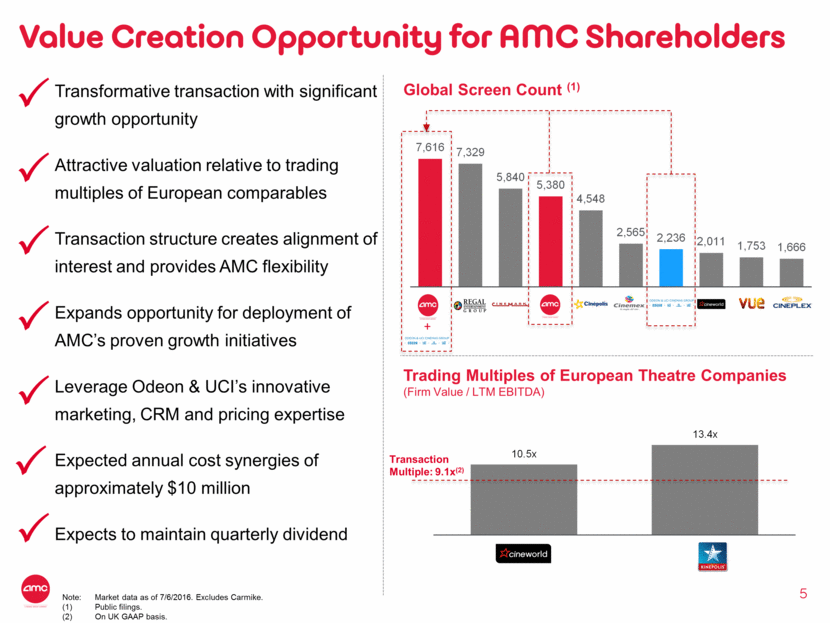
Odeon & UCI - Leading Theatre Operator in Europe 6 Geographic Footprint (March 2016) Leading European theatre operator with 242 theatres and 2,236 screens Largest theatre operator in Europe by number of theatres and screens #1 theatre operator in UK & Ireland, Italy and Spain 120 million people live within 20 minutes of an Odeon & UCI theatre #1 operator in 3 of the 5 largest European markets Operates under three different brands: Odeon (UK, Ireland), UCI (Italy, Germany, Austria, Portugal) and Cinesa (Spain) 108 theatres 866 screens 11 theatres 77 screens 47 theatres 535 screens 3 theatres 45 screens 47 theatres 472 screens 23 theatres 203 screens 3 theatres 38 screens Paid Attendance (in millions) 92 Attendance Market Share 19% Average Ticket Price(1) $8.55 F&B per Patron(1) $3.09 Key Statistics and Financials (LTM March 2016) Revenue (in millions)(1) $1,156 Key European Players 242(2) 218 189 110 46 #1 #1 #1 # Market Position (# of Theatres) Source: Company Filings. Based on LTM March 2016 average GBP/USD FX. As of March 31, 2016. 90 94 81 65 22 Attendance (2015, million) # of Theatres # of Screens (2) 2,236 2,011 1,753 1,051 491 Odeon Cineworld Vue Pathe Kinepolis
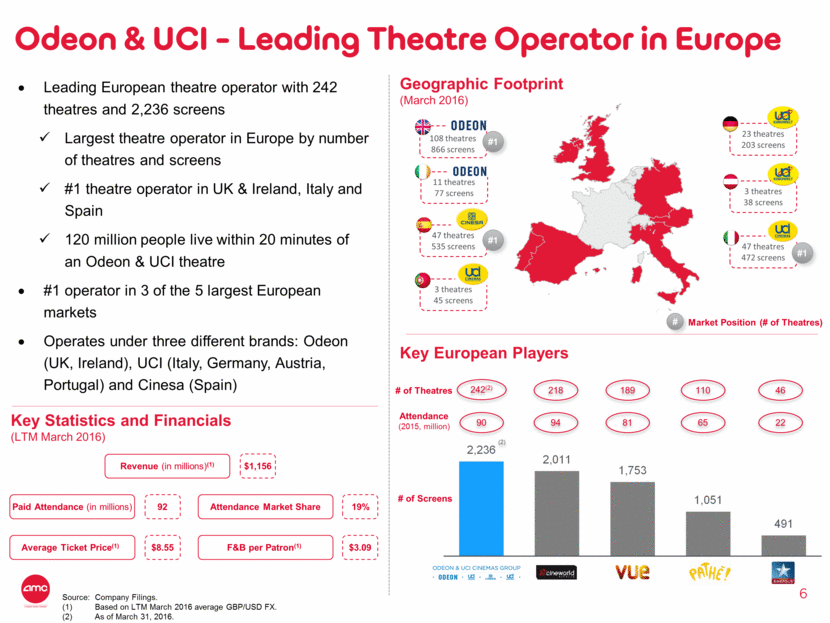
Large Markets with Growing Theatre Attendance 7 Operates in Four of the Five Largest European Markets (2015 Box Office Revenue by Country, $ in millions) European Theatre Attendance Is Growing (Theatre Attendance per Year, in millions) Source: UNIC, Dodona, SNL Kagan. (1.1%) 12 15 CAGR (0.5%) 1.0% 0.6% 2.9% 0.0% 1.2% 2.5% 16E 19E (0.1)% 0.6% 1,615 1,474 1,292 784 633 305 214 205 184 179 151 115 101 83 70 UK France Germany Italy Spain Netherlands Sweden Poland Belgium Denmark Austria Ireland Finland Portugal Greece 70 90 110 130 150 170 2012 2013 2014 2015 2016 2017 2018 2019 Admissions (m)
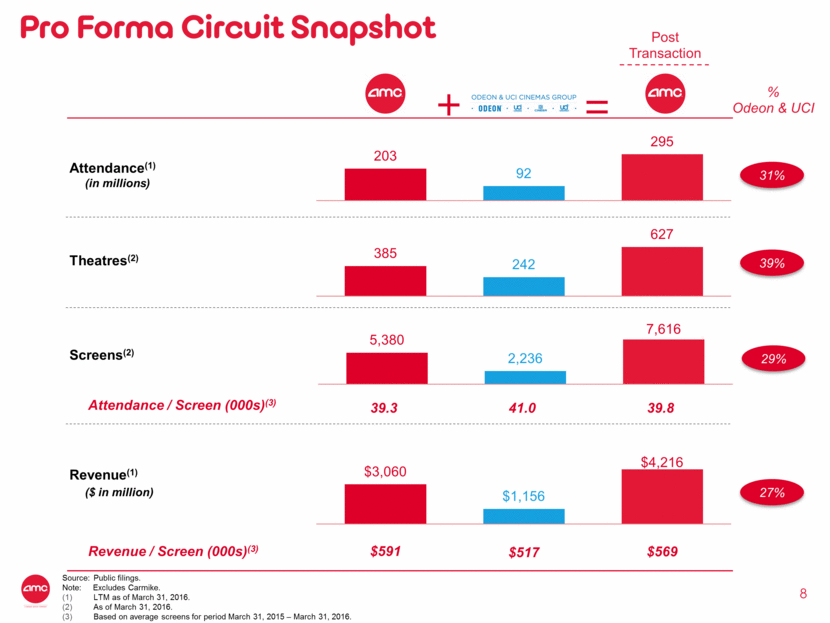
Source: Public filings. Note: Excludes Carmike. LTM as of March 31, 2016. As of March 31, 2016. Based on average screens for period March 31, 2015 March 31, 2016. Post Transaction Pro Forma Circuit Snapshot 8 + = Attendance(1) (in millions) Theatres(2) Screens(2) Revenue(1) ($ in million) 31% 39% 29% 27% % Odeon & UCI Attendance / Screen (000s)(3) Revenue / Screen (000s)(3) $591 $517 $569 203 92 295 AMC Odeon PF AMC 5,380 2,236 7,616 AMC Carmike PF AMC 39.3 41.0 39.8 385 242 627 AMC Odeon PF AMC $3,060 $1,156 $4,216 AMC Odeon PF AMC
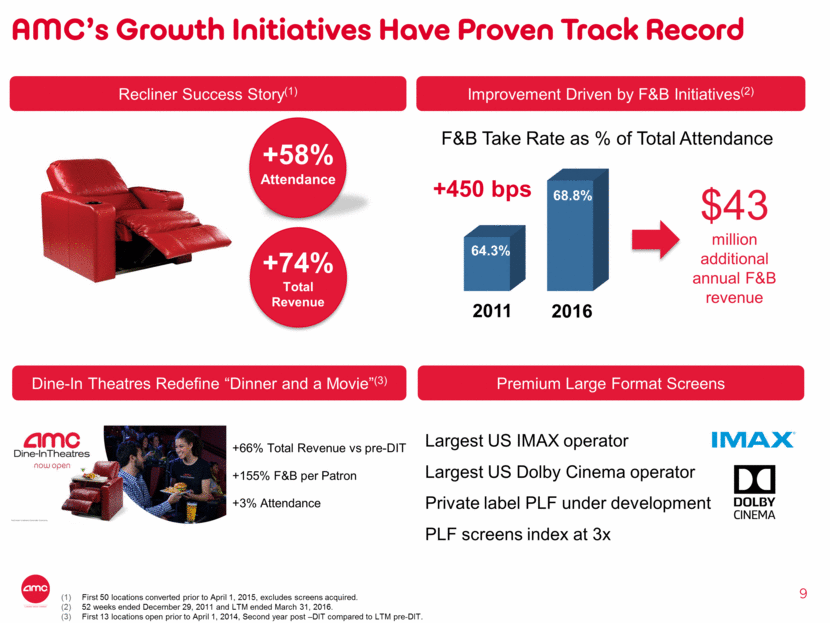
9 AMCs Growth Initiatives Have Proven Track Record Recliner Success Story(1) First 50 locations converted prior to April 1, 2015, excludes screens acquired. 52 weeks ended December 29, 2011 and LTM ended March 31, 2016. First 13 locations open prior to April 1, 2014, Second year post DIT compared to LTM pre-DIT. Improvement Driven by F&B Initiatives(2) Dine-In Theatres Redefine Dinner and a Movie(3) +66% Total Revenue vs pre-DIT +155% F&B per Patron +3% Attendance +58% Attendance +74% Total Revenue F&B Take Rate as % of Total Attendance +450 bps 2011 2016 $43 million additional annual F&B revenue Premium Large Format Screens Largest US IMAX operator Largest US Dolby Cinema operator Private label PLF under development PLF screens index at 3x 64.3% 68.8%
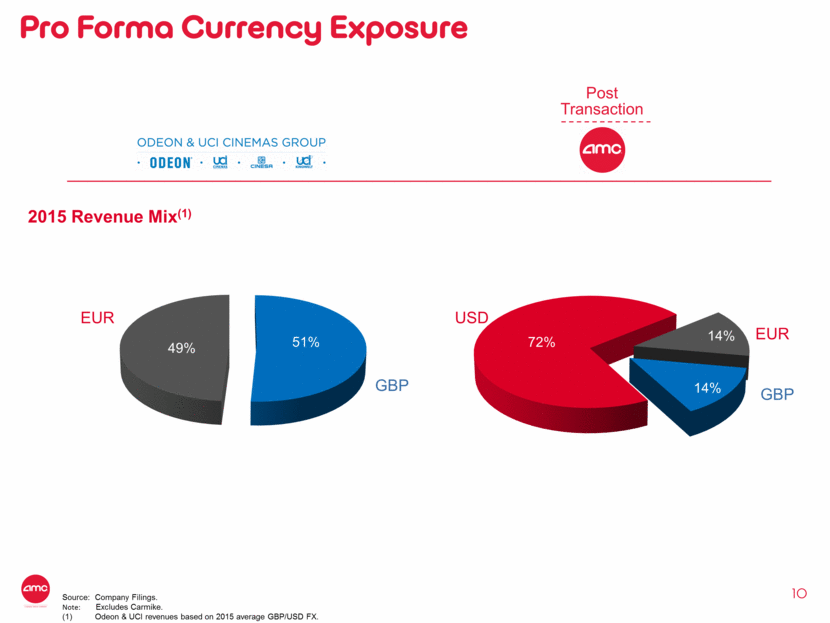
10 Post Transaction GBP EUR 2015 Revenue Mix(1) EUR GBP USD Source: Company Filings. Note: Excludes Carmike. Odeon & UCI revenues based on 2015 average GBP/USD FX. Pro Forma Currency Exposure 51% 49% 14% 72% 14%
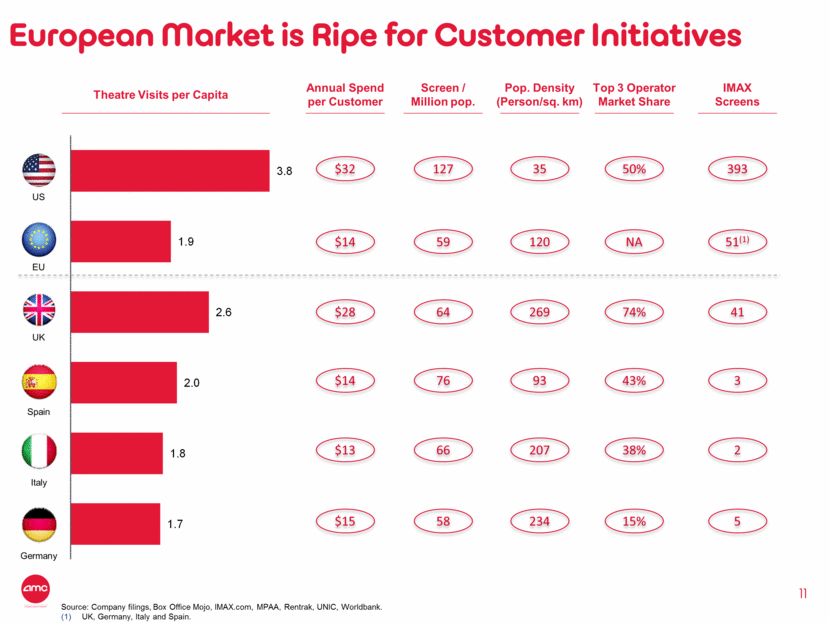
European Market is Ripe for Customer Initiatives Theatre Visits per Capita Annual Spend per Customer $32 $14 $14 $13 $15 Screen / Million pop. 127 76 59 66 58 Pop. Density (Person/sq. km) 35 93 120 207 234 Top 3 Operator Market Share 50% 43% NA 38% 15% Source: Company filings, Box Office Mojo, IMAX.com, MPAA, Rentrak, UNIC, Worldbank. UK, Germany, Italy and Spain. IMAX Screens 393 3 51(1) 2 5 11 $28 64 269 74% 41 UK Spain Italy Germany EU US 3.8 1.9 2.6 2.0 1.8 1.7 U.S. E.U. U.K. Spain Italy Germany
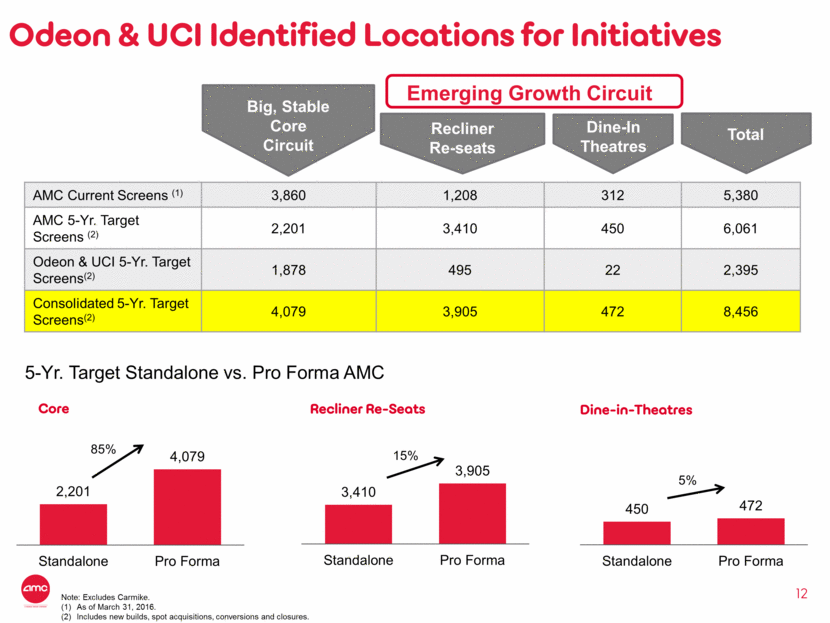
12 AMC Current Screens (1) 3,860 1,208 312 5,380 AMC 5-Yr. Target Screens (2) 2,201 3,410 450 6,061 Odeon & UCI 5-Yr. Target Screens(2) 1,878 495 22 2,395 Consolidated 5-Yr. Target Screens(2) 4,079 3,905 472 8,456 Big, Stable Core Circuit Recliner Re-seats Dine-In Theatres Emerging Growth Circuit Note: Excludes Carmike. As of March 31, 2016. Includes new builds, spot acquisitions, conversions and closures. Odeon & UCI Identified Locations for Initiatives 5-Yr. Target Standalone vs. Pro Forma AMC Core Recliner Re-Seats Dine-in-Theatres 85% 5% 15% Total 450 472 Standalone Pro Forma 2,201 4,079 Standalone Pro Forma 3,410 3,905 Standalone Pro Forma
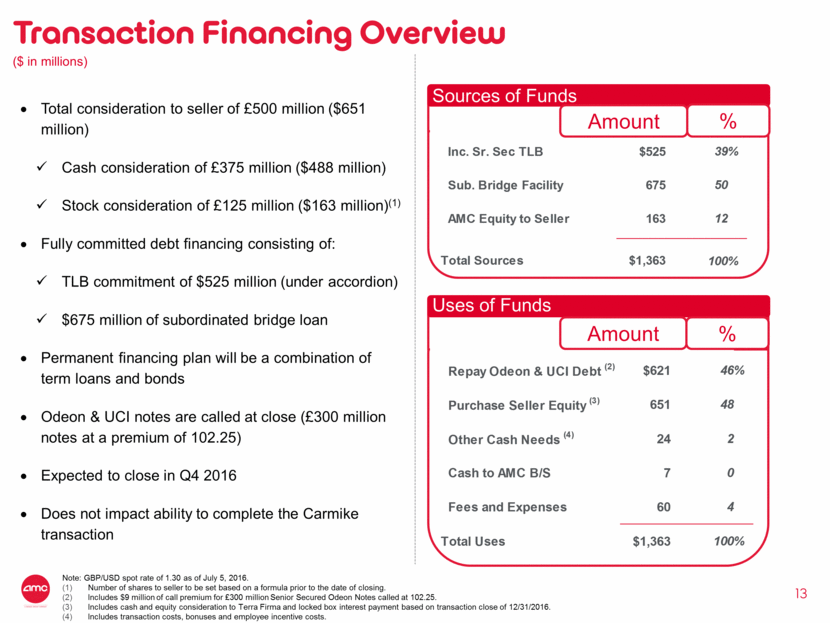
13 Transaction Financing Overview ($ in millions) Total consideration to seller of £500 million ($651 million) Cash consideration of £375 million ($488 million) Stock consideration of £125 million ($163 million)(1) Fully committed debt financing consisting of: TLB commitment of $525 million (under accordion) $675 million of subordinated bridge loan Permanent financing plan will be a combination of term loans and bonds Odeon & UCI notes are called at close (£300 million notes at a premium of 102.25) Expected to close in Q4 2016 Does not impact ability to complete the Carmike transaction Uses of Funds Sources of Funds Amount % Amount % Note: GBP/USD spot rate of 1.30 as of July 5, 2016. Number of shares to seller to be set based on a formula prior to the date of closing. Includes $9 million of call premium for £300 million Senior Secured Odeon Notes called at 102.25. Includes cash and equity consideration to Terra Firma and locked box interest payment based on transaction close of 12/31/2016. Includes transaction costs, bonuses and employee incentive costs. Inc. Sr. Sec TLB $525 39% Sub. Bridge Facility 675 50 AMC Equity to Seller 163 12 Total Sources $1,363 100% Repay Odeon & UCI Debt (2) $621 46% Purchase Seller Equity (3) 651 48 Other Cash Needs (4) 24 2 Cash to AMC B/S 7 0 Fees and Expenses 60 4 Total Uses $1,363 100%
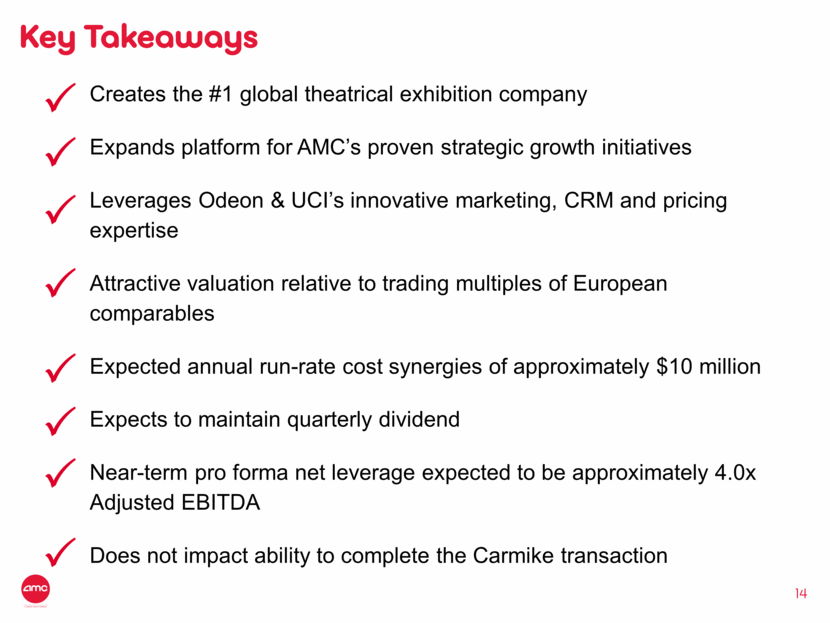
Key Takeaways Creates the #1 global theatrical exhibition company Expands platform for AMCs proven strategic growth initiatives Leverages Odeon & UCIs innovative marketing, CRM and pricing expertise Attractive valuation relative to trading multiples of European comparables Expected annual run-rate cost synergies of approximately $10 million Expects to maintain quarterly dividend Near-term pro forma net leverage expected to be approximately 4.0x Adjusted EBITDA Does not impact ability to complete the Carmike transaction 14
