8-K: Current report filing
Published on April 17, 2019
Exhibit 99.1
|
Investor Day April 17, 2019 |
|
Disclaimer AMC’s consolidated financial statements are prepared and presented in accordance with generally accepted accounting principles ("GAAP"). Certain items contained in this presentation, including Adjusted EBITDA and Adjusted Free Cash Flows, are non-GAAP financial measures and are provided as a supplement and should not be considered an alternative to any GAAP measure of our operating performance, liquidity or profitability. The presentation of these financial measures is not intended to be a substitute for or superior to any financial information prepared and presented in accordance with GAAP. While management believes such non-GAAP measures provide recipients with useful supplemental information, there are material limitations associated with the use of non-GAAP financial measures as an analytical tool, and these measures may be different from non-GAAP financial measures (even those similarly-titled) used by other companies. Such non-GAAP measures are presented here because we believe they are widely used by investors and analysts to measure performance. Our management also uses such measures for their internal analysis. The non-GAAP financial measures included in this presentation should be reviewed in conjunction with AMC’s financial statements and related footnotes contained in documents filed with the SEC. See the Appendix to this presentation for a reconciliation of these non-GAAP financial measures to the nearest comparable GAAP measure. This presentation includes “forward-looking statements”. Forward-looking statements may be identified by the use of words such as “forecast,” “plan,” “estimate,” “will,” “would,” “project,” “maintain,” “intend,” “expect,” “anticipate,” “strategy,” “future,” “likely,” “may,” “should,” “believe,” “continue,” and other similar expressions that predict or indicate future events or trends or that are not statements of historical matters. These forward-looking statements are based on information available at the time the statements are made and/or management’s good faith belief as of that time with respect to future events, and are subject to risks, trends, uncertainties and other facts that could cause actual performance or results to differ materially from those expressed in or suggested by the forward-looking statements. These risks, trends, uncertainties and facts include, but are not limited to, risks related to: motion picture production and performance; AMC's lack of control over distributors of films; intense competition in the geographic areas in which AMC operates; AMC Stubs A-List not meeting anticipated revenue projections impacting projected incremental adjusted EBITDA; increased use of alternative film delivery methods or other forms of entertainment; shrinking exclusive theatrical release windows; general and international economic, political, social and financial market conditions and other risks including the effects of the exit of the United Kingdom from the European Union; risks and uncertainties relating to AMC's significant indebtedness; limitations on the availability of capital; certain covenants in the agreements that govern AMC’s indebtedness may limit its ability to take advantage of certain business opportunities; risks relating to AMC's inability to achieve the expected benefits and performance from its recent acquisitions; AMC's ability to refinance its indebtedness on favorable terms; optimizing AMC's theatre circuit through construction and the transformation of its existing theatres may be subject to delay and unanticipated costs; failures, unavailability or security breaches of AMC's information systems; risks relating to impairment losses and theatre and other closure charges; AMC's ability to utilize net operating loss carryforwards to reduce its future tax liability or valuation allowances taken with respect to deferred tax assets; review by antitrust authorities in connection with acquisition opportunities; risks relating to unexpected costs or unknown liabilities relating to recently completed acquisitions; risks relating to the incurrence of legal liability including costs associated with pending class action lawsuits; dependence on key personnel for current and future performance and our ability to attract and retain senior executives and other key personnel; poor financial results preventing AMC from deploying strategic initiatives; operating a business in unfamiliar international markets; increased costs to comply or resulting from a failure to comply with governmental regulations, including the General Data Protection Regulation (“GDPR”) and pending future domestic privacy laws and regulations; and other risks, trends, uncertainties and other facts discussed in the reports AMC has filed with the SEC. Should one or more of these risks, trends, uncertainties or facts materialize, or should underlying assumptions prove incorrect, actual results may vary materially from those indicated or anticipated by the forward-looking statements contained herein. Accordingly, you are cautioned not to place undue reliance on these forward-looking statements, which speak only as of the date they are made. Forward-looking statements should not be read as a guarantee of future performance or results, and will not necessarily be accurate indications of the times at, or by, which such performance or results will be achieved. For a detailed discussion of risks, trends and uncertainties facing AMC, see the section entitled “Risk Factors” in the documents AMC has filed with the SEC, and the risks, trends and uncertainties identified in their other public filings. AMC does not intend, and undertakes no duty, to update any information contained herein to reflect future events or circumstances, except as required by applicable law. 2 |
|
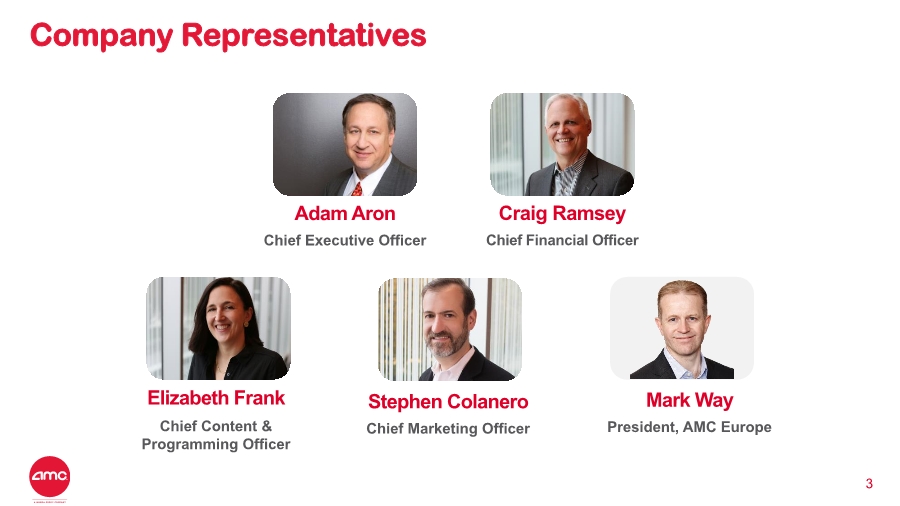
Company Representatives 3 Adam Aron Chief Executive Officer Craig Ramsey Chief Financial Officer Stephen Colanero Chief Marketing Officer Elizabeth Frank Chief Content & Programming Officer Mark Way President, AMC Europe |
|
Agenda 4 1 Executive Summary 3 Investment Highlights 4 Financial Outlook 2 Business Overview |
|
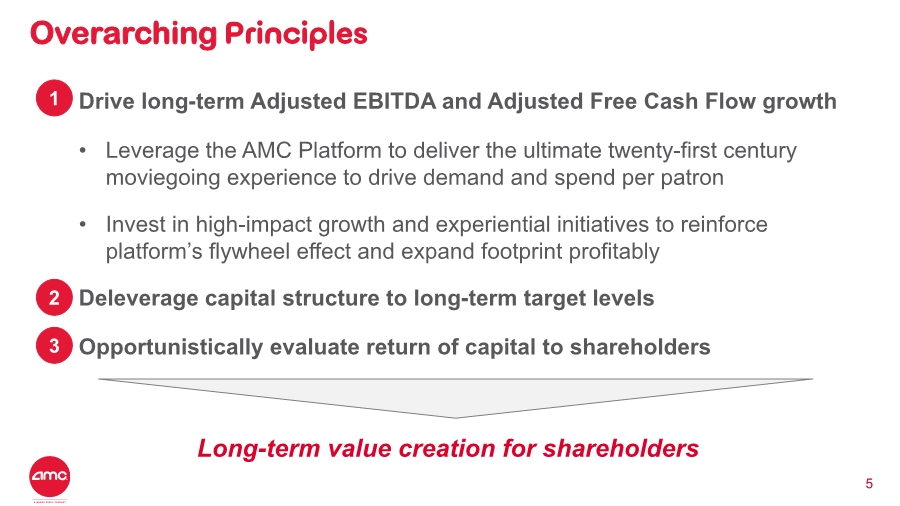
Overarching Principles 5 1. Drive long-term Adjusted EBITDA and Adjusted Free Cash Flow growth • Leverage the AMC Platform to deliver the ultimate twenty-first century moviegoing experience to drive demand and spend per patron • Invest in high-impact growth and experiential initiatives to reinforce platform’s flywheel effect and expand footprint profitably 2. Deleverage capital structure to long-term target levels 3. Opportunistically evaluate return of capital to shareholders Long-term value creation for shareholders 1 2 3 |
|
1. Executive Summary 6 |

|
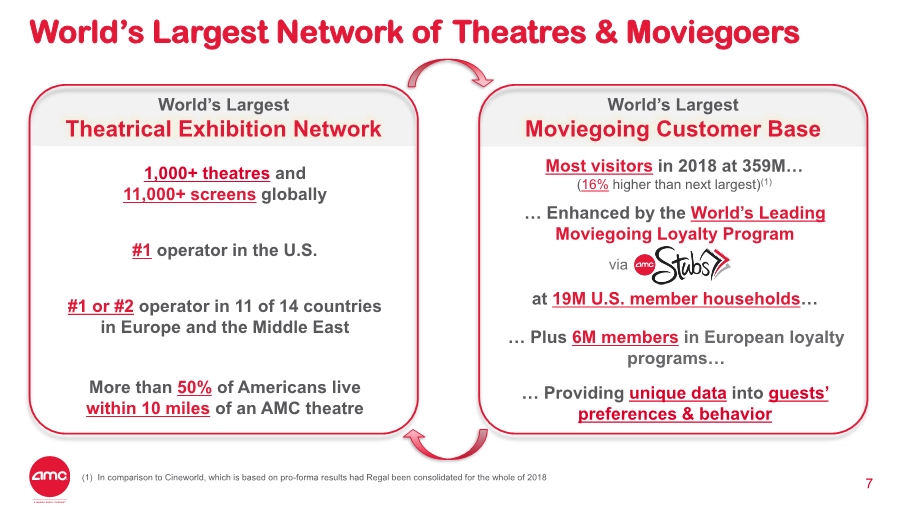
World’s Largest Network of Theatres & Moviegoers 7 World’s Largest Moviegoing Customer Base World’s Largest Theatrical Exhibition Network … Enhanced by the World’s Leading Moviegoing Loyalty Program 1,000+ theatres and 11,000+ screens globally Most visitors in 2018 at 359M… (16% higher than next largest)(1) at 19M U.S. member households… More than 50% of Americans live within 10 miles of an AMC theatre #1 operator in the U.S. #1 or #2 operator in 11 of 14 countries in Europe and the Middle East … Providing unique data into guests’ preferences & behavior via … Plus 6M members in European loyalty programs… (1) In comparison to Cineworld, which is based on pro-forma results had Regal been consolidated for the whole of 2018 |
|
The AMC Platform: Moviegoing Experience for 21st Century8 Unparalleled viewing experience with state-of-the-art screen & sound Order industry-leading, diverse food & beverage via mobile app Relax with reserved seating Enjoy comfort of luxury recliner Engagement with app post-show and receive data-driven recommendations Targeted Demand Generation Attendance Growth Amazing End-to-End Experience Personalized Data Seamlessly browse & book ticket via mobile app under Stubs A-List Personalized push notification to Stubs member on Friday to book showing |

|
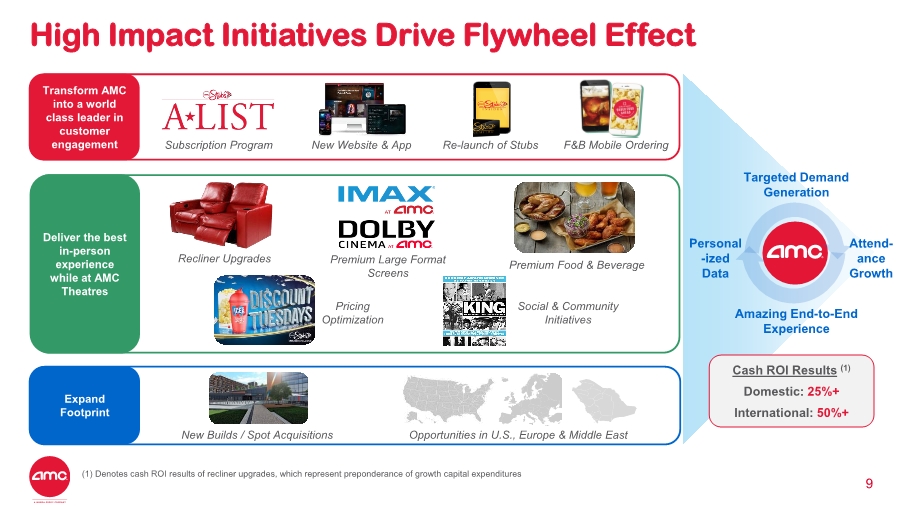
High Impact Initiatives Drive Flywheel Effect 9 Transform AMC into a world class leader in customer engagement New Website & AppSubscription Program Re-launch of Stubs Deliver the best in-person experience while at AMC Theatres Expand Footprint F&B Mobile Ordering New Builds / Spot Acquisitions Opportunities in U.S., Europe & Middle East Recliner Upgrades Premium Large Format Screens Premium Food & Beverage Pricing Optimization Social & Community Initiatives Amazing End-to-End Experience Personal -ized Data Targeted Demand Generation Attend- ance Growth Cash ROI Results (1) Domestic: 25%+ International: 50%+ (1) Denotes cash ROI results of recliner upgrades, which represent preponderance of growth capital expenditures |
|
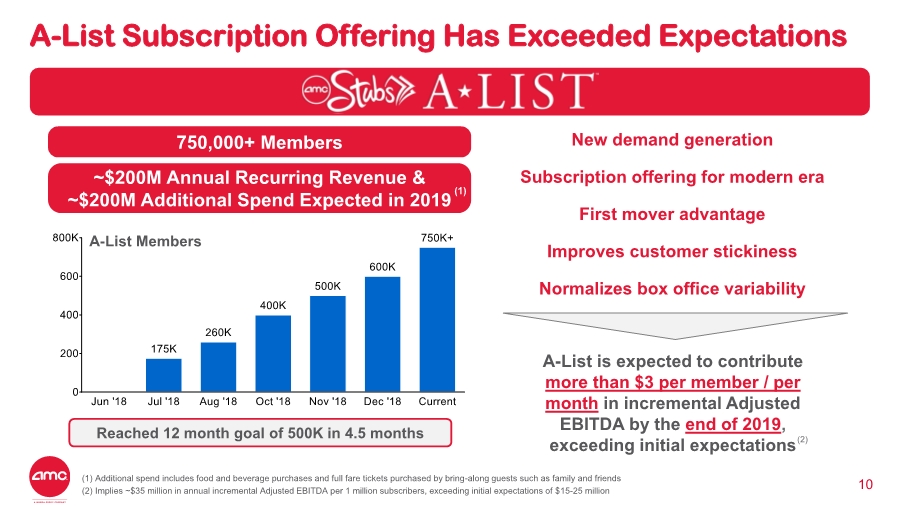
A-List Subscription Offering Has Exceeded Expectations New demand generation Subscription offering for modern era First mover advantage Improves customer stickiness Normalizes box office variability 10 750,000+ Members ~$200M Annual Recurring Revenue & ~$200M Additional Spend Expected in 2019 Reached 12 month goal of 500K in 4.5 months (1) A-List is expected to contribute more than $3 per member / per month in incremental Adjusted EBITDA by the end of 2019, exceeding initial expectations A-List Members (1) Additional spend includes food and beverage purchases and full fare tickets purchased by bring-along guests such as family and friends (2) Implies ~$35 million in annual incremental Adjusted EBITDA per 1 million subscribers, exceeding initial expectations of $15-25 million (2) |
|
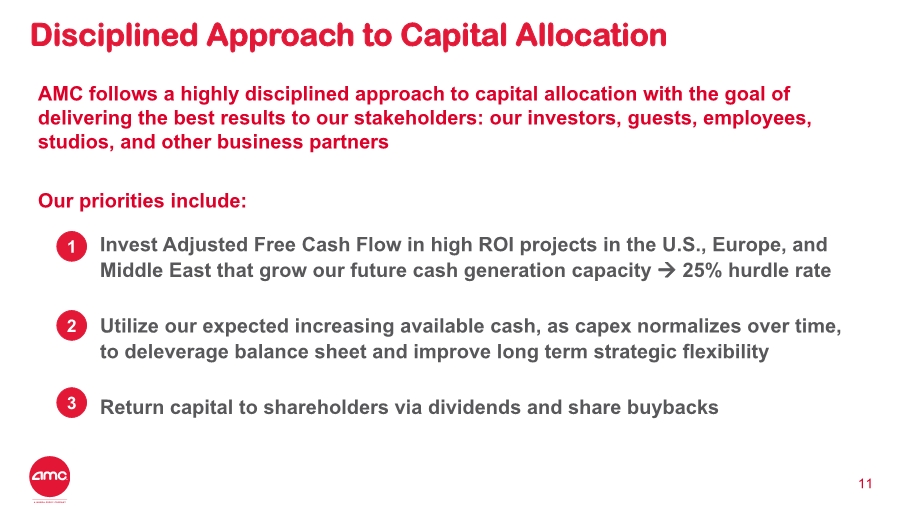
Disciplined Approach to Capital Allocation 11 AMC follows a highly disciplined approach to capital allocation with the goal of delivering the best results to our stakeholders: our investors, guests, employees, studios, and other business partners Our priorities include: – Invest Adjusted Free Cash Flow in high ROI projects in the U.S., Europe, and Middle East that grow our future cash generation capacity → 25% hurdle rate – Utilize our expected increasing available cash, as capex normalizes over time, to deleverage balance sheet and improve long term strategic flexibility – Return capital to shareholders via dividends and share buybacks 1 2 3 |
|
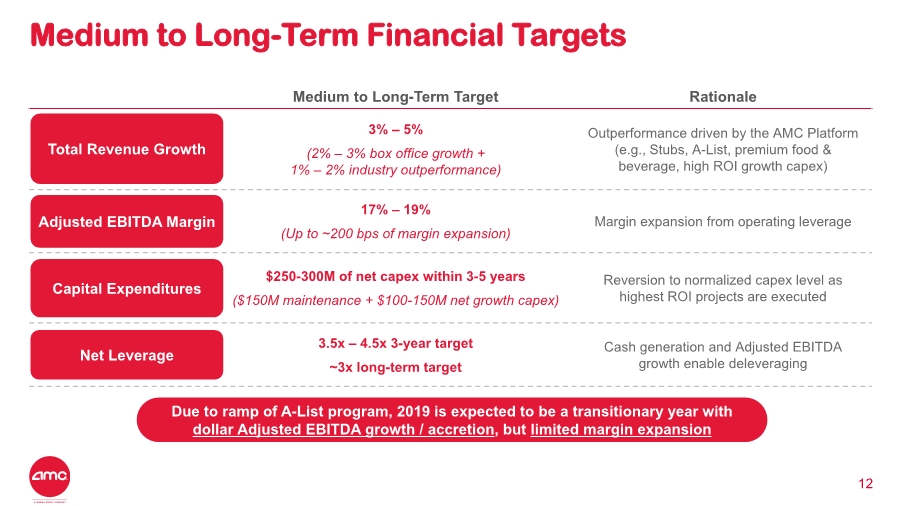
12 Medium to Long-Term Target Rationale 3% – 5% (2% – 3% box office growth + 1% – 2% industry outperformance) Outperformance driven by the AMC Platform (e.g., Stubs, A-List, premium food & beverage, high ROI growth capex) 17% – 19% (Up to ~200 bps of margin expansion) Margin expansion from operating leverage $250-300M of net capex within 3-5 years ($150M maintenance + $100-150M net growth capex) Reversion to normalized capex level as highest ROI projects are executed 3.5x – 4.5x 3-year target ~3x long-term target Cash generation and Adjusted EBITDA growth enable deleveraging Total Revenue Growth Adjusted EBITDA Margin Capital Expenditures Net Leverage Due to ramp of A-List program, 2019 is expected to be a transitionary year with dollar Adjusted EBITDA growth / accretion, but limited margin expansion Medium to Long-Term Financial Targets |
|
2. Business Overview 13 |

|
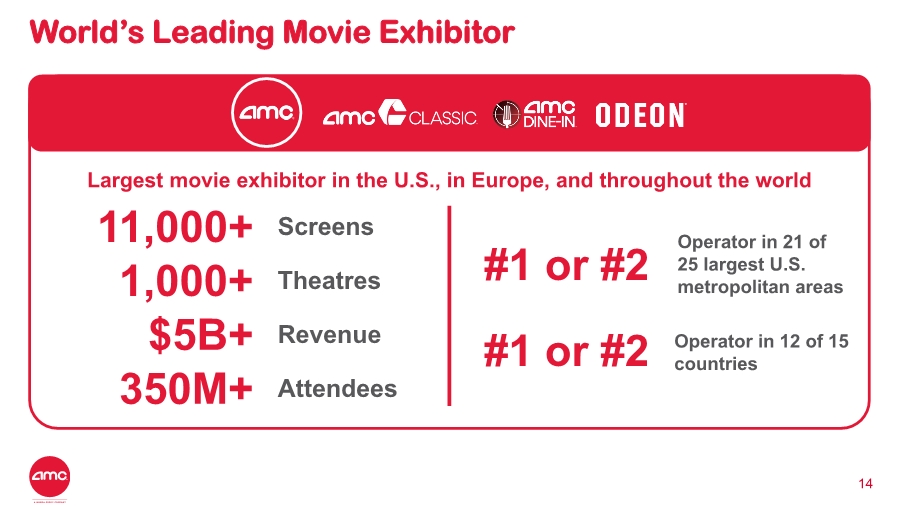
World’s Leading Movie Exhibitor 14 Largest movie exhibitor in the U.S., in Europe, and throughout the world #1 or #2 #1 or #2 Operator in 21 of 25 largest U.S. metropolitan areas Operator in 12 of 15 countries 11,000+ 1,000+ Screens Theatres $5B+ Revenue 350M+ Attendees |
|
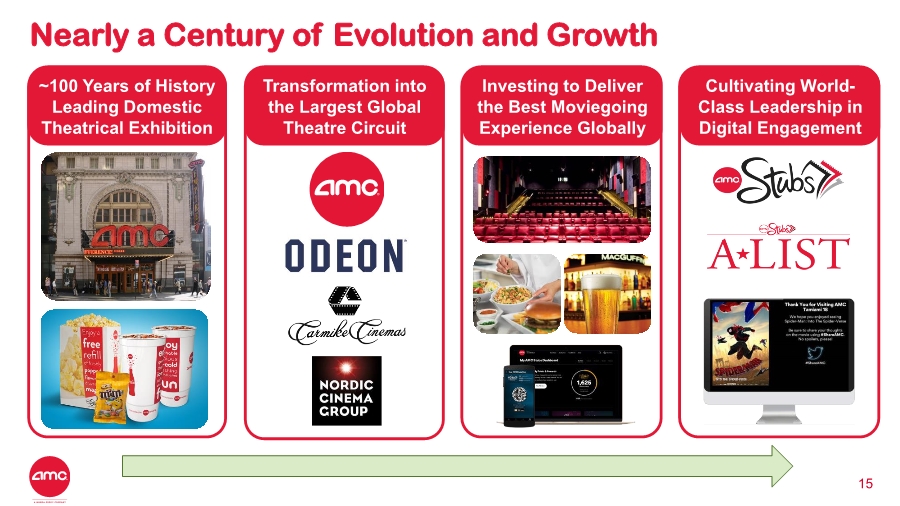
Nearly a Century of Evolution and Growth 15 Transformation into the Largest Global Theatre Circuit Investing to Deliver the Best Moviegoing Experience Globally ~100 Years of History Leading Domestic Theatrical Exhibition Cultivating World- Class Leadership in Digital Engagement |
|
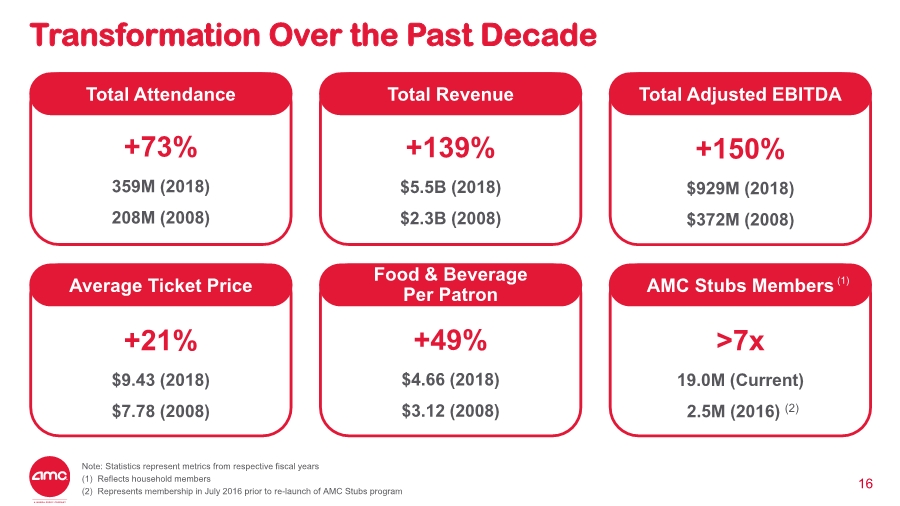
Transformation Over the Past Decade 16 >7x 19.0M (Current) 2.5M (2016) (2) +21% $9.43 (2018) $7.78 (2008) +150% $929M (2018) $372M (2008) +139% $5.5B (2018) $2.3B (2008) +73% 359M (2018) 208M (2008) Total Attendance Total Revenue Total Adjusted EBITDA +49% $4.66 (2018) $3.12 (2008) Average Ticket Price Food & Beverage Per Patron AMC Stubs Members Note: Statistics represent metrics from respective fiscal years (1) Reflects household members (2) Represents membership in July 2016 prior to re-launch of AMC Stubs program (1) |
|
3. Investment Highlights 17 |
|
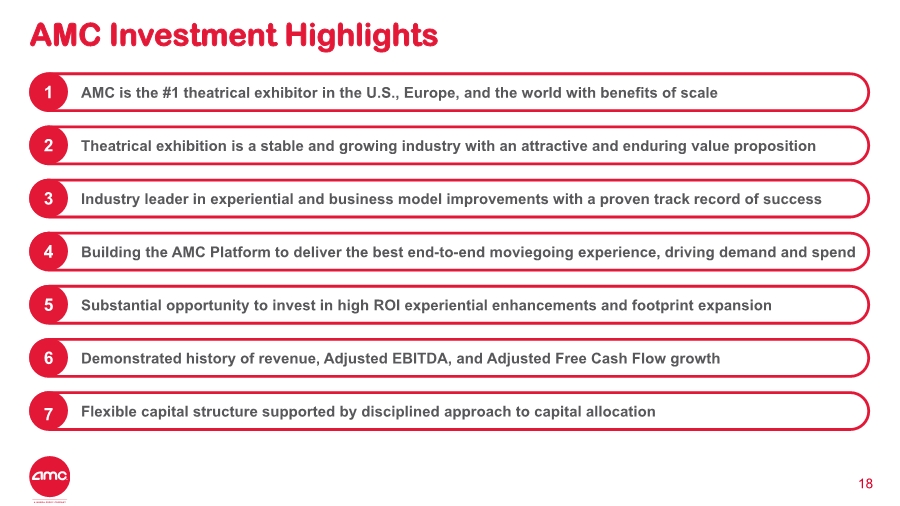
AMC Investment Highlights 18 Substantial opportunity to invest in high ROI experiential enhancements and footprint expansion5 Demonstrated history of revenue, Adjusted EBITDA, and Adjusted Free Cash Flow growth6 Flexible capital structure supported by disciplined approach to capital allocation7 AMC is the #1 theatrical exhibitor in the U.S., Europe, and the world with benefits of scale1 Theatrical exhibition is a stable and growing industry with an attractive and enduring value proposition2 Industry leader in experiential and business model improvements with a proven track record of success3 4 Building the AMC Platform to deliver the best end-to-end moviegoing experience, driving demand and spend |
|
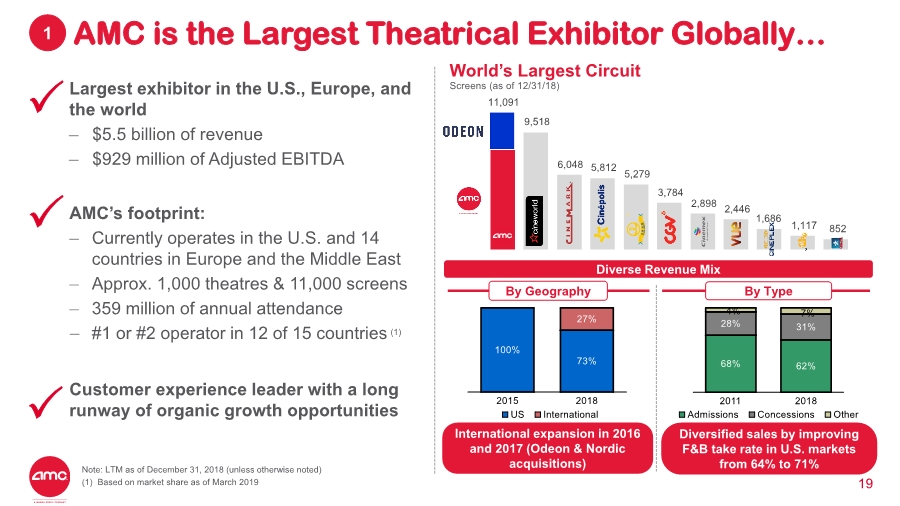
Largest exhibitor in the U.S., Europe, and the world – $5.5 billion of revenue – $929 million of Adjusted EBITDA AMC’s footprint: – Currently operates in the U.S. and 14 countries in Europe and the Middle East – Approx. 1,000 theatres & 11,000 screens – 359 million of annual attendance –#1 or #2 operator in 12 of 15 countries (1) Customer experience leader with a long runway of organic growth opportunities World’s Largest Circuit Screens (as of 12/31/18) AMC is the Largest Theatrical Exhibitor Globally… 19 1 Diverse Revenue Mix By TypeBy Geography 4% International expansion in 2016 and 2017 (Odeon & Nordic acquisitions) Diversified sales by improving F&B take rate in U.S. markets from 64% to 71%Note: LTM as of December 31, 2018 (unless otherwise noted) (1) Based on market share as of March 2019 11,091 9,518 6,048 5,812 5,279 3,784 2,898 2,446 1,686 1,117 852 |
|
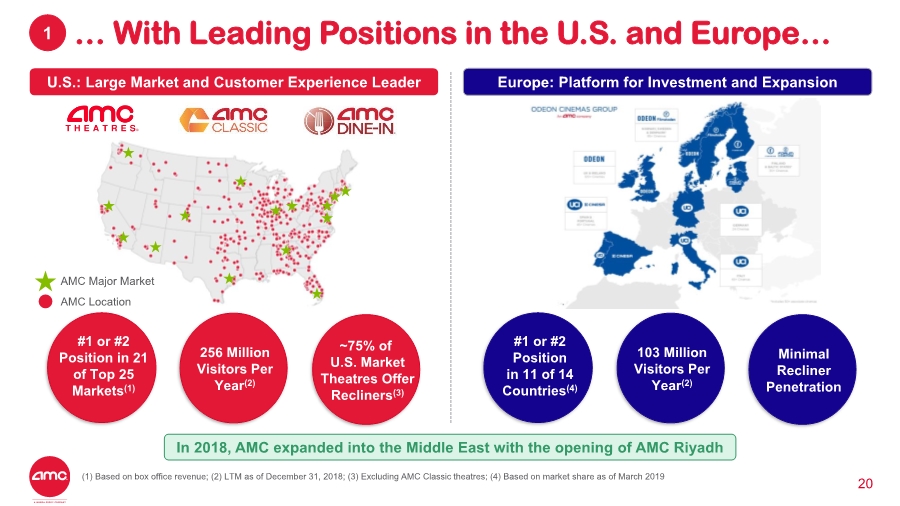
… With Leading Positions in the U.S. and Europe… 20 Europe: Platform for Investment and ExpansionU.S.: Large Market and Customer Experience Leader In 2018, AMC expanded into the Middle East with the opening of AMC Riyadh 1 AMC Location AMC Major Market #1 or #2 Position in 21 of Top 25 Markets(1) 256 Million Visitors Per Year(2) ~75% of U.S. Market Theatres Offer Recliners(3) #1 or #2 Position in 11 of 14 Countries(4) 103 Million Visitors Per Year(2) Minimal Recliner Penetration (1) Based on box office revenue; (2) LTM as of December 31, 2018; (3) Excluding AMC Classic theatres; (4) Based on market share as of March 2019 |
|
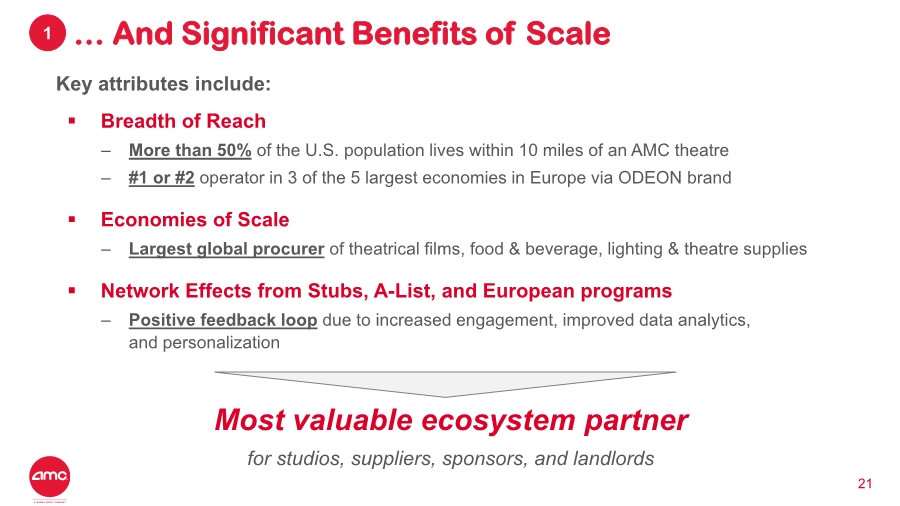
… And Significant Benefits of Scale 21 Key attributes include: ▪ Breadth of Reach – More than 50% of the U.S. population lives within 10 miles of an AMC theatre –#1 or #2 operator in 3 of the 5 largest economies in Europe via ODEON brand ▪ Economies of Scale – Largest global procurer of theatrical films, food & beverage, lighting & theatre supplies ▪ Network Effects from Stubs, A-List, and European programs – Positive feedback loop due to increased engagement, improved data analytics, and personalization Most valuable ecosystem partner for studios, suppliers, sponsors, and landlords 1 |
|
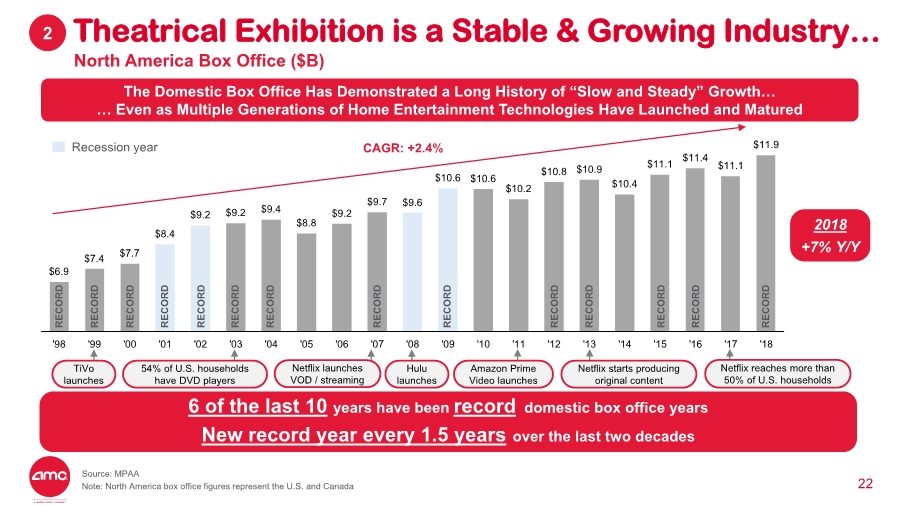
$6.9 $7.4 $7.7 $8.4 $9.2 $9.2 $9.4 $8.8 $9.2 $9.7 $9.6 $10.6 $10.6 $10.2 $10.8 $10.9 $10.4 $11.1 $11.4 $11.1 $11.9 '98 '99 '00 '01 '02 '03 '04 '05 '06 '07 '08 '09 '10 '11 '12 '13 '14 '15 '16 '17 '18 Theatrical Exhibition is a Stable & Growing Industry… 22 North America Box Office ($B) The Domestic Box Office Has Demonstrated a Long History of “Slow and Steady” Growth… … Even as Multiple Generations of Home Entertainment Technologies Have Launched and Matured 6 of the last 10 years have been record domestic box office years New record year every 1.5 years over the last two decades 2018 +7% Y/Y Netflix launches VOD / streaming Hulu launches Amazon Prime Video launches Netflix starts producing original content TiVo launches Netflix reaches more than 50% of U.S. households 54% of U.S. households have DVD players Source: MPAA Note: North America box office figures represent the U.S. and Canada 2 CAGR: +2.4%Recession year RECORD RECORD RECORD RECORD RECORD RECORD RECORD RECORD RECORD RECORD RECORD RECORD RECORD RECORD |
|
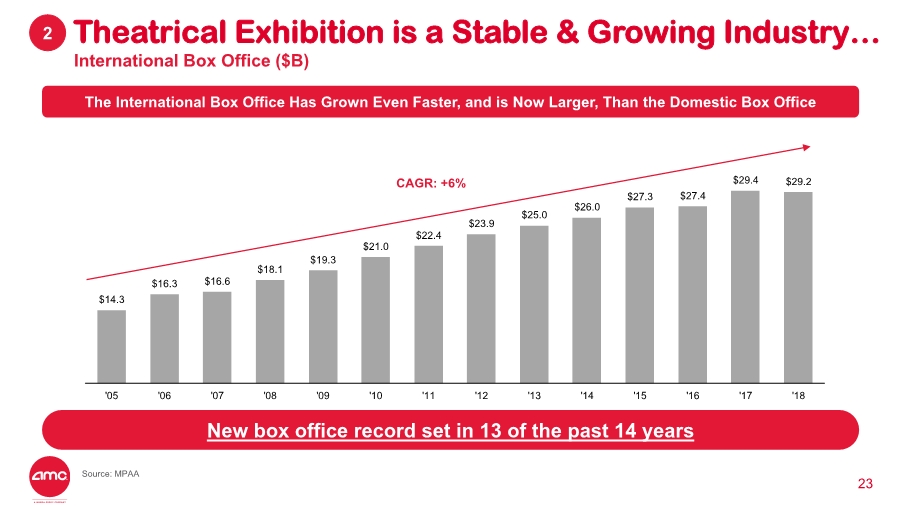
Theatrical Exhibition is a Stable & Growing Industry… 23 New box office record set in 13 of the past 14 years $14.3 $16.3 $16.6 $18.1 $19.3 $21.0 $22.4 $23.9 $25.0 $26.0 $27.3 $27.4 $29.4 $29.2 '05 '06 '07 '08 '09 '10 '11 '12 '13 '14 '15 '16 '17 '18 CAGR: +6% The International Box Office Has Grown Even Faster, and is Now Larger, Than the Domestic Box Office 2 Source: MPAA International Box Office ($B) |
|
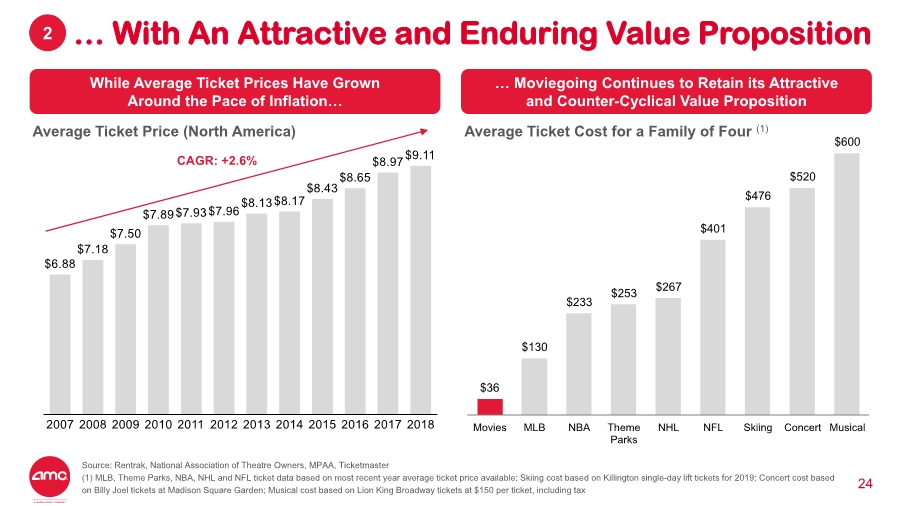
… With An Attractive and Enduring Value Proposition 24 $36 $130 $233 $253 $267 $401 $476 $520 $600 Movies MLB NBA Theme Parks NHL NFL Skiing Concert Musical … Moviegoing Continues to Retain its Attractive and Counter-Cyclical Value Proposition Average Ticket Cost for a Family of Four (1) While Average Ticket Prices Have Grown Around the Pace of Inflation… CAGR: +2.6% Average Ticket Price (North America) 2 Source: Rentrak, National Association of Theatre Owners, MPAA, Ticketmaster (1) MLB, Theme Parks, NBA, NHL and NFL ticket data based on most recent year average ticket price available; Skiing cost based on Killington single-day lift tickets for 2019; Concert cost based on Billy Joel tickets at Madison Square Garden; Musical cost based on Lion King Broadway tickets at $150 per ticket, including tax |
|
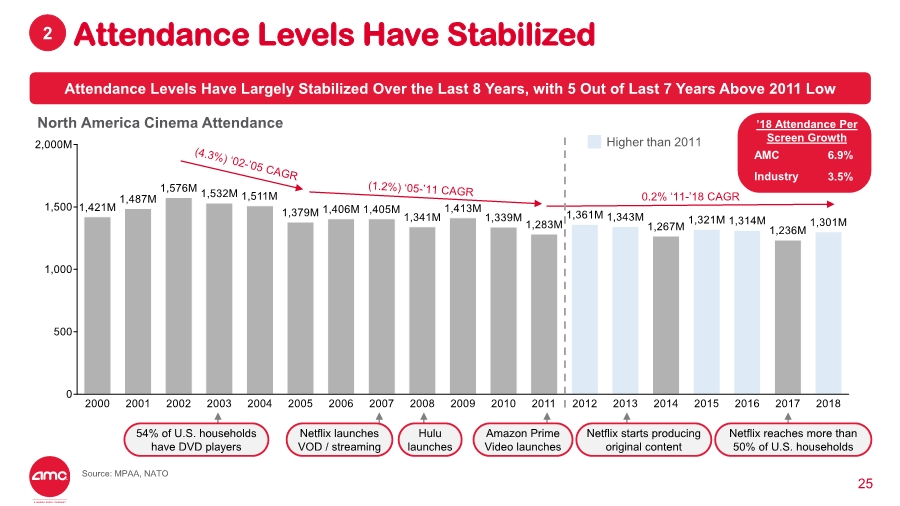
Attendance Levels Have Stabilized 25 Attendance Levels Have Largely Stabilized Over the Last 8 Years, with 5 Out of Last 7 Years Above 2011 Low North America Cinema Attendance 0.2% ‘11-’18 CAGR Netflix launches VOD / streaming Hulu launches Amazon Prime Video launches Netflix starts producing original content Netflix reaches more than 50% of U.S. households 54% of U.S. households have DVD players Higher than 2011 ’18 Attendance Per Screen Growth AMC Industry 6.9% 3.5% 2 Source: MPAA, NATO |
|
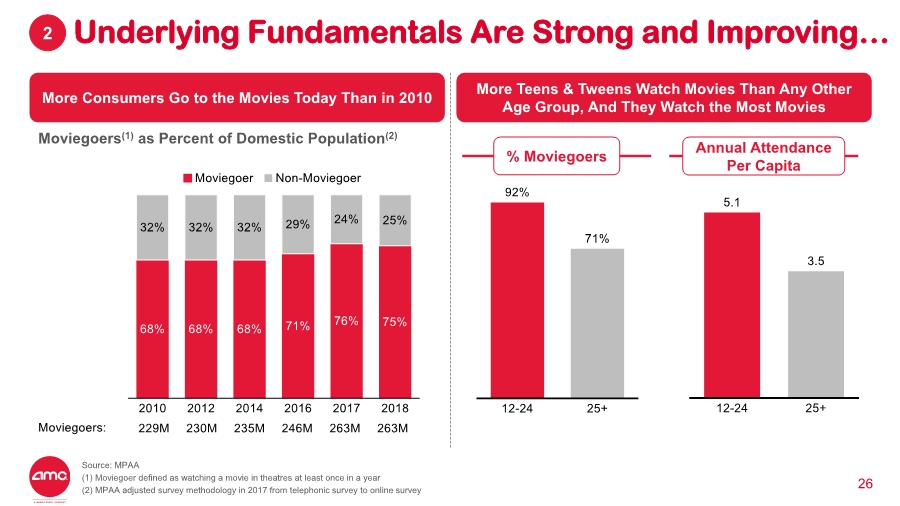
Underlying Fundamentals Are Strong and Improving… 26 More Consumers Go to the Movies Today Than in 2010 More Teens & Tweens Watch Movies Than Any Other Age Group, And They Watch the Most Movies Annual Attendance Per Capita% Moviegoers Moviegoers(1) as Percent of Domestic Population(2) 2 Source: MPAA (1) Moviegoer defined as watching a movie in theatres at least once in a year (2) MPAA adjusted survey methodology in 2017 from telephonic survey to online survey |
|
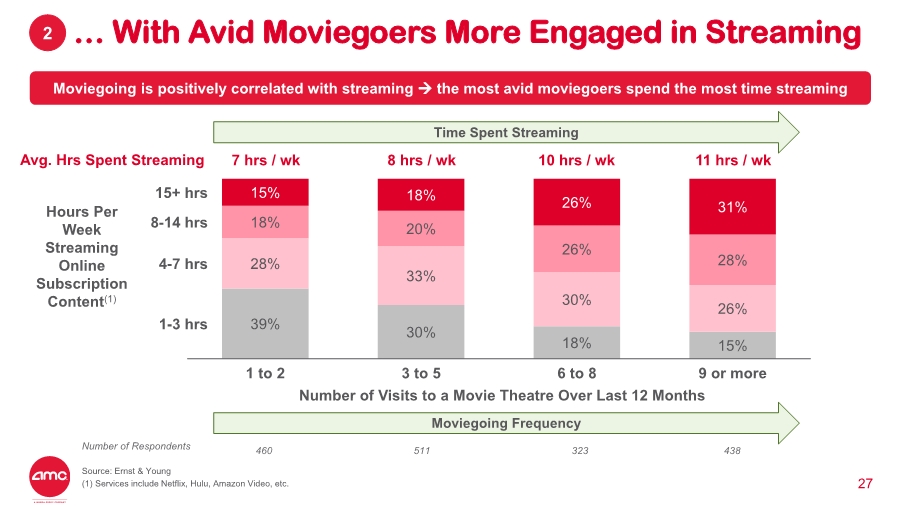
… With Avid Moviegoers More Engaged in Streaming 27 Moviegoing is positively correlated with streaming → the most avid moviegoers spend the most time streaming Number of Visits to a Movie Theatre Over Last 12 Months Hours Per Week Streaming Online Subscription Content(1) Avg. Hrs Spent Streaming 7 hrs / wk 8 hrs / wk 10 hrs / wk 11 hrs / wk Number of Respondents 460 511 323 438 Moviegoing Frequency Time Spent Streaming 2 Source: Ernst & Young (1) Services include Netflix, Hulu, Amazon Video, etc. 39% 30% 18% 15% 28% 33% 30% 26% 18% 20% 26% 28% 15% 18% 26% 31% 8-14 hrs 3 to 5 15+ hrs 1 to 2 6 to 8 4-7 hrs 9 or more 1-3 hrs |
|
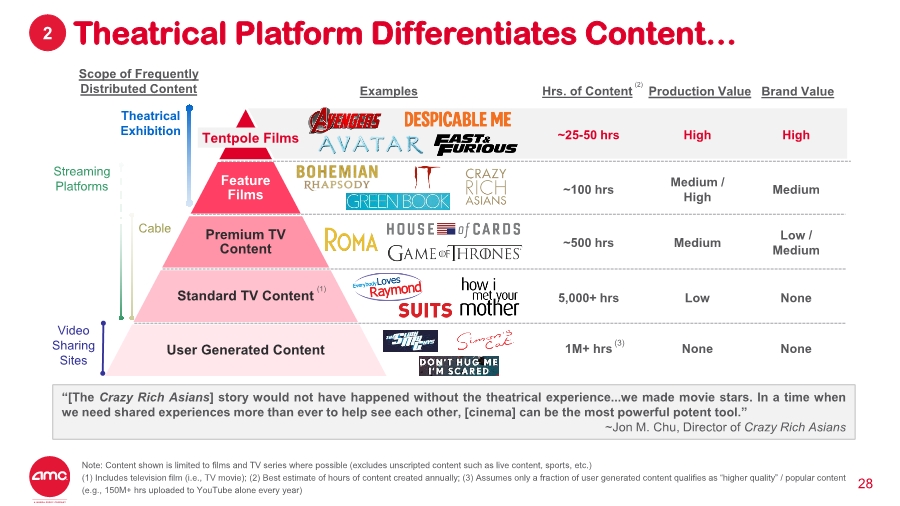
(1) ~25-50 hrs High High ~100 hrs Medium / High Medium ~500 hrs Medium Low / Medium 5,000+ hrs Low None 1M+ hrs None None(3) Theatrical Platform Differentiates Content… 28 “[The Crazy Rich Asians] story would not have happened without the theatrical experience...we made movie stars. In a time when we need shared experiences more than ever to help see each other, [cinema] can be the most powerful potent tool.” ~Jon M. Chu, Director of Crazy Rich Asians Scope of Frequently Distributed Content Examples Production Value Brand ValueHrs. of Content Feature Films Premium TV Content Standard TV Content User Generated Content Theatrical Exhibition Tentpole Films Cable Video Sharing Sites Streaming Platforms (2) 2 Note: Content shown is limited to films and TV series where possible (excludes unscripted content such as live content, sports, etc.) (1) Includes television film (i.e., TV movie); (2) Best estimate of hours of content created annually; (3) Assumes only a fraction of user generated content qualifies as “higher quality” / popular content (e.g., 150M+ hrs uploaded to YouTube alone every year) (1) |
|
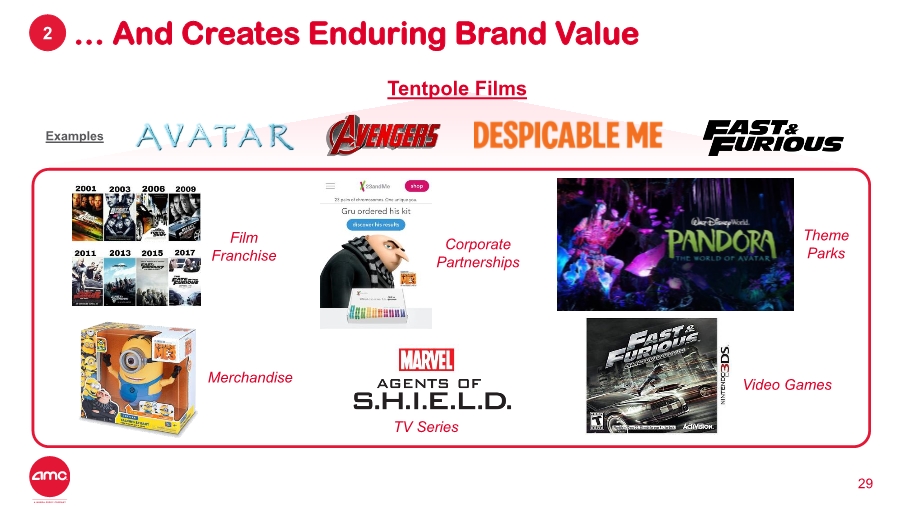
… And Creates Enduring Brand Value 29 Film Franchise Video GamesMerchandise Corporate Partnerships Theme Parks TV Series Tentpole Films Examples 2 |
|
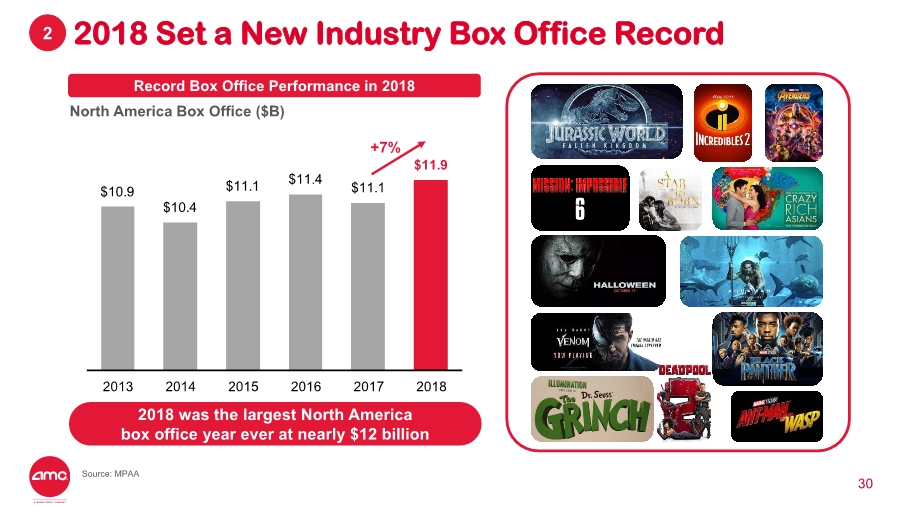
2018 Set a New Industry Box Office Record 30 2018 was the largest North America box office year ever at nearly $12 billion Record Box Office Performance in 2018 $10.9 $10.4 $11.1 $11.4 $11.1 $11.9 2013 2014 2015 2016 2017 2018 +7% North America Box Office ($B) 2 Source: MPAA |
|
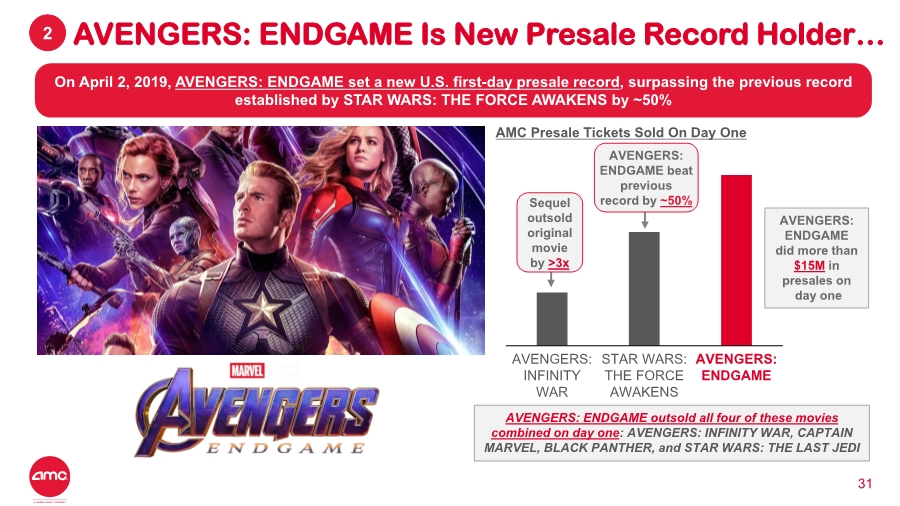
AVENGERS: INFINITY WAR AVENGERS: ENDGAME STAR WARS: THE FORCE AWAKENS AVENGERS: ENDGAME Is New Presale Record Holder… 31 On April 2, 2019, AVENGERS: ENDGAME set a new U.S. first-day presale record, surpassing the previous record established by STAR WARS: THE FORCE AWAKENS by ~50% 2 AVENGERS: ENDGAME outsold all four of these movies combined on day one: AVENGERS: INFINITY WAR, CAPTAIN MARVEL, BLACK PANTHER, and STAR WARS: THE LAST JEDI AMC Presale Tickets Sold On Day One AVENGERS: ENDGAME did more than $15M in presales on day one AVENGERS: ENDGAME beat previous record by ~50%Sequel outsold original movie by >3x |
|
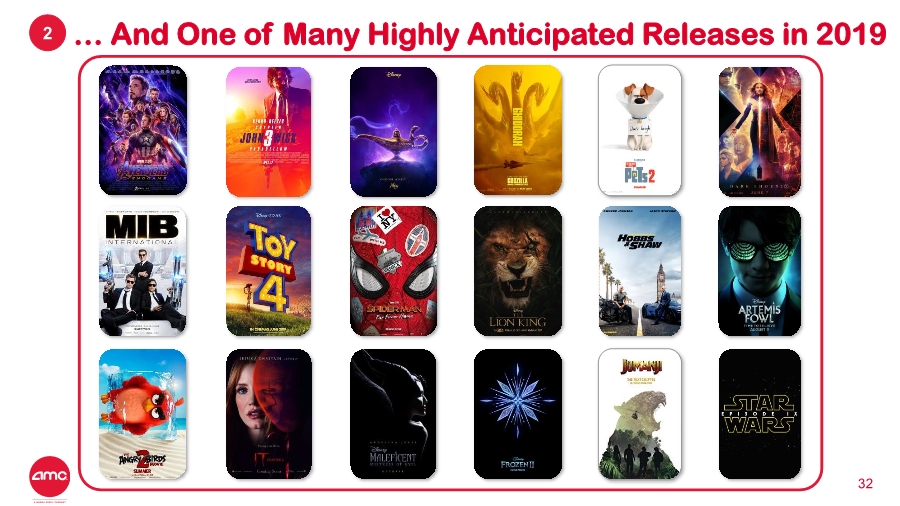
… And One of Many Highly Anticipated Releases in 2019 32 2 |
|
Industry Leader in Moviegoing Experience… 33 3 AMC’s mission is to deliver the world’s best theatrical experience for moviegoers Investments in Experiential Infrastructure Have Produced Best-in-Class Amenities & Facilities Comfort and Convenience Upgrades Premium Sight & Sound Premium Food & Beverage Offerings Capex per Domestic Theatre ($M)(1) Cumulative Domestic Capex at 2018 Year-End(2) ~$1.7B ~$0.9B ~$1.3B AMC Stubs A-List Rewards Consumer Loyalty with High-Value Subscription Offering Launched A-List subscription program in mid-2018 → Reached 600K subscribers in 6 months A-List Members (1) Capex figures are net of landlord contributions (2) Cumulative domestic net capex shown; Regal’s 2018 capex estimated based on prior year’s trajectory AMC Stubs Loyalty Program Provides Attractive Rewards and Value-Added Services to Guests AMC Stubs Household Members Rebranded loyalty program “AMC Stubs” in 2016 → 7x+ members vs. legacy program Relaunch |

|
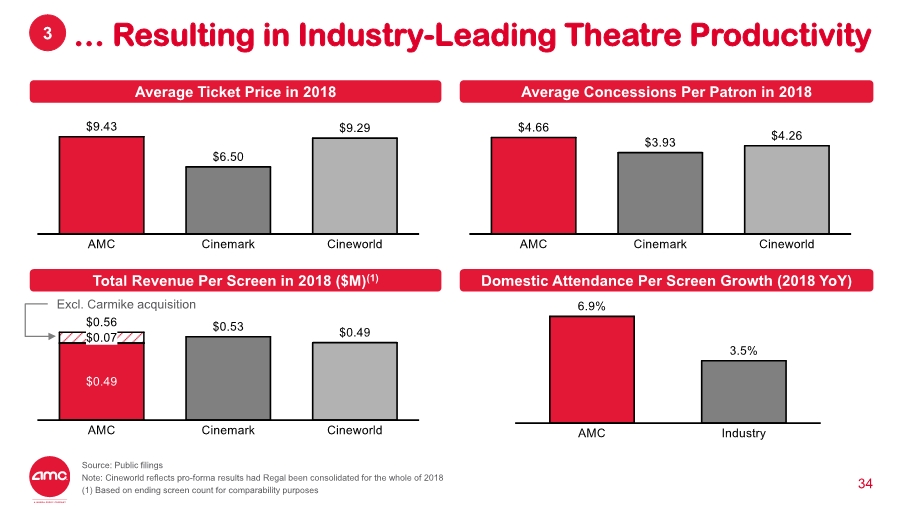
… Resulting in Industry-Leading Theatre Productivity 34 Average Ticket Price in 2018 Average Concessions Per Patron in 2018 Total Revenue Per Screen in 2018 ($M)(1) Domestic Attendance Per Screen Growth (2018 YoY) Excl. Carmike acquisition 3 Source: Public filings Note: Cineworld reflects pro-forma results had Regal been consolidated for the whole of 2018 (1) Based on ending screen count for comparability purposes |
|
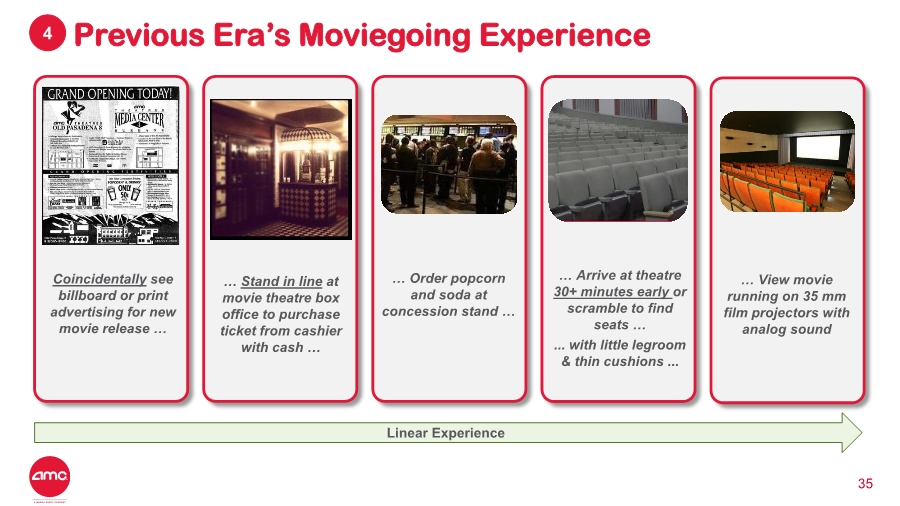
Previous Era’s Moviegoing Experience 35 Linear Experience 4 Coincidentally see billboard or print advertising for new movie release … … Stand in line at movie theatre box office to purchase ticket from cashier with cash … … View movie running on 35 mm film projectors with analog sound … Order popcorn and soda at concession stand … … Arrive at theatre 30+ minutes early or scramble to find seats … .... with little legroom & thin cushions ... |
|
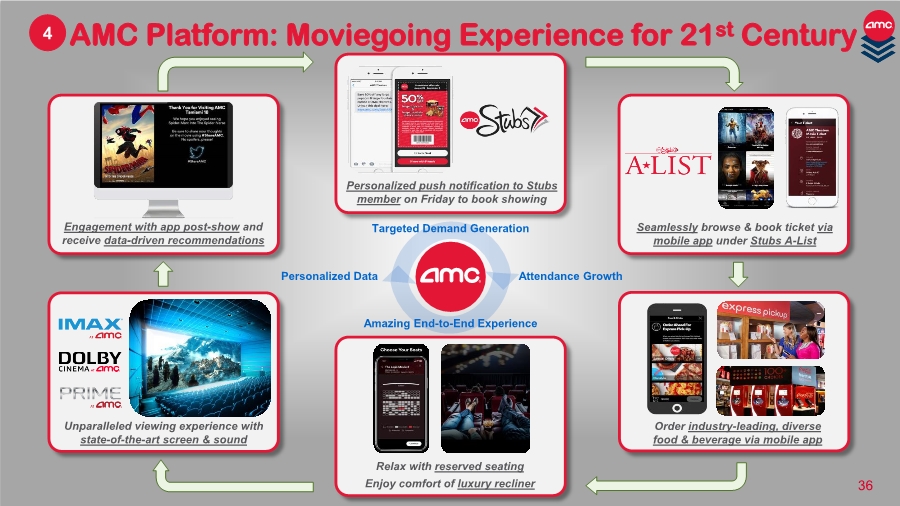
AMC Platform: Moviegoing Experience for 21st Century 36 Unparalleled viewing experience with state-of-the-art screen & sound Order industry-leading, diverse food & beverage via mobile app Relax with reserved seating Enjoy comfort of luxury recliner Engagement with app post-show and receive data-driven recommendations Targeted Demand Generation Attendance Growth Amazing End-to-End Experience Personalized Data Seamlessly browse & book ticket via mobile app under Stubs A-List Personalized push notification to Stubs member on Friday to book showing 4 |
|
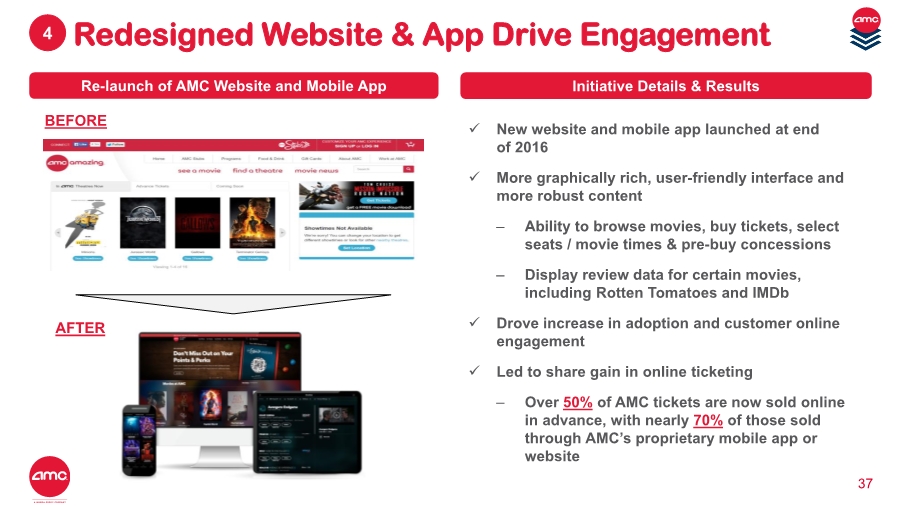
Redesigned Website & App Drive Engagement 37 BEFORE ✓ New website and mobile app launched at end of 2016 ✓ More graphically rich, user-friendly interface and more robust content – Ability to browse movies, buy tickets, select seats / movie times & pre-buy concessions – Display review data for certain movies, including Rotten Tomatoes and IMDb ✓ Drove increase in adoption and customer online engagement ✓ Led to share gain in online ticketing – Over 50% of AMC tickets are now sold online in advance, with nearly 70% of those sold through AMC’s proprietary mobile app or website Initiative Details & ResultsRe-launch of AMC Website and Mobile App AFTER 4 |
|
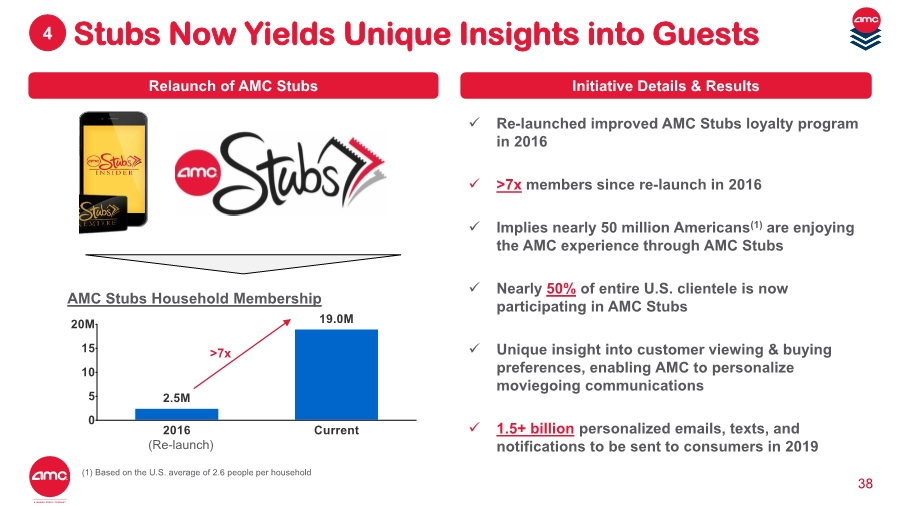
Stubs Now Yields Unique Insights into Guests 38 Initiative Details & Results AMC Stubs Household Membership ✓ Re-launched improved AMC Stubs loyalty program in 2016 ✓ >7x members since re-launch in 2016 ✓ Implies nearly 50 million Americans(1) are enjoying the AMC experience through AMC Stubs ✓ Nearly 50% of entire U.S. clientele is now participating in AMC Stubs ✓ Unique insight into customer viewing & buying preferences, enabling AMC to personalize moviegoing communications ✓ 1.5+ billion personalized emails, texts, and notifications to be sent to consumers in 2019 Relaunch of AMC Stubs >7x (Re-launch) 4 (1) Based on the U.S. average of 2.6 people per household |
|
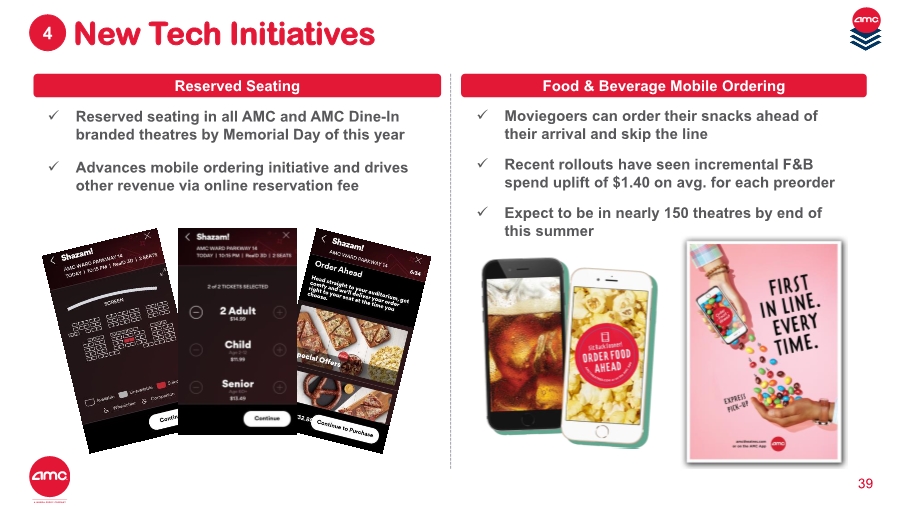
New Tech Initiatives 39 Food & Beverage Mobile OrderingReserved Seating ✓ Moviegoers can order their snacks ahead of their arrival and skip the line ✓ Recent rollouts have seen incremental F&B spend uplift of $1.40 on avg. for each preorder ✓ Expect to be in nearly 150 theatres by end of this summer ✓ Reserved seating in all AMC and AMC Dine-In branded theatres by Memorial Day of this year ✓ Advances mobile ordering initiative and drives other revenue via online reservation fee 4 |
|
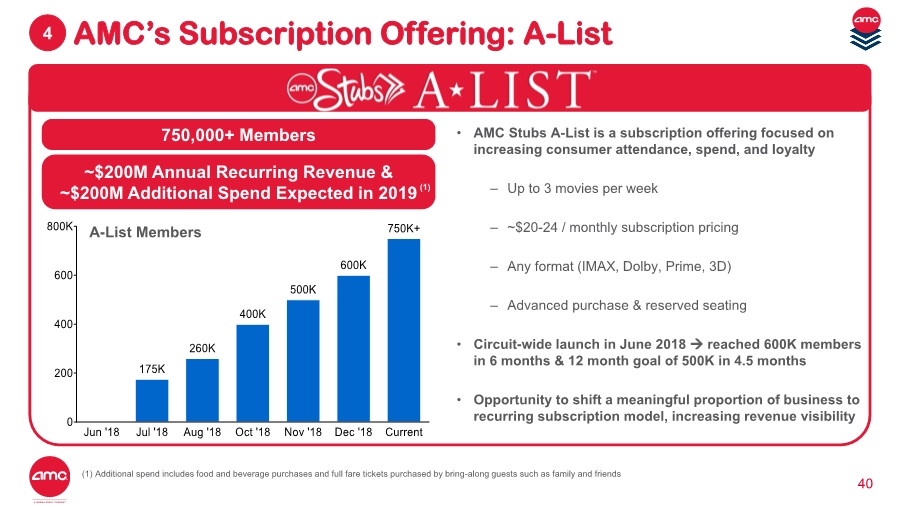
AMC’s Subscription Offering: A-List 40 4 • AMC Stubs A-List is a subscription offering focused on increasing consumer attendance, spend, and loyalty – Up to 3 movies per week – ~$20-24 / monthly subscription pricing – Any format (IMAX, Dolby, Prime, 3D) – Advanced purchase & reserved seating • Circuit-wide launch in June 2018 → reached 600K members in 6 months & 12 month goal of 500K in 4.5 months • Opportunity to shift a meaningful proportion of business to recurring subscription model, increasing revenue visibility (1) Additional spend includes food and beverage purchases and full fare tickets purchased by bring-along guests such as family and friends (1) 750,000+ Members ~$200M Annual Recurring Revenue & ~$200M Additional Spend Expected in 2019 A-List Members (1) |
|
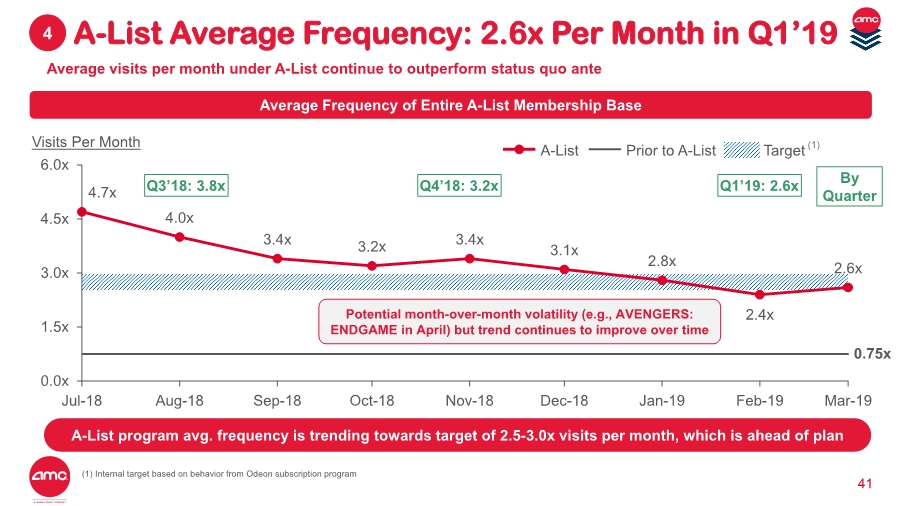
41 (1) Internal target based on behavior from Odeon subscription program Average visits per month under A-List continue to outperform status quo ante A-List Average Frequency: 2.6x Per Month in Q1’194 4.7x 4.0x 3.4x 3.2x 3.4x 3.1x 2.8x 2.4x 2.6x 0.0x 1.5x 3.0x 4.5x 6.0x Dec-18Jul-18 Oct-18Aug-18 Sep-18 Nov-18 Jan-19 Feb-19 Mar-19 Visits Per Month TargetA-List Prior to A-List Average Frequency of Entire A-List Membership Base (1) A-List program avg. frequency is trending towards target of 2.5-3.0x visits per month, which is ahead of plan Q3’18: 3.8x Q4’18: 3.2x Q1’19: 2.6x By Quarter 0.75x Potential month-over-month volatility (e.g., AVENGERS: ENDGAME in April) but trend continues to improve over time |
|
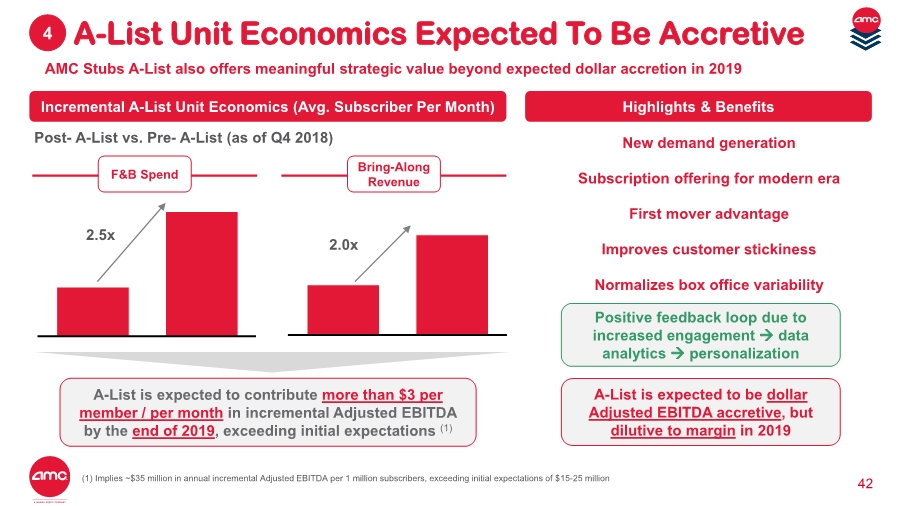
42 AMC Stubs A-List also offers meaningful strategic value beyond expected dollar accretion in 2019 Incremental A-List Unit Economics (Avg. Subscriber Per Month) Highlights & Benefits A-List is expected to contribute more than $3 per member / per month in incremental Adjusted EBITDA by the end of 2019, exceeding initial expectations (1) A-List is expected to be dollar Adjusted EBITDA accretive, but dilutive to margin in 2019 Post-A-List vs. Pre-A-List (as of Q4 2018) Bring-Along Revenue 2.0x F&B Spend 2.5x Positive feedback loop due to increased engagement → data analytics → personalization New demand generation Subscription offering for modern era First mover advantage Improves customer stickiness Normalizes box office variability A-List Unit Economics Expected To Be Accretive4 (1) Implies ~$35 million in annual incremental Adjusted EBITDA per 1 million subscribers, exceeding initial expectations of $15-25 million |
|
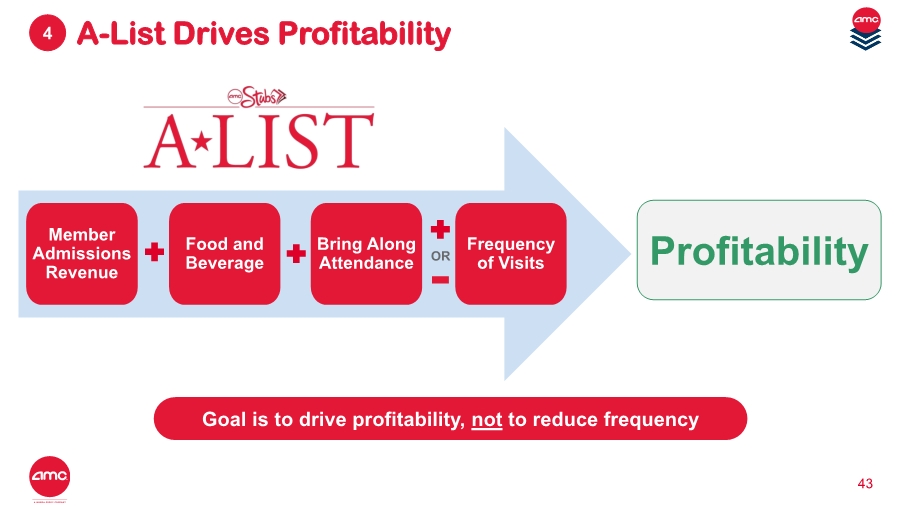
A-List Drives Profitability 43 4 Frequency of Visits Food and Beverage Bring Along Attendance Member Admissions Revenue Profitability Goal is to drive profitability, not to reduce frequency OR |
|
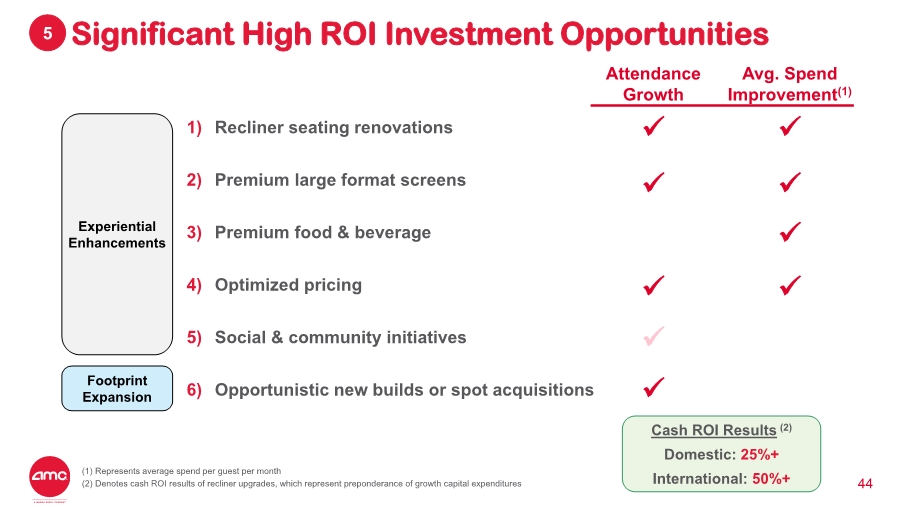
44 Significant High ROI Investment Opportunities5 1) Recliner seating renovations 2) Premium large format screens 3) Premium food & beverage 4) Optimized pricing 5) Social & community initiatives 6) Opportunistic new builds or spot acquisitions Attendance Growth Avg. Spend Improvement(1) ✓ ✓ ✓ ✓ ✓ ✓ ✓ Experiential Enhancements Footprint Expansion ✓ ✓ Cash ROI Results (2) Domestic: 25%+ International: 50%+(1) Represents average spend per guest per month (2) Denotes cash ROI results of recliner upgrades, which represent preponderance of growth capital expenditures |
|
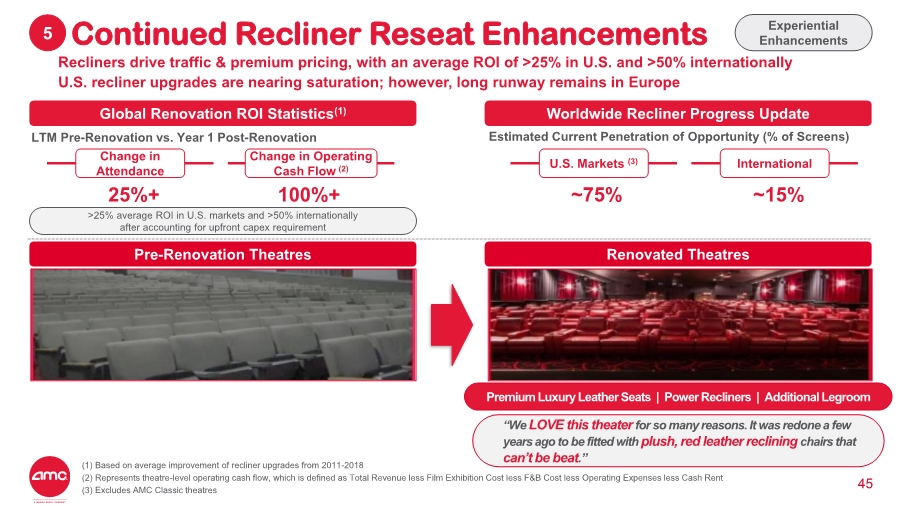
45 Continued Recliner Reseat Enhancements5 (1) Based on average improvement of recliner upgrades from 2011-2018 (2) Represents theatre-level operating cash flow, which is defined as Total Revenue less Film Exhibition Cost less F&B Cost less Operating Expenses less Cash Rent (3) Excludes AMC Classic theatres Experiential Enhancements Recliners drive traffic & premium pricing, with an average ROI of >25% in U.S. and >50% internationally U.S. recliner upgrades are nearing saturation; however, long runway remains in Europe Global Renovation ROI Statistics(1) Worldwide Recliner Progress Update Estimated Current Penetration of Opportunity (% of Screens)LTM Pre-Renovation vs. Year 1 Post-Renovation 25%+ Change in Operating Cash Flow (2) Change in Attendance 100%+ ~75% InternationalU.S. Markets (3) ~15% Pre-Renovation Theatres Renovated Theatres >25% average ROI in U.S. markets and >50% internationally after accounting for upfront capex requirement Premium Luxury Leather Seats | Power Recliners | Additional Legroom “We LOVE this theater for so many reasons. It was redone a few years ago to be fitted with plush, red leather reclining chairs that can’t be beat.” |
|
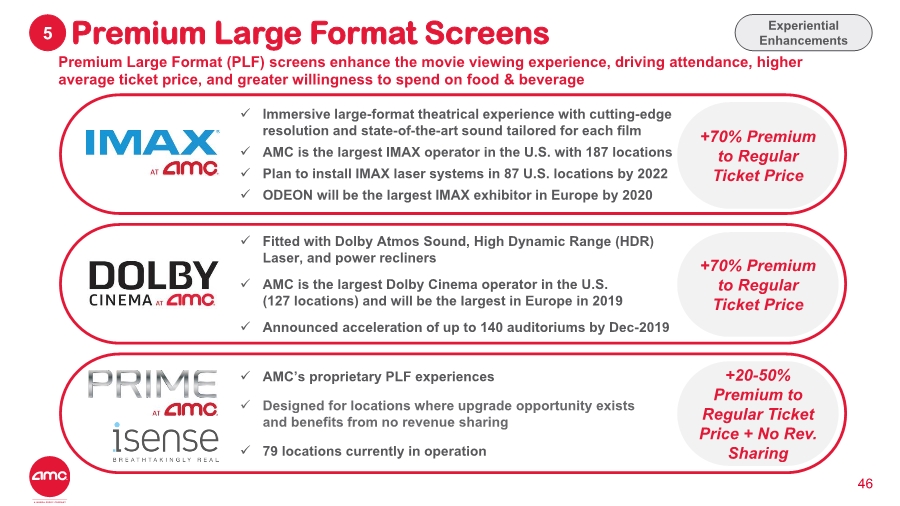
46 Premium Large Format Screens5 Experiential Enhancements Premium Large Format (PLF) screens enhance the movie viewing experience, driving attendance, higher average ticket price, and greater willingness to spend on food & beverage ✓ Immersive large-format theatrical experience with cutting-edge resolution and state-of-the-art sound tailored for each film ✓ AMC is the largest IMAX operator in the U.S. with 187 locations ✓ Plan to install IMAX laser systems in 87 U.S. locations by 2022 ✓ ODEON will be the largest IMAX exhibitor in Europe by 2020 +70% Premium to Regular Ticket Price ✓ Fitted with Dolby Atmos Sound, High Dynamic Range (HDR) Laser, and power recliners ✓ AMC is the largest Dolby Cinema operator in the U.S. (127 locations) and will be the largest in Europe in 2019 ✓ Announced acceleration of up to 140 auditoriums by Dec-2019 ✓ AMC’s proprietary PLF experiences ✓ Designed for locations where upgrade opportunity exists and benefits from no revenue sharing ✓ 79 locations currently in operation +70% Premium to Regular Ticket Price +20-50% Premium to Regular Ticket Price + No Rev. Sharing |
|
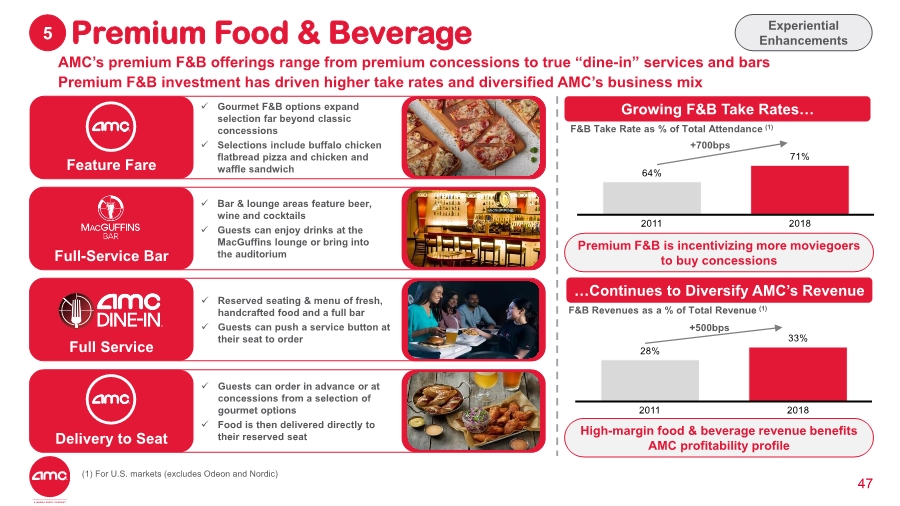
47 Premium Food & Beverage5 Experiential Enhancements AMC’s premium F&B offerings range from premium concessions to true “dine-in” services and bars Premium F&B investment has driven higher take rates and diversified AMC’s business mix Feature Fare ✓ Gourmet F&B options expand selection far beyond classic concessions ✓ Selections include buffalo chicken flatbread pizza and chicken and waffle sandwich Full-Service Bar ✓ Bar & lounge areas feature beer, wine and cocktails ✓ Guests can enjoy drinks at the MacGuffins lounge or bring into the auditorium Full Service ✓ Reserved seating & menu of fresh, handcrafted food and a full bar ✓ Guests can push a service button at their seat to order Delivery to Seat ✓ Guests can order in advance or at concessions from a selection of gourmet options ✓ Food is then delivered directly to their reserved seat Growing F&B Take Rates… F&B Take Rate as % of Total Attendance (1) +700bps Premium F&B is incentivizing more moviegoers to buy concessions …Continues to Diversify AMC’s Revenue F&B Revenues as a % of Total Revenue (1) +500bps High-margin food & beverage revenue benefits AMC profitability profile (1) For U.S. markets (excludes Odeon and Nordic) |
|
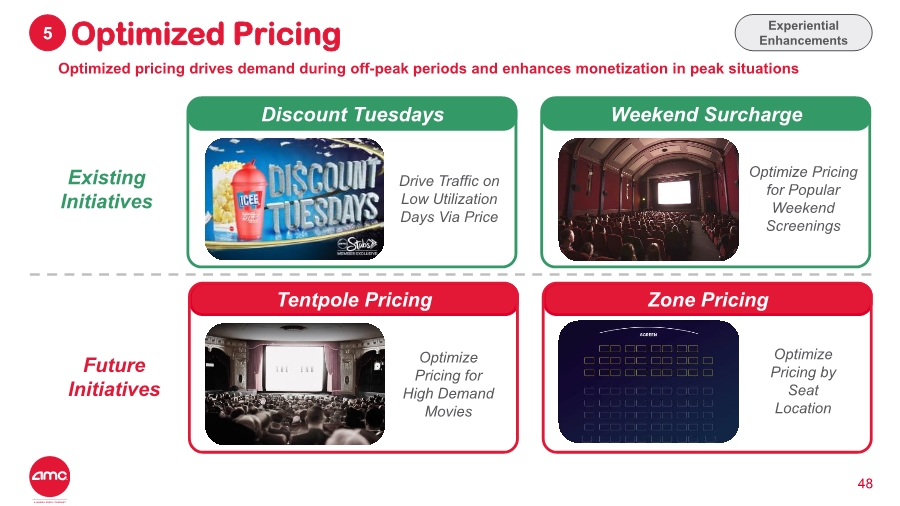
48 Optimized Pricing5 Experiential Enhancements Optimized pricing drives demand during off-peak periods and enhances monetization in peak situations Discount Tuesdays Drive Traffic on Low Utilization Days Via Price Weekend Surcharge Optimize Pricing for Popular Weekend Screenings Tentpole Pricing Zone Pricing Optimize Pricing for High Demand Movies Optimize Pricing by Seat Location Existing Initiatives Future Initiatives |
|
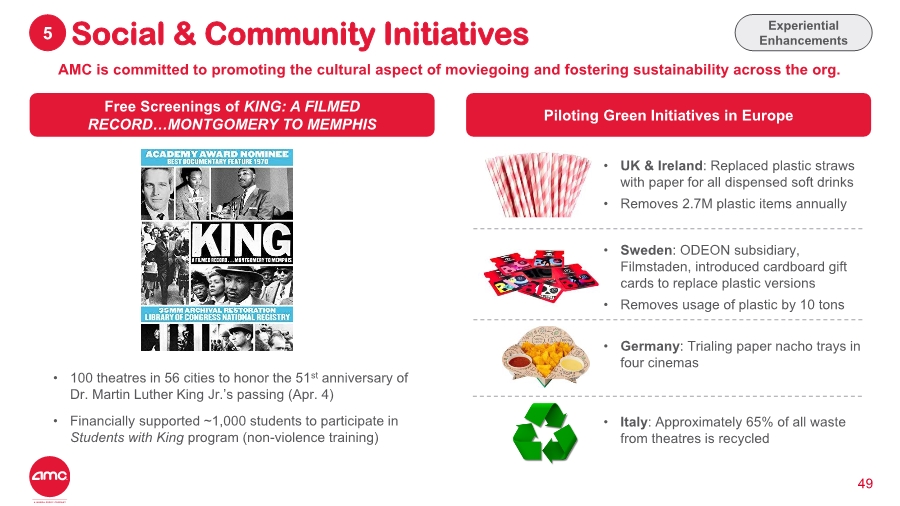
49 Social & Community Initiatives5 Experiential Enhancements AMC is committed to promoting the cultural aspect of moviegoing and fostering sustainability across the org. Free Screenings of KING: A FILMED RECORD…MONTGOMERY TO MEMPHIS Piloting Green Initiatives in Europe • UK & Ireland: Replaced plastic straws with paper for all dispensed soft drinks • Removes 2.7M plastic items annually • 100 theatres in 56 cities to honor the 51st anniversary of Dr. Martin Luther King Jr.’s passing (Apr. 4) • Financially supported ~1,000 students to participate in Students with King program (non-violence training) • Italy: Approximately 65% of all waste from theatres is recycled • Sweden: ODEON subsidiary, Filmstaden, introduced cardboard gift cards to replace plastic versions • Removes usage of plastic by 10 tons • Germany: Trialing paper nacho trays in four cinemas |
|
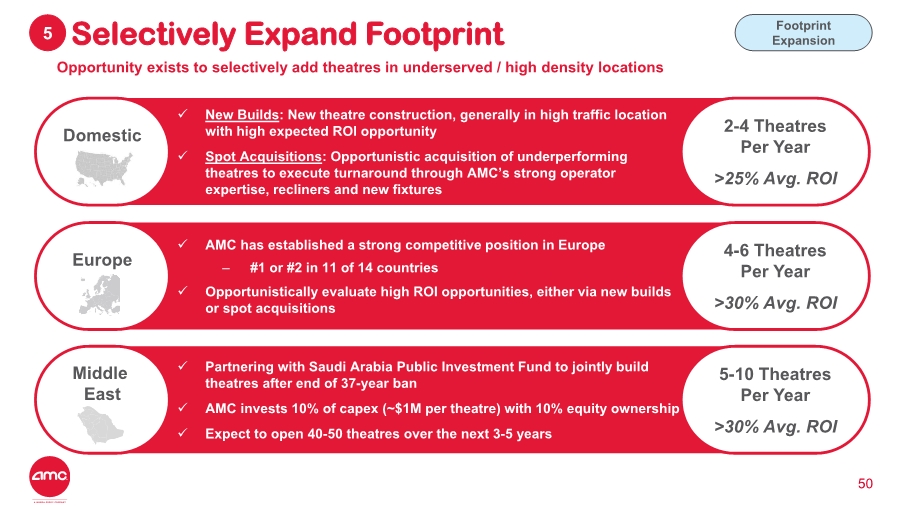
50 Selectively Expand Footprint5 Footprint Expansion Opportunity exists to selectively add theatres in underserved / high density locations ✓ Partnering with Saudi Arabia Public Investment Fund to jointly build theatres after end of 37-year ban ✓ AMC invests 10% of capex (~$1M per theatre) with 10% equity ownership ✓ Expect to open 40-50 theatres over the next 3-5 years Middle East ✓ AMC has established a strong competitive position in Europe –#1 or #2 in 11 of 14 countries ✓ Opportunistically evaluate high ROI opportunities, either via new builds or spot acquisitions Europe ✓ New Builds: New theatre construction, generally in high traffic location with high expected ROI opportunity ✓ Spot Acquisitions: Opportunistic acquisition of underperforming theatres to execute turnaround through AMC’s strong operator expertise, recliners and new fixtures Domestic 5-10 Theatres Per Year >30% Avg. ROI 4-6 Theatres Per Year >30% Avg. ROI 2-4 Theatres Per Year >25% Avg. ROI |
|
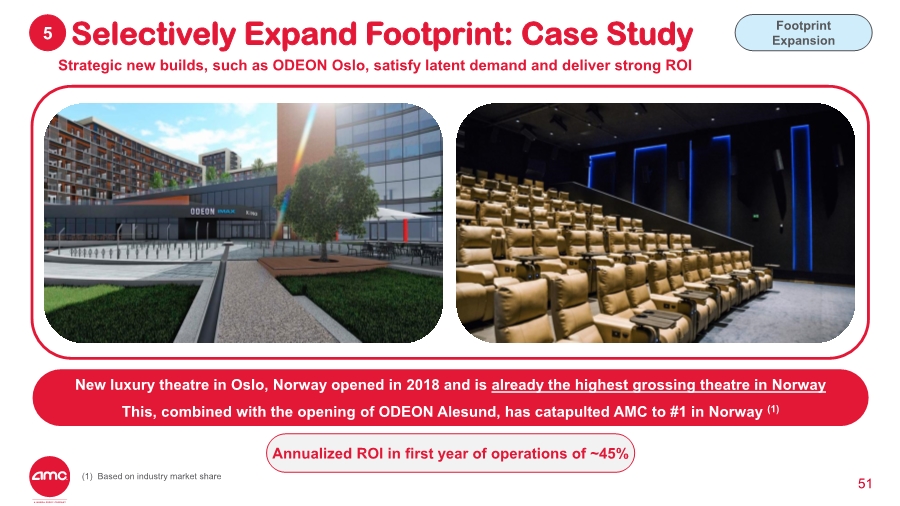
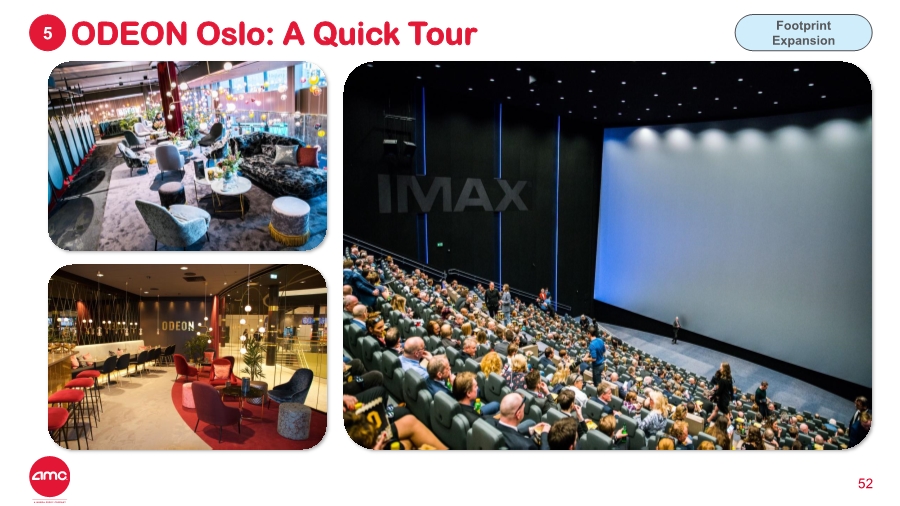
51 Selectively Expand Footprint: Case Study5 Strategic new builds, such as ODEON Oslo, satisfy latent demand and deliver strong ROI New luxury theatre in Oslo, Norway opened in 2018 and is already the highest grossing theatre in Norway This, combined with the opening of ODEON Alesund, has catapulted AMC to #1 in Norway (1) Annualized ROI in first year of operations of ~45% (1) Based on industry market share Footprint Expansion |
|
52 ODEON Oslo: A Quick Tour5 Footprint Expansion |
|
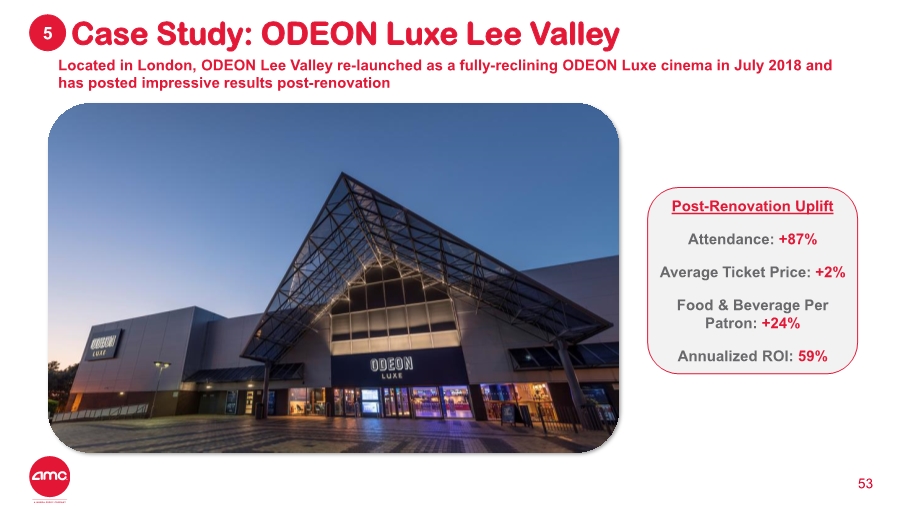
53 Case Study: ODEON Luxe Lee Valley5 Located in London, ODEON Lee Valley re-launched as a fully-reclining ODEON Luxe cinema in July 2018 and has posted impressive results post-renovation Post-Renovation Uplift Attendance: +87% Average Ticket Price: +2% Food & Beverage Per Patron: +24% Annualized ROI: 59% |
|
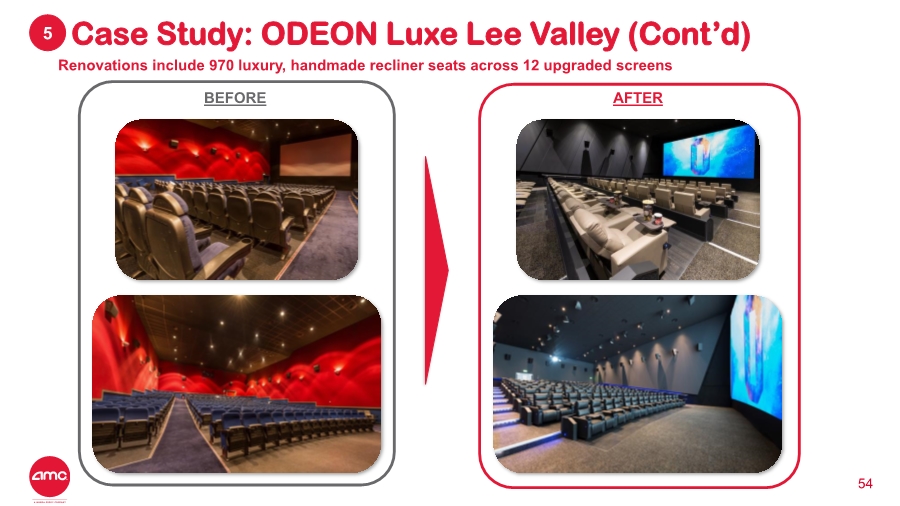
54 Case Study: ODEON Luxe Lee Valley (Cont’d)5 BEFORE AFTER Renovations include 970 luxury, handmade recliner seats across 12 upgraded screens |
|
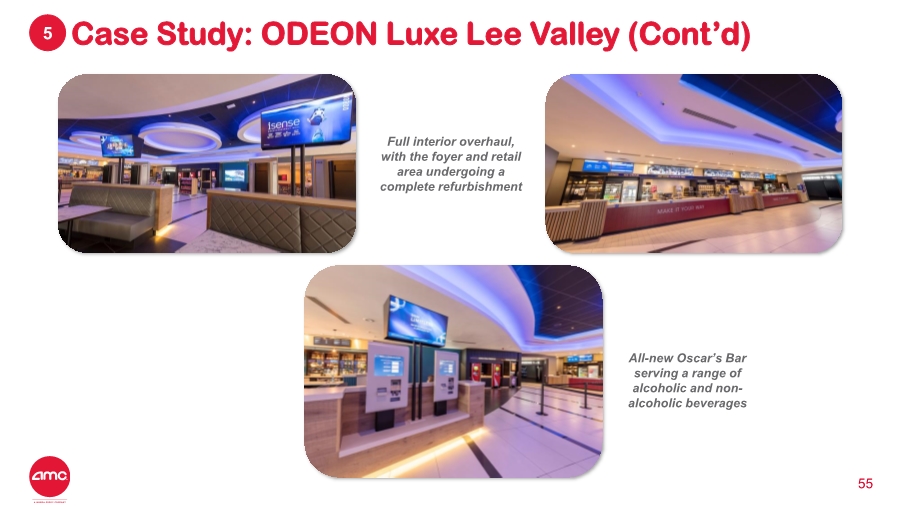
55 Case Study: ODEON Luxe Lee Valley (Cont’d)5 Full interior overhaul, with the foyer and retail area undergoing a complete refurbishment All-new Oscar’s Bar serving a range of alcoholic and non- alcoholic beverages |
|
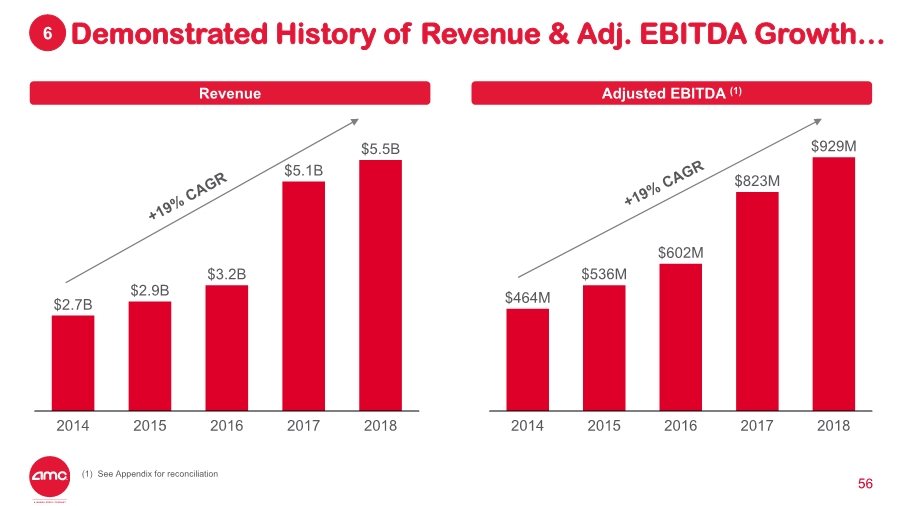
56 Demonstrated History of Revenue & Adj. EBITDA Growth…6 201620152014 2017 2018 $2.9B $2.7B $3.2B $5.1B $5.5B Revenue Adjusted EBITDA (1) $464M $536M $602M $823M $929M 2014 20162015 2017 2018 (1) See Appendix for reconciliation |
|
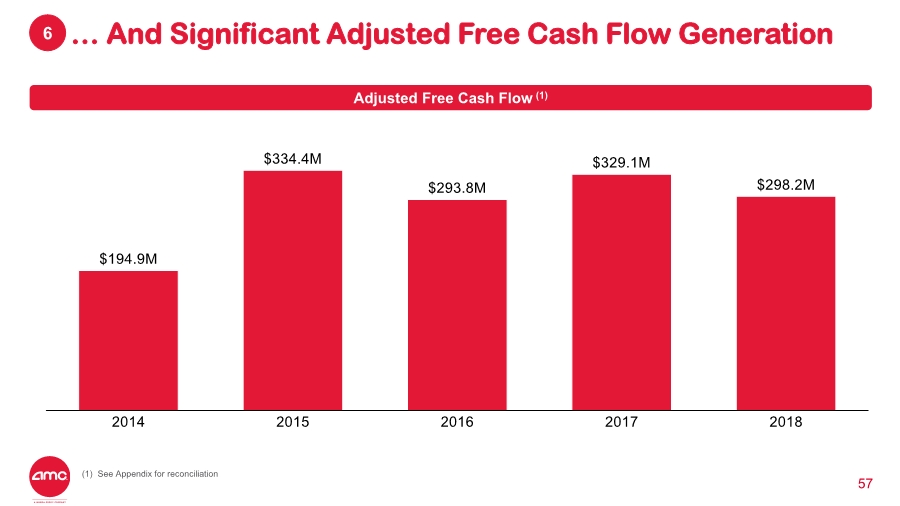
57 … And Significant Adjusted Free Cash Flow Generation6 Adjusted Free Cash Flow (1) (1) See Appendix for reconciliation |
|
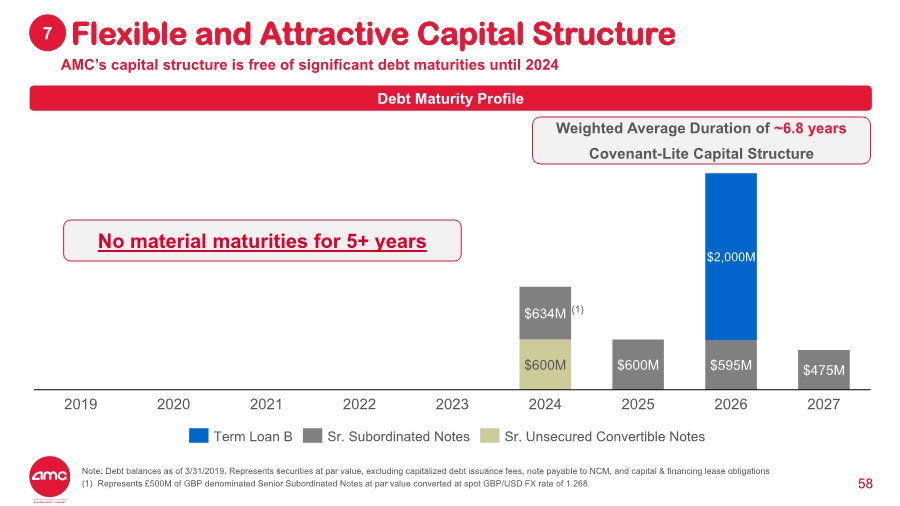
58 Flexible and Attractive Capital Structure7 AMC’s capital structure is free of significant debt maturities until 2024 Debt Maturity Profile $600M $600M $595M $475M $634M $2,000M 202220202019 2021 2023 2024 2025 2026 2027 Sr. Subordinated NotesTerm Loan B Sr. Unsecured Convertible Notes Weighted Average Duration of ~6.8 years Covenant-Lite Capital Structure No material maturities for 5+ years (1) Note: Debt balances as of 3/31/2019. Represents securities at par value, excluding capitalized debt issuance fees, note payable to NCM, and capital & financing lease obligations (1) Represents £500M of GBP denominated Senior Subordinated Notes at par value converted at spot GBP/USD FX rate of 1.268 |
|
59 Disciplined Approach to Capital Allocation (Reprise)7 AMC follows a highly disciplined approach to capital allocation with the goal of delivering the best results to our stakeholders: our investors, guests, employees, studios, and other business partners Our priorities include: – Invest Adjusted Free Cash Flow in high ROI projects in the U.S., Europe, and Middle East that grow our future cash generation capacity → 25% hurdle rate – Utilize our expected increasing available cash, as capex normalizes over time, to deleverage balance sheet and improve long term strategic flexibility – Return capital to shareholders via dividends and share buybacks 1 2 3 |
|
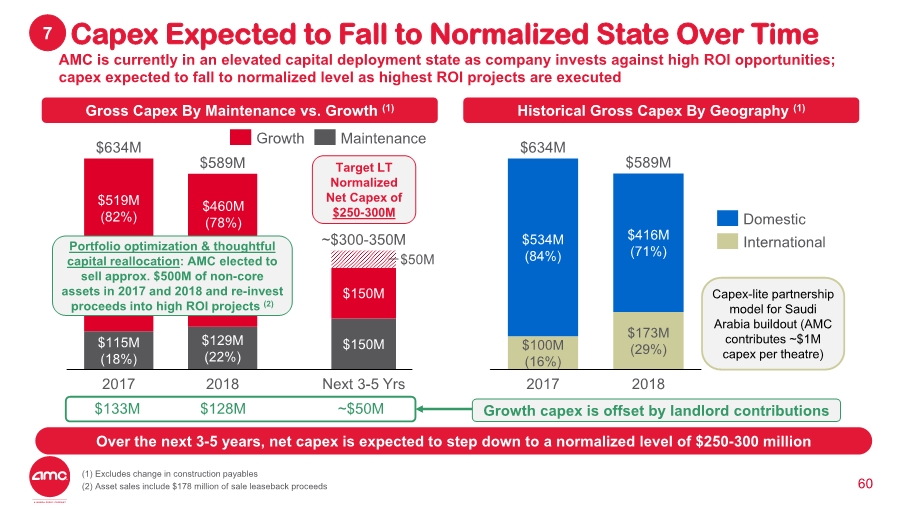
60 Capex Expected to Fall to Normalized State Over Time7 AMC is currently in an elevated capital deployment state as company invests against high ROI opportunities; capex expected to fall to normalized level as highest ROI projects are executed $129M (22%) $115M (18%) 2017 2018 $589M $634M Gross Capex By Maintenance vs. Growth (1) Historical Gross Capex By Geography (1) 2017 $634M $534M (84%) $100M (16%) $173M (29%) $589M $416M (71%) 2018 Growth Maintenance Domestic International $128M$133M Growth capex is offset by landlord contributions $150M $150M $50M ~$300-350M Next 3-5 Yrs ~$50M Target LT Normalized Net Capex of $250-300M Capex-lite partnership model for Saudi Arabia buildout (AMC contributes ~$1M capex per theatre) Portfolio optimization & thoughtful capital reallocation: AMC elected to sell approx. $500M of non-core assets in 2017 and 2018 and re-invest proceeds into high ROI projects (2) $519M (82%) $460M (78%) (1) Excludes change in construction payables (2) Asset sales include $178 million of sale leaseback proceeds Over the next 3-5 years, net capex is expected to step down to a normalized level of $250-300 million |
|
4. Financial Outlook 61 |

|
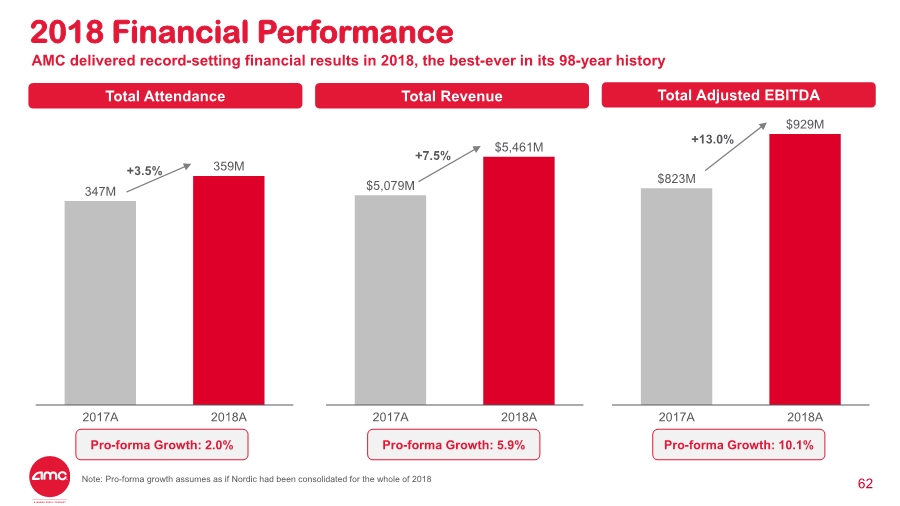
62 2018 Financial Performance AMC delivered record-setting financial results in 2018, the best-ever in its 98-year history Total Attendance Total Revenue Total Adjusted EBITDA 347M 359M 2018A2017A $5,079M $5,461M 2018A2017A $823M $929M 2018A2017A +3.5% +13.0% +7.5% Pro-forma Growth: 2.0% Pro-forma Growth: 5.9% Pro-forma Growth: 10.1% Note: Pro-forma growth assumes as if Nordic had been consolidated for the whole of 2018 |
|
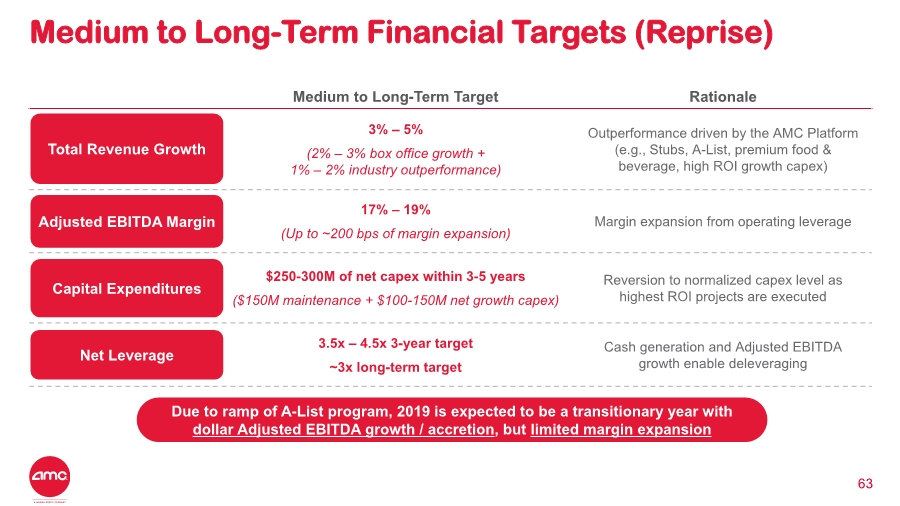
63 Medium to Long-Term Target Rationale 3% – 5% (2% – 3% box office growth + 1% – 2% industry outperformance) Outperformance driven by the AMC Platform (e.g., Stubs, A-List, premium food & beverage, high ROI growth capex) 17% – 19% (Up to ~200 bps of margin expansion) Margin expansion from operating leverage $250-300M of net capex within 3-5 years ($150M maintenance + $100-150M net growth capex) Reversion to normalized capex level as highest ROI projects are executed 3.5x – 4.5x 3-year target ~3x long-term target Cash generation and Adjusted EBITDA growth enable deleveraging Total Revenue Growth Adjusted EBITDA Margin Capital Expenditures Net Leverage Due to ramp of A-List program, 2019 is expected to be a transitionary year with dollar Adjusted EBITDA growth / accretion, but limited margin expansion Medium to Long-Term Financial Targets (Reprise) |
|
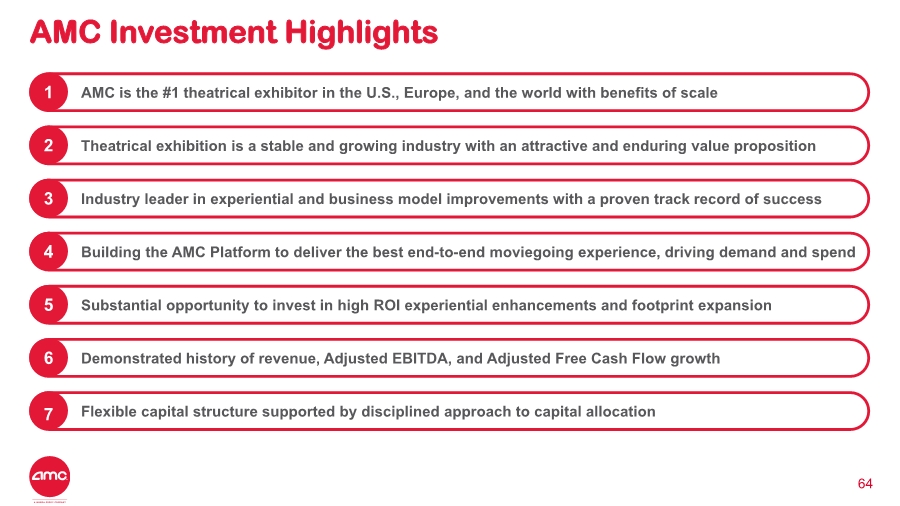
64 AMC Investment Highlights Substantial opportunity to invest in high ROI experiential enhancements and footprint expansion5 Demonstrated history of revenue, Adjusted EBITDA, and Adjusted Free Cash Flow growth6 Flexible capital structure supported by disciplined approach to capital allocation7 AMC is the #1 theatrical exhibitor in the U.S., Europe, and the world with benefits of scale1 Theatrical exhibition is a stable and growing industry with an attractive and enduring value proposition2 Industry leader in experiential and business model improvements with a proven track record of success3 4 Building the AMC Platform to deliver the best end-to-end moviegoing experience, driving demand and spend |
|
5. Appendix 65 |

|
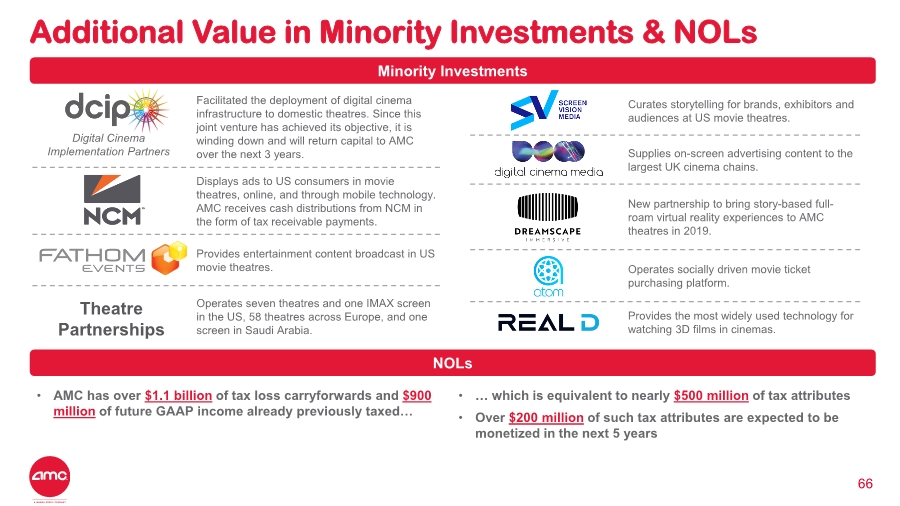
66 Additional Value in Minority Investments & NOLs • AMC has over $1.1 billion of tax loss carryforwards and $900 million of future GAAP income already previously taxed… •… which is equivalent to nearly $500 million of tax attributes • Over $200 million of such tax attributes are expected to be monetized in the next 5 years Minority Investments Facilitated the deployment of digital cinema infrastructure to domestic theatres. Since this joint venture has achieved its objective, it is winding down and will return capital to AMC over the next 3 years. Displays ads to US consumers in movie theatres, online, and through mobile technology. AMC receives cash distributions from NCM in the form of tax receivable payments. Provides entertainment content broadcast in US movie theatres. Operates seven theatres and one IMAX screen in the US, 58 theatres across Europe, and one screen in Saudi Arabia. Curates storytelling for brands, exhibitors and audiences at US movie theatres. Supplies on-screen advertising content to the largest UK cinema chains. New partnership to bring story-based full- roam virtual reality experiences to AMC theatres in 2019. Operates socially driven movie ticket purchasing platform. Provides the most widely used technology for watching 3D films in cinemas. Theatre Partnerships Digital Cinema Implementation Partners NOLs |
|
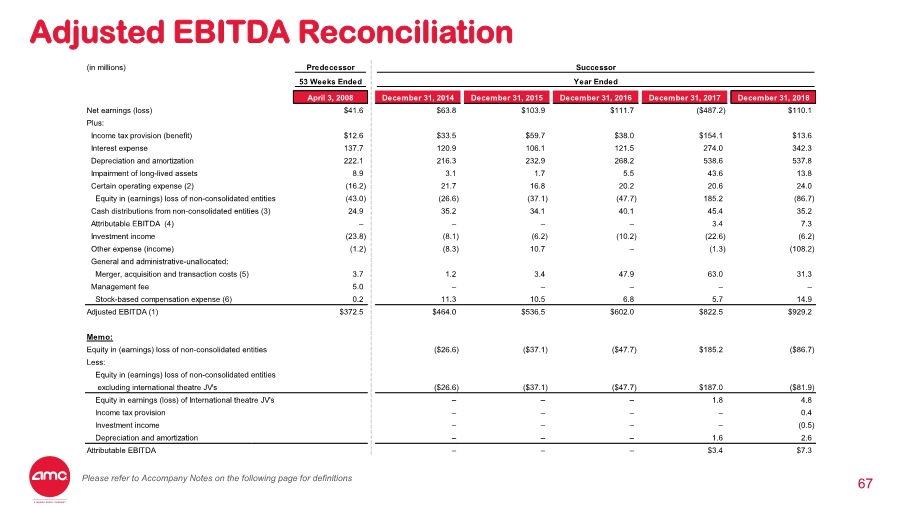
67 Adjusted EBITDA Reconciliation (in millions) Predecessor Successor 53 Weeks Ended Year Ended April 3, 2008 December 31, 2014 December 31, 2015 December 31, 2016 December 31, 2017 December 31, 2018 Net earnings (loss) $41.6 $63.8 $103.9 $111.7 ($487.2) $110.1 Plus: Income tax provision (benefit) $12.6 $33.5 $59.7 $38.0 $154.1 $13.6 Interest expense 137.7 120.9 106.1 121.5 274.0 342.3 Depreciation and amortization 222.1 216.3 232.9 268.2 538.6 537.8 Impairment of long-lived assets 8.9 3.1 1.7 5.5 43.6 13.8 Certain operating expense (2) (16.2) 21.7 16.8 20.2 20.6 24.0 Equity in (earnings) loss of non-consolidated entities (43.0) (26.6) (37.1) (47.7) 185.2 (86.7) Cash distributions from non-consolidated entities (3) 24.9 35.2 34.1 40.1 45.4 35.2 Attributable EBITDA (4) –––– 3.4 7.3 Investment income (23.8) (8.1) (6.2) (10.2) (22.6) (6.2) Other expense (income) (1.2) (8.3) 10.7 –(1.3) (108.2) General and administrative-unallocated: Merger, acquisition and transaction costs (5) 3.7 1.2 3.4 47.9 63.0 31.3 Management fee 5.0 ––––– Stock-based compensation expense (6) 0.2 11.3 10.5 6.8 5.7 14.9 Adjusted EBITDA (1) $372.5 $464.0 $536.5 $602.0 $822.5 $929.2 Memo: Equity in (earnings) loss of non-consolidated entities ($26.6) ($37.1) ($47.7) $185.2 ($86.7) Less: Equity in (earnings) loss of non-consolidated entities excluding international theatre JV's ($26.6) ($37.1) ($47.7) $187.0 ($81.9) Equity in earnings (loss) of International theatre JV's ––– 1.8 4.8 Income tax provision –––– 0.4 Investment income ––––(0.5) Depreciation and amortization ––– 1.6 2.6 Attributable EBITDA ––– $3.4 $7.3 Please refer to Accompany Notes on the following page for definitions |
|
68 Accompanying Notes 1) We present Adjusted EBITDA as a supplemental measure of our performance. We define Adjusted EBITDA as net earnings (loss) plus (i) income tax provision (benefit), (ii) interest expense and (iii) depreciation and amortization, as further adjusted to eliminate the impact of certain items that we do not consider indicative of our ongoing operating performance and to include attributable EBITDA from equity investments in theatre operations in international markets and any cash distributions of earnings from other equity method investees. These further adjustments are itemized above. You are encouraged to evaluate these adjustments and the reasons we consider them appropriate for supplemental analysis. In evaluating Adjusted EBITDA, you should be aware that in the future we may incur expenses that are the same as or similar to some of the adjustments in this presentation. Our presentation of Adjusted EBITDA should not be construed as an inference that our future results will be unaffected by unusual or non-recurring items. Adjusted EBITDA is a non-U.S. GAAP financial measure commonly used in our industry and should not be construed as an alternative to net earnings (loss) as an indicator of operating performance (as determined in accordance with U.S. GAAP). Adjusted EBITDA may not be comparable to similarly titled measures reported by other companies. We have included Adjusted EBITDA because we believe it provides management and investors with additional information to measure our performance and estimate our value. Adjusted EBITDA has important limitations as an analytical tool, and you should not consider it in isolation, or as a substitute for analysis of our results as reported under U.S. GAAP. For example, Adjusted EBITDA: • does not reflect our capital expenditures, future requirements for capital expenditures or contractual commitments; • does not reflect changes in, or cash requirements for, our working capital needs; • does not reflect the significant interest expenses, or the cash requirements necessary to service interest or principal payments, on our debt; • excludes income tax payments that represent a reduction in cash available to us; • does not reflect any cash requirements for the assets being depreciated and amortized that may have to be replaced in the future; and • does not reflect the impact of divestitures that were required in connection with recently completed acquisitions. 2) Amounts represent preopening expense related to temporarily closed screens under renovation, theatre and other closure expense for the permanent closure of screens including the related accretion of interest, non-cash deferred digital equipment rent expense, and disposition of assets and other non-operating gains or losses included in operating expenses. The Company has excluded these items as they are non-cash in nature, include components of interest cost for the time value of money or are non-operating in nature. 3 Includes U.S. non-theatre distributions from equity method investments and International non-theatre distributions from equity method investments to the extent received. The Company believes including cash distributions is an appropriate reflection of the contribution of these investments to its operations. 4) Attributable EBITDA includes the EBITDA from minority equity investments in theatre operators in certain international markets. See below for a reconciliation of the Company’s equity (earnings) loss of non- consolidated entities to attributable EBITDA. Because these equity investments are in theatre operators in regions where the Company holds a significant market share, the Company believes attributable EBITDA is more indicative of the performance of these equity investments and management uses this measure to monitor and evaluate these equity investments. The Company also provides services to these theatre operators including information technology systems, certain on-screen advertising services and our gift card and package ticket program. As these investments relate only to our Nordic acquisition, the second quarter of 2017 represents the first time the Company has made this adjustment and does not impact prior historical presentations of Adjusted EBITDA. 5) Merger, acquisition and transition costs are excluded as they are non-operating in nature. 6) Stock-based compensation expense is non-cash or non-recurring expense included in General and Administrative: Other. |
|
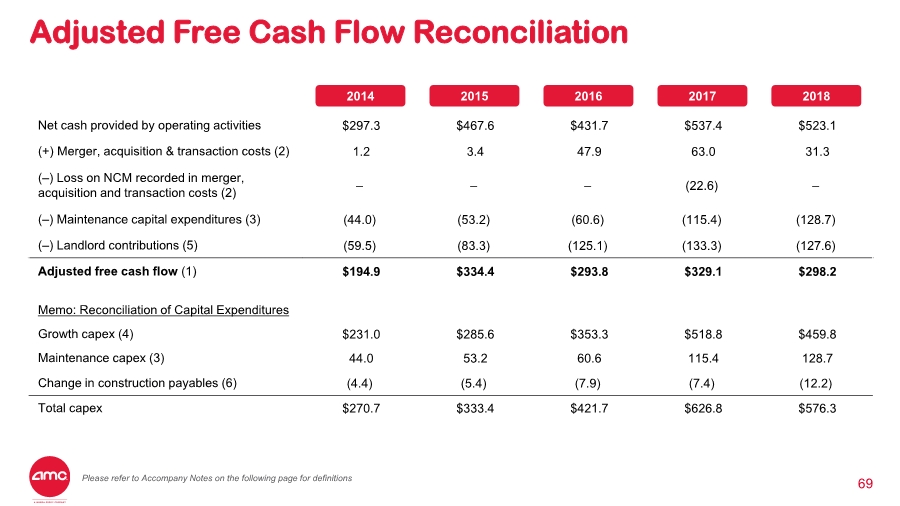
69 Adjusted Free Cash Flow Reconciliation Net cash provided by operating activities $297.3 $467.6 $431.7 $537.4 $523.1 (+) Merger, acquisition & transaction costs (2) 1.2 3.4 47.9 63.0 31.3 (–) Loss on NCM recorded in merger, acquisition and transaction costs (2) –––(22.6) – (–) Maintenance capital expenditures (3) (44.0) (53.2) (60.6) (115.4) (128.7) (–) Landlord contributions (5) (59.5) (83.3) (125.1) (133.3) (127.6) Adjusted free cash flow (1) $194.9 $334.4 $293.8 $329.1 $298.2 Memo: Reconciliation of Capital Expenditures Growth capex (4) $231.0 $285.6 $353.3 $518.8 $459.8 Maintenance capex (3) 44.0 53.2 60.6 115.4 128.7 Change in construction payables (6) (4.4) (5.4) (7.9) (7.4) (12.2) Total capex $270.7 $333.4 $421.7 $626.8 $576.3 2014 2015 2016 2017 2018 Please refer to Accompany Notes on the following page for definitions |
|
70 Accompanying Notes Starting in the fourth quarter of 2018, AMC disclosed a new “Adjusted Free Cash Flow” metric as a measure of our liquidity. We believe this measure is indicative of our ability to generate cash in excess of maintenance capital expenditures and certain other non-operating costs and for other uses including repayment of our corporate borrowings and generating cash for growth opportunities. 1) We present “Adjusted Free Cash Flow” as a supplemental measure of our liquidity. Management uses this measure and we believe it is helpful to investors as an indication of our ability to generate cash in- excess-of maintenance capital expenditures and certain other non-operating and costs and for other uses including repayment of our corporate borrowings and generating cash for growth opportunities. Adjusted Free Cash Flow is a non-U.S. GAAP financial measure and is defined as net cash provided by operating activities, plus merger, acquisition and transaction costs, less maintenance capital expenditures and landlord contributions. Adjusted free cash flow does not represent the residual cash flow available for discretionary expenditures. It should be considered in addition to, not a substitute for or superior to net cash provided by operating activities. The term adjusted free cash flow may differ from similar measures reported by other companies. Also provided is a reconciliation of Capital Expenditures disclosed in the Consolidated Statement of Cash Flows made up of growth capital expenditures, maintenance capital expenditures and change in construction payables as further explanation of the components of adjusted free cash flow. 2) Merger, acquisition and transition costs are excluded as they are non-operating. We excluded the 2017 Loss on NCM that was recorded in Merger, acquisition and transaction costs since it was non-cash. 3) Maintenance capital expenditures are amounts required to keep our existing theatres in compliance with regulatory requirement and in a sustainable good operating condition, including expenditures for repair of HVAC, sight and sound systems, compliance with ADA requirements and technology upgrades of existing systems. 4) Growth capital expenditures are investments that enhance the guest experience and grow revenues and profits and include initiatives such as theatre remodels, acquisitions, newly built theatres, premium large formats, enhanced food and beverage offerings and service models and technology that enable efficiencies and additional revenue opportunities. We did not deduct these from adjusted free cash flow because they are discretionary, and the related benefits may not be fully reflected in our net cash provided by operating activities. 5) Landlord contributions represent reimbursements in our strategic growth initiatives by our landlords. 6) Change in construction payables are changes in amounts accrued for capital expenditures and are not deducted or added back to Adjusted Free Cash Flow as they fluctuate significantly from period to period based on the timing of actual payments. |