CORRESP: A correspondence can be sent as a document with another submission type or can be sent as a separate submission.
Published on November 12, 2024
|
1 November 12, 2024 VIA EDGAR TRANSMISSION Securities and Exchange Commission Division of Corporation Finance 100 F Street NE Washington, D.C. 20549-3561 Attention: Valeria Franks Suying Li Re: AMC Entertainment Holdings, Inc. Form 10-K for Year Ended December 31, 2023 Item 2.02 Form 8-K filed August 2, 2024 Response dated October 9, 2024 (File No. 001-33892) To the addressees set forth above: AMC Entertainment Holdings, Inc. (the “Company, “we, “us,” and “our”) respectfully submits this response to the comments set forth in the comment letter of the staff of the Division of Corporation Finance (the “Staff”) of the Securities and Exchange Commission dated October 31, 2024. For your convenience, we have repeated your comments below in bold and italics before each of our responses. Item 2.02 Form 8-K filed August 2, 2024 Exhibit 99.1 Reconciliation of Contribution Margin Per Patron 1. We read your response to prior comment 2. Please respond to address the following: Please disclose in greater detail the reasons why you believe the presentation of contribution margin and contribution margin per patron provides useful information to investors and additional purposes for which management uses these non-GAAP measures. Refer to Items 10(e)(1)(i)(C) and (D) of Regulation S-K. The Company acknowledges the Staff’s comment and advises the Staff that it believes that non-GAAP contribution margin and contribution margin per patron are useful and very important performance measures for our investors, as these measures provide investors with a view of how much profit is generated by our movie-goer patrons before the inclusion of fixed costs. The revenues generated by our theatres are essentially variable and depend in large part on attendance levels by our customers at our theatres. At the same time, a significant portion of our operating costs and expenses are fixed, including, for example, payroll and theatre rent. Contribution margin is a key performance measure used to measure the impact on our profitability of differing attendance levels, after deducting the direct variable costs associated with those attendance levels, but before recognizing the impact of fixed operating costs and |
|
2 expenses that do not vary directly with attendance. Contribution margin per patron is the total contribution dollars divided by number of customers served. Thus, contribution margin per patron provides a measure of the incremental profitability generated by a patron, by providing the incremental dollars earned or (lost) per customer gained or (lost). These metrics are key performance measures that we use internally, as they allow us to measure the incremental impact on profitability of changes in our attendance levels. For the same reason, we believe these measures are valuable metrics for investors, particularly given the varying levels of attendance in our industry. These measures allow us and our investors to evaluate the impact on profitability of important business decisions we make, such as product pricing and food and beverage offerings and initiatives. Thus, we believe that presenting these performance measures provides greater transparency to our investors on how we operate our business and how our business is performing including how efficiently the Company is managing its variable costs relative to its revenue. We believe this transparency is particularly important to our investors, given the recent challenges experienced by our industry, which has had a significant impact on attendance levels. Our attendance levels have varied significantly since the COVID-19 shutdowns in 2020 and subsequent movie industry labor stoppages and are expected to continue to vary as the extended industry recovery proceeds. Current attendance levels are approximately 25% below pre-COVID-19 levels. Providing investors with the contribution margin metric increases the utility of the aggregate financial information available as it allows investors to understand and model the variable impact of past, present, and projected future attendance levels. Contribution margin supplements our other non-GAAP profitability measure, Adjusted EBITDA, which does include all rent and operating costs, by providing our investors with additional information to evaluate changes in GAAP profit measures as attendance varies, and we believe that quantifying the financial impact of attendance level changes with the contribution per patron metric will continue to be important to our investors. As evidence of the usefulness of these measures, we note that it is our experience that multiple equity research analysts utilize contribution margin in their coverage of our industry and business. In that regard, we also note that our measure of contribution margin is similar to how certain retailers may measure GAAP gross profit. Contribution margin, like GAAP gross profit, represents the dollar contribution from transactions with customers excluding fixed operating costs and expenses that are not impacted by changing attendance levels. Similar to GAAP gross profit used by certain others, contribution margin is equal to GAAP revenue less GAAP costs directly associated with revenue. Film exhibition costs that we pay film studios and food and beverage costs are our direct variable expenses associated with our revenues. So, for the same reasons that certain others might report GAAP gross profit, we believe it is useful to provide our measure of contribution margin. In light of the Staff’s comments, we will add the following additional disclosure to future filings: We present “contribution margin” and “contribution margin per patron” as supplemental measures of our performance. We define “contribution margin” as Revenue less both Film Exhibition Costs and Food and Beverage Costs. These costs are directly variable with attendance. Contribution margin per patron is the total contribution margin divided by number of customers served. The “contribution margin per patron” thus represents the incremental dollars earned or (lost) per customer gained or (lost). We believe contribution margin and contribution margin per patron are key performance measures that provide investors with supplemental information regarding (i) the impact to our profitability of differing attendance levels, after deducting the direct variable costs associated with those attendance levels, but before recognizing the impact of fixed operating costs and expenses that do not vary directly with attendance and (ii) our ability to cover fixed costs that do not vary directly with attendance. We believe this is particularly important information given the significant variability in attendance levels in our business and our industry. |
|
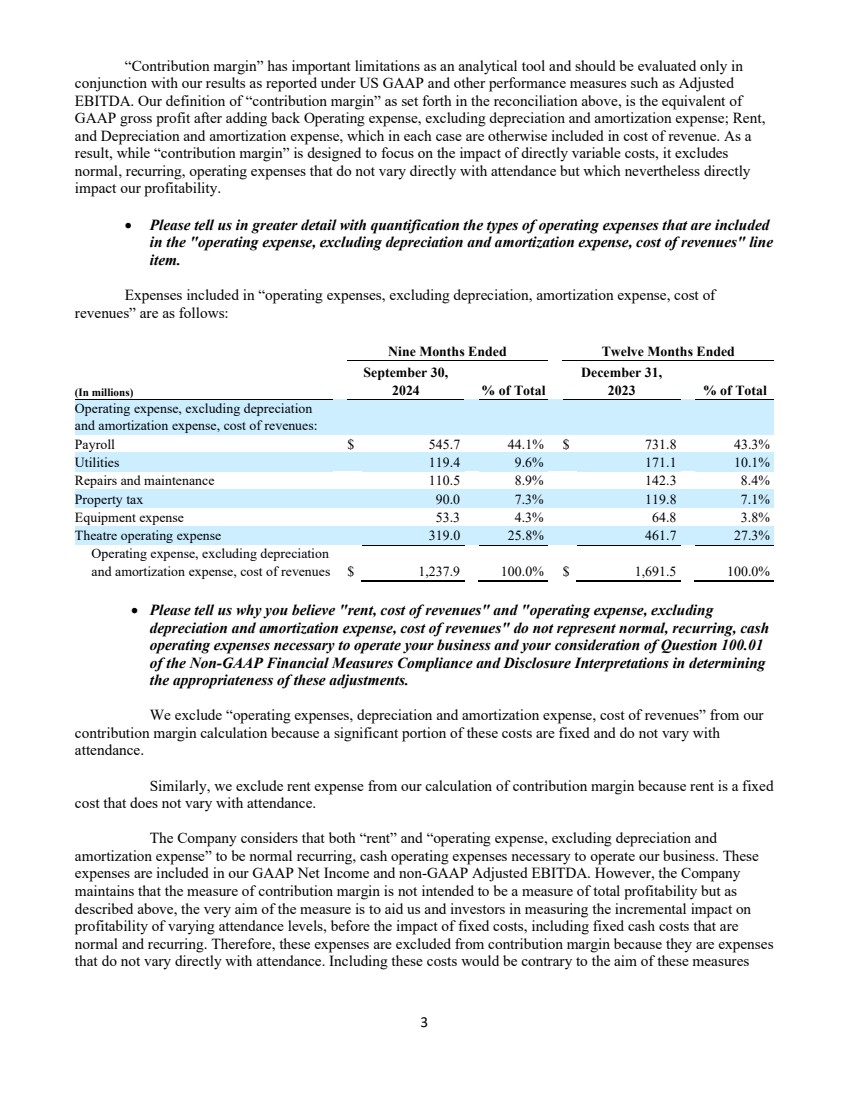
3 “Contribution margin” has important limitations as an analytical tool and should be evaluated only in conjunction with our results as reported under US GAAP and other performance measures such as Adjusted EBITDA. Our definition of “contribution margin” as set forth in the reconciliation above, is the equivalent of GAAP gross profit after adding back Operating expense, excluding depreciation and amortization expense; Rent, and Depreciation and amortization expense, which in each case are otherwise included in cost of revenue. As a result, while “contribution margin” is designed to focus on the impact of directly variable costs, it excludes normal, recurring, operating expenses that do not vary directly with attendance but which nevertheless directly impact our profitability. Please tell us in greater detail with quantification the types of operating expenses that are included in the "operating expense, excluding depreciation and amortization expense, cost of revenues" line item. Expenses included in “operating expenses, excluding depreciation, amortization expense, cost of revenues” are as follows: Nine Months Ended Twelve Months Ended September 30, December 31, (In millions) 2024 % of Total 2023 % of Total Operating expense, excluding depreciation and amortization expense, cost of revenues: Payroll $ 545.7 44.1% $ 731.8 43.3% Utilities 119.4 9.6% 171.1 10.1% Repairs and maintenance 110.5 8.9% 142.3 8.4% Property tax 90.0 7.3% 119.8 7.1% Equipment expense 53.3 4.3% 64.8 3.8% Theatre operating expense 319.0 25.8% 461.7 27.3% Operating expense, excluding depreciation and amortization expense, cost of revenues $ 1,237.9 100.0% $ 1,691.5 100.0% Please tell us why you believe "rent, cost of revenues" and "operating expense, excluding depreciation and amortization expense, cost of revenues" do not represent normal, recurring, cash operating expenses necessary to operate your business and your consideration of Question 100.01 of the Non-GAAP Financial Measures Compliance and Disclosure Interpretations in determining the appropriateness of these adjustments. We exclude “operating expenses, depreciation and amortization expense, cost of revenues” from our contribution margin calculation because a significant portion of these costs are fixed and do not vary with attendance. Similarly, we exclude rent expense from our calculation of contribution margin because rent is a fixed cost that does not vary with attendance. The Company considers that both “rent” and “operating expense, excluding depreciation and amortization expense” to be normal recurring, cash operating expenses necessary to operate our business. These expenses are included in our GAAP Net Income and non-GAAP Adjusted EBITDA. However, the Company maintains that the measure of contribution margin is not intended to be a measure of total profitability but as described above, the very aim of the measure is to aid us and investors in measuring the incremental impact on profitability of varying attendance levels, before the impact of fixed costs, including fixed cash costs that are normal and recurring. Therefore, these expenses are excluded from contribution margin because they are expenses that do not vary directly with attendance. Including these costs would be contrary to the aim of these measures |
|
4 and defeat their usefulness to us and to investors to provide additional information about our operating performance. Additionally, the Company has reviewed the requirements of Rule 100(b) of Regulation G and the guidance in the Compliance and Disclosure Interpretations, including Question 100.01, and based upon such review, does not believe that the adjustments for rent and other operating expenses violate Rule 100(b) of Regulation G as the Company does not believe the exclusion of these expenses could cause the measure of contribution margin to be misleading to an investor. We do not believe our current presentation of contribution margin would mislead an investor given its context as an additional measure of profitability that supplements our existing presentation of Adjusted EBITDA, which does include these normal, recurring, cash operating expenses. We also believe our disclosures (including our enhanced disclosures described above), together with the more prominent GAAP information we provide, our supplementary non-GAAP measures, and the full GAAP reconciliations presented, provide investors with the information and ability to make their own judgments regarding the usefulness of the information and preclude the disclosures from being misleading. To the contrary, we believe the presentation of contribution margin increases the decision-usefulness of the aggregate information provided to our investors as it identifies costs by nature – fixed vs. variable – in order for an investor to better evaluate profitability of our business over time and at different attendance levels. Further, the amounts used to arrive at these non-GAAP measures all appear on the face of the Company’s consolidated statement of operations or in the notes to the financial statements and do not otherwise eliminate or accelerate any amounts in contravention of GAAP. The Company further respectfully advises the Staff that its treatment of rent and other operating expenses in its presentation of contribution margin is reflective of how management views and operates the Company’s business. The Company’s management focuses on how fixed expenses and revenue vary from period to period, and the relationship between its fixed expenses and revenue, and contribution margin and contribution margin per patron provide a comparable metric that facilitates management’s ability to identify operational trends, make decisions regarding future spending, resource allocation, and other operational decisions. The Company has presented these metrics to provide investors with the same degree of visibility into the profitability of the business as management. In summary, the Company respectfully advises the Staff that it believes the adjustments for rent and operating expense, excluding depreciation, is in compliance with non-GAAP rules and we will provide additional clarification in future filings to ensure it aligns with the guidance in Question 100.01 of the Non-GAAP Financial Measures Compliance and Disclosure Interpretations. We believe this measure is important to investors in the same way it is important to us. Finally, as noted above, this measure is also extensively used by equity research analysts who cover our industry to better understand our operating economics, and we have provided some examples of the analyst reports in our response, as supplemental information for the Staff. *** We further acknowledge that we are responsible for the adequacy and accuracy of the disclosures in our filings, not notwithstanding any review, comments, action or absence of action by the Staff. Should any questions arise in connection with the filing or this response letter, please contact the undersigned at (913) 213-2191. Sincerely yours, /s/ Chris A. Cox Chris A. Cox Senior Vice President and Chief Accounting Officer |
|
5 Attachments Wold, E., May 9, 2024, Upside 1Q24 Results—Remain Positive on Opportunity for Box Office Share Gains and Reduced Debt Overhang to Boost the Valuation Wold, E., July 7, 2024, Exhibition Industry 2Q24 Previews—Don't Let the Box Office Make You “Furiosa;” Goss, James, C., Sholl, P. W., November 9, 2023, Q3/23 Initial: Record Performance Supported by PLF Base Goss, James, C., Sholl, P. W., November 16, 2023, Operating Results Rebounding Nicely, but Financial Challenges Remain |
|
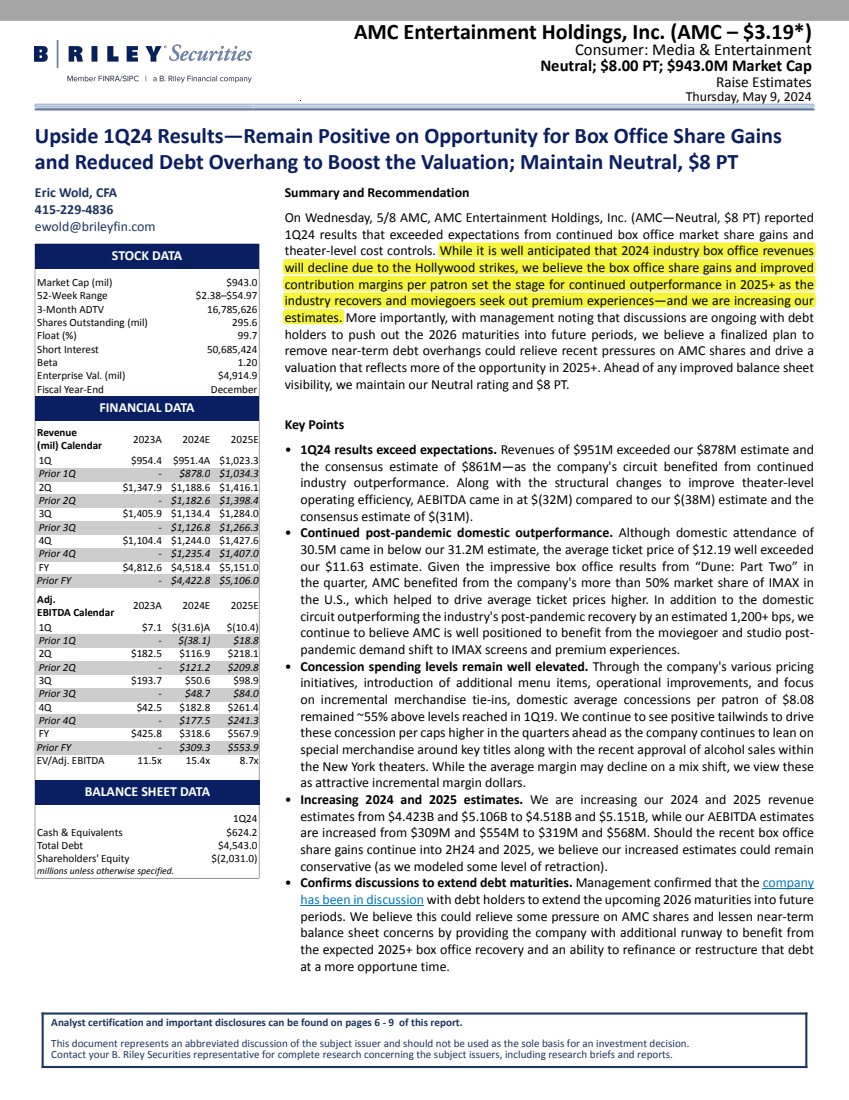
AMC Entertainment Holdings, Inc. (AMC – $3.19*) Consumer: Media & Entertainment Neutral; $8.00 PT; $943.0M Market Cap Raise Estimates Thursday, May 9, 2024 Upside 1Q24 Results—Remain Positive on Opportunity for Box Office Share Gains and Reduced Debt Overhang to Boost the Valuation; Maintain Neutral, $8 PT Eric Wold, CFA 415-229-4836 ewold@brileyfin.com STOCK DATA Market Cap (mil) $943.0 52-Week Range $2.38–$54.97 3-Month ADTV 16,785,626 Shares Outstanding (mil) 295.6 Float (%) 99.7 Short Interest 50,685,424 Beta 1.20 Enterprise Val. (mil) $4,914.9 Fiscal Year-End December FINANCIAL DATA Revenue (mil) Calendar 2023A 2024E 2025E 1Q $954.4 $951.4A $1,023.3 Prior 1Q - $878.0 $1,034.3 2Q $1,347.9 $1,188.6 $1,416.1 Prior 2Q - $1,182.6 $1,398.4 3Q $1,405.9 $1,134.4 $1,284.0 Prior 3Q - $1,126.8 $1,266.3 4Q $1,104.4 $1,244.0 $1,427.6 Prior 4Q - $1,235.4 $1,407.0 FY $4,812.6 $4,518.4 $5,151.0 Prior FY - $4,422.8 $5,106.0 Adj. EBITDA Calendar 2023A 2024E 2025E 1Q $7.1 $(31.6)A $(10.4) Prior 1Q - $(38.1) $18.8 2Q $182.5 $116.9 $218.1 Prior 2Q - $121.2 $209.8 3Q $193.7 $50.6 $98.9 Prior 3Q - $48.7 $84.0 4Q $42.5 $182.8 $261.4 Prior 4Q - $177.5 $241.3 FY $425.8 $318.6 $567.9 Prior FY - $309.3 $553.9 EV/Adj. EBITDA 11.5x 15.4x 8.7x BALANCE SHEET DATA 1Q24 Cash & Equivalents $624.2 Total Debt $4,543.0 Shareholders' Equity $(2,031.0) millions unless otherwise specified. Summary and Recommendation On Wednesday, 5/8 AMC, AMC Entertainment Holdings, Inc. (AMC—Neutral, $8 PT) reported 1Q24 results that exceeded expectations from continued box office market share gains and theater-level cost controls. While it is well anticipated that 2024 industry box office revenues will decline due to the Hollywood strikes, we believe the box office share gains and improved contribution margins per patron set the stage for continued outperformance in 2025+ as the industry recovers and moviegoers seek out premium experiences—and we are increasing our estimates. More importantly, with management noting that discussions are ongoing with debt holders to push out the 2026 maturities into future periods, we believe a finalized plan to remove near-term debt overhangs could relieve recent pressures on AMC shares and drive a valuation that reflects more of the opportunity in 2025+. Ahead of any improved balance sheet visibility, we maintain our Neutral rating and $8 PT. Key Points • 1Q24 results exceed expectations. Revenues of $951M exceeded our $878M estimate and the consensus estimate of $861M—as the company's circuit benefited from continued industry outperformance. Along with the structural changes to improve theater-level operating efficiency, AEBITDA came in at $(32M) compared to our $(38M) estimate and the consensus estimate of $(31M). • Continued post-pandemic domestic outperformance. Although domestic attendance of 30.5M came in below our 31.2M estimate, the average ticket price of $12.19 well exceeded our $11.63 estimate. Given the impressive box office results from “Dune: Part Two” in the quarter, AMC benefited from the company's more than 50% market share of IMAX in the U.S., which helped to drive average ticket prices higher. In addition to the domestic circuit outperforming the industry's post-pandemic recovery by an estimated 1,200+ bps, we continue to believe AMC is well positioned to benefit from the moviegoer and studio post-pandemic demand shift to IMAX screens and premium experiences. • Concession spending levels remain well elevated. Through the company's various pricing initiatives, introduction of additional menu items, operational improvements, and focus on incremental merchandise tie-ins, domestic average concessions per patron of $8.08 remained ~55% above levels reached in 1Q19. We continue to see positive tailwinds to drive these concession per caps higher in the quarters ahead as the company continues to lean on special merchandise around key titles along with the recent approval of alcohol sales within the New York theaters. While the average margin may decline on a mix shift, we view these as attractive incremental margin dollars. • Increasing 2024 and 2025 estimates. We are increasing our 2024 and 2025 revenue estimates from $4.423B and $5.106B to $4.518B and $5.151B, while our AEBITDA estimates are increased from $309M and $554M to $319M and $568M. Should the recent box office share gains continue into 2H24 and 2025, we believe our increased estimates could remain conservative (as we modeled some level of retraction). • Confirms discussions to extend debt maturities. Management confirmed that the company has been in discussion with debt holders to extend the upcoming 2026 maturities into future periods. We believe this could relieve some pressure on AMC shares and lessen near-term balance sheet concerns by providing the company with additional runway to benefit from the expected 2025+ box office recovery and an ability to refinance or restructure that debt at a more opportune time. Analyst certification and important disclosures can be found on pages 6 - 9 of this report. This document represents an abbreviated discussion of the subject issuer and should not be used as the sole basis for an investment decision. Contact your B. Riley Securities representative for complete research concerning the subject issuers, including research briefs and reports. |
|
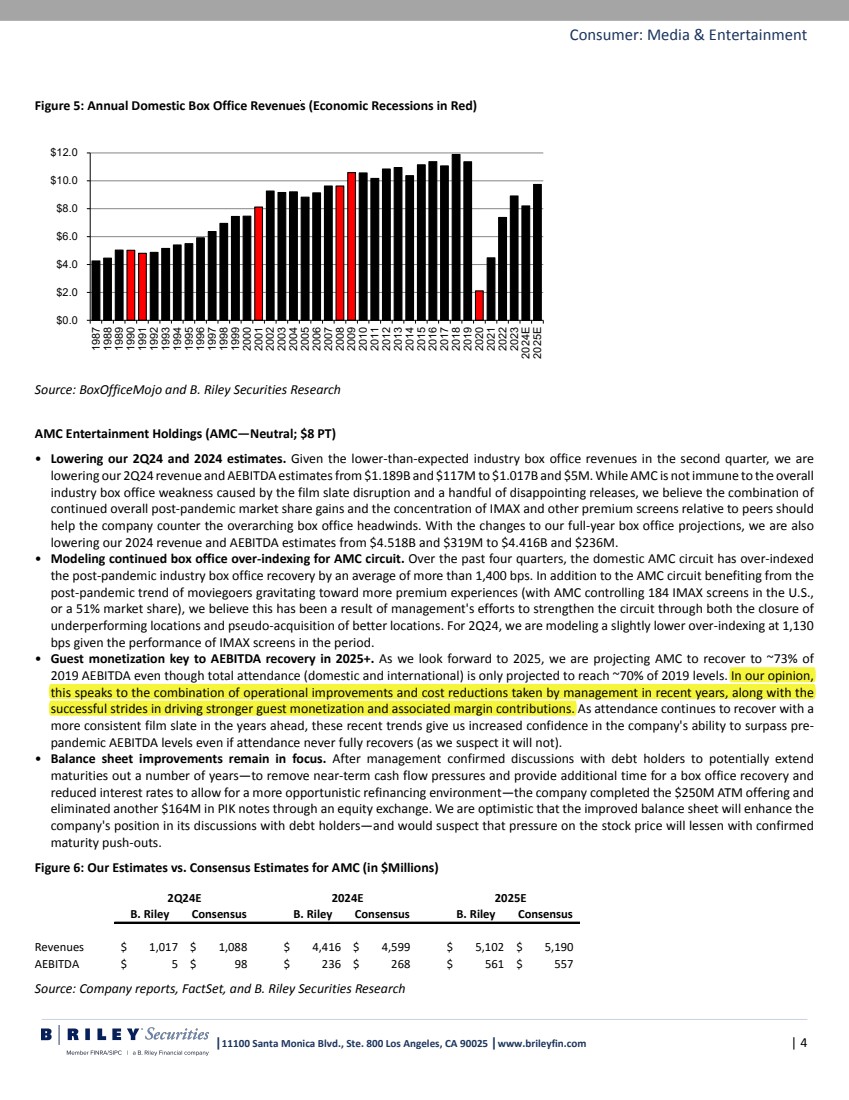
Figure 5: Annual Domestic Box Office Revenues (Economic Recessions in Red) $0.0 $2.0 $4.0 $6.0 $8.0 $10.0 $12.0 1987 1988 1989 1990 1991 1992 1993 1994 1995 1996 1997 1998 1999 2000 2001 2002 2003 2004 2005 2006 2007 2008 2009 2010 2011 2012 2013 2014 2015 2016 2017 2018 2019 2020 2021 2022 2023 2024E 2025E Source: BoxOfficeMojo and B. Riley Securities Research AMC Entertainment Holdings (AMC—Neutral; $8 PT) • Lowering our 2Q24 and 2024 estimates. Given the lower-than-expected industry box office revenues in the second quarter, we are lowering our 2Q24 revenue and AEBITDA estimates from $1.189B and $117M to $1.017B and $5M. While AMC is not immune to the overall industry box office weakness caused by the film slate disruption and a handful of disappointing releases, we believe the combination of continued overall post-pandemic market share gains and the concentration of IMAX and other premium screens relative to peers should help the company counter the overarching box office headwinds. With the changes to our full-year box office projections, we are also lowering our 2024 revenue and AEBITDA estimates from $4.518B and $319M to $4.416B and $236M. • Modeling continued box office over-indexing for AMC circuit. Over the past four quarters, the domestic AMC circuit has over-indexed the post-pandemic industry box office recovery by an average of more than 1,400 bps. In addition to the AMC circuit benefiting from the post-pandemic trend of moviegoers gravitating toward more premium experiences (with AMC controlling 184 IMAX screens in the U.S., or a 51% market share), we believe this has been a result of management's efforts to strengthen the circuit through both the closure of underperforming locations and pseudo-acquisition of better locations. For 2Q24, we are modeling a slightly lower over-indexing at 1,130 bps given the performance of IMAX screens in the period. • Guest monetization key to AEBITDA recovery in 2025+. As we look forward to 2025, we are projecting AMC to recover to ~73% of 2019 AEBITDA even though total attendance (domestic and international) is only projected to reach ~70% of 2019 levels. In our opinion, this speaks to the combination of operational improvements and cost reductions taken by management in recent years, along with the successful strides in driving stronger guest monetization and associated margin contributions. As attendance continues to recover with a more consistent film slate in the years ahead, these recent trends give us increased confidence in the company's ability to surpass pre-pandemic AEBITDA levels even if attendance never fully recovers (as we suspect it will not). • Balance sheet improvements remain in focus. After management confirmed discussions with debt holders to potentially extend maturities out a number of years—to remove near-term cash flow pressures and provide additional time for a box office recovery and reduced interest rates to allow for a more opportunistic refinancing environment—the company completed the $250M ATM offering and eliminated another $164M in PIK notes through an equity exchange. We are optimistic that the improved balance sheet will enhance the company's position in its discussions with debt holders—and would suspect that pressure on the stock price will lessen with confirmed maturity push-outs. Figure 6: Our Estimates vs. Consensus Estimates for AMC (in $Millions) B. Riley Consensus B. Riley Consensus B. Riley Consensus Revenues $ 1,017 $ 1,088 $ 4,416 $ 4,599 $ 5,102 $ 5,190 AEBITDA $ $ 9 8 $ 236 $ 268 $ 561 $ 557 2Q24E 2024E 2025E Source: Company reports, FactSet, and B. Riley Securities Research Consumer: Media & Entertainment |11100 Santa Monica Blvd., Ste. 800 Los Angeles, CA 90025 |www.brileyfin.com | 4 |
|
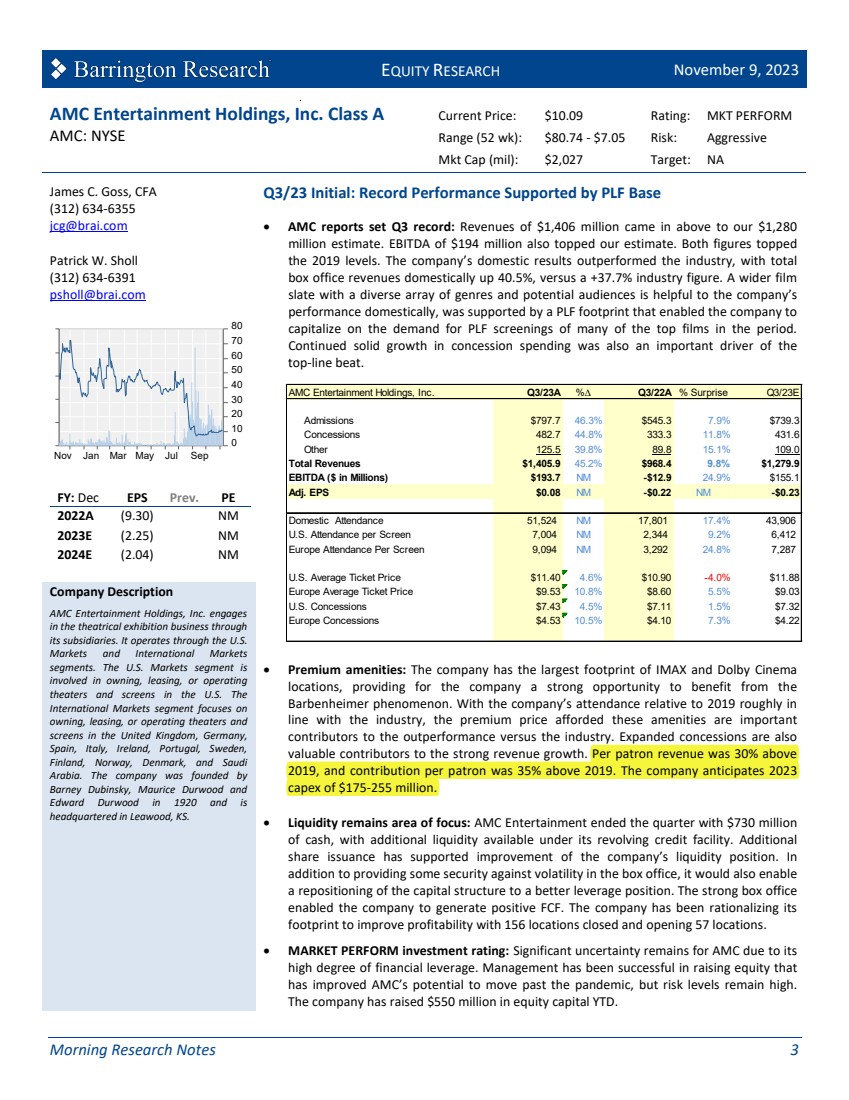
EQUITY RESEARCH November 9, 2023 Morning Research Notes 3 AMC Entertainment Holdings, Inc. Class A Current Price: $10.09 Rating: MKT PERFORM AMC: NYSE Range (52 wk): $80.74 - $7.05 Risk: Aggressive Mkt Cap (mil): $2,027 Target: NA James C. Goss, CFA (312) 634-6355 jcg@brai.com Patrick W. Sholl (312) 634-6391 psholl@brai.com Nov Jan Mar May Jul Sep 0 10 20 30 40 50 60 70 80 FY: Dec EPS Prev. PE 2022A (9.30) NM 2023E (2.25) NM 2024E (2.04) NM Q3/23 Initial: Record Performance Supported by PLF Base • AMC reports set Q3 record: Revenues of $1,406 million came in above to our $1,280 million estimate. EBITDA of $194 million also topped our estimate. Both figures topped the 2019 levels. The company’s domestic results outperformed the industry, with total box office revenues domestically up 40.5%, versus a +37.7% industry figure. A wider film slate with a diverse array of genres and potential audiences is helpful to the company’s performance domestically, was supported by a PLF footprint that enabled the company to capitalize on the demand for PLF screenings of many of the top films in the period. Continued solid growth in concession spending was also an important driver of the top-line beat. • Premium amenities: The company has the largest footprint of IMAX and Dolby Cinema locations, providing for the company a strong opportunity to benefit from the Barbenheimer phenomenon. With the company’s attendance relative to 2019 roughly in line with the industry, the premium price afforded these amenities are important contributors to the outperformance versus the industry. Expanded concessions are also valuable contributors to the strong revenue growth. Per patron revenue was 30% above 2019, and contribution per patron was 35% above 2019. The company anticipates 2023 capex of $175-255 million. • Liquidity remains area of focus: AMC Entertainment ended the quarter with $730 million of cash, with additional liquidity available under its revolving credit facility. Additional share issuance has supported improvement of the company’s liquidity position. In addition to providing some security against volatility in the box office, it would also enable a repositioning of the capital structure to a better leverage position. The strong box office enabled the company to generate positive FCF. The company has been rationalizing its footprint to improve profitability with 156 locations closed and opening 57 locations. • MARKET PERFORM investment rating: Significant uncertainty remains for AMC due to its high degree of financial leverage. Management has been successful in raising equity that has improved AMC’s potential to move past the pandemic, but risk levels remain high. The company has raised $550 million in equity capital YTD. Company Description AMC Entertainment Holdings, Inc. engages in the theatrical exhibition business through its subsidiaries. It operates through the U.S. Markets and International Markets segments. The U.S. Markets segment is involved in owning, leasing, or operating theaters and screens in the U.S. The International Markets segment focuses on owning, leasing, or operating theaters and screens in the United Kingdom, Germany, Spain, Italy, Ireland, Portugal, Sweden, Finland, Norway, Denmark, and Saudi Arabia. The company was founded by Barney Dubinsky, Maurice Durwood and Edward Durwood in 1920 and is headquartered in Leawood, KS. AMC Entertainment Holdings, Inc. Q3/23A %∆ Q3/22A % Surprise Q3/23E Admissions $797.7 46.3% $545.3 7.9% $739.3 Concessions 482.7 44.8% 333.3 11.8% 431.6 Other 125.5 39.8% 89.8 15.1% 109.0 Total Revenues $1,405.9 45.2% $968.4 9.8% $1,279.9 EBITDA ($ in Millions) $193.7 NM -$12.9 24.9% $155.1 Adj. EPS $0.08 NM -$0.22 NM -$0.23 Domestic Attendance 51,524 NM 17,801 17.4% 43,906 U.S. Attendance per Screen 7,004 NM 2,344 9.2% 6,412 Europe Attendance Per Screen 9,094 NM 3,292 24.8% 7,287 U.S. Average Ticket Price $11.40 4.6% $10.90 -4.0% $11.88 Europe Average Ticket Price $9.53 10.8% $8.60 5.5% $9.03 U.S. Concessions $7.43 4.5% $7.11 1.5% $7.32 Europe Concessions $4.53 10.5% $4.10 7.3% $4.22 |
|
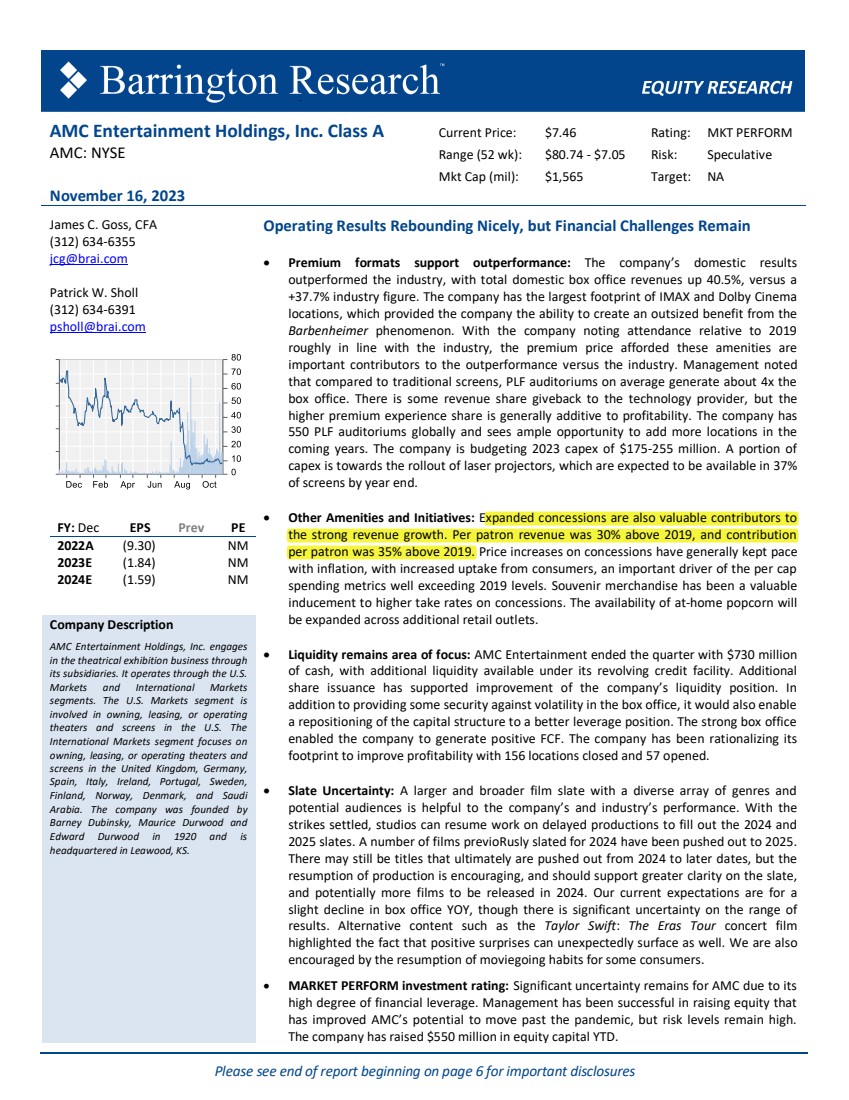
Please see end of report beginning on page 6 for important disclosures AMC Entertainment Holdings, Inc. Class A Current Price: $7.46 Rating: MKT PERFORM AMC: NYSE Range (52 wk): $80.74 - $7.05 Risk: Speculative Mkt Cap (mil): $1,565 Target: NA November 16, 2023 James C. Goss, CFA (312) 634-6355 jcg@brai.com Patrick W. Sholl (312) 634-6391 psholl@brai.com FY: Dec EPS Prev PE 2022A (9.30) NM 2023E (1.84) NM 2024E (1.59) NM Operating Results Rebounding Nicely, but Financial Challenges Remain • Premium formats support outperformance: The company’s domestic results outperformed the industry, with total domestic box office revenues up 40.5%, versus a +37.7% industry figure. The company has the largest footprint of IMAX and Dolby Cinema locations, which provided the company the ability to create an outsized benefit from the Barbenheimer phenomenon. With the company noting attendance relative to 2019 roughly in line with the industry, the premium price afforded these amenities are important contributors to the outperformance versus the industry. Management noted that compared to traditional screens, PLF auditoriums on average generate about 4x the box office. There is some revenue share giveback to the technology provider, but the higher premium experience share is generally additive to profitability. The company has 550 PLF auditoriums globally and sees ample opportunity to add more locations in the coming years. The company is budgeting 2023 capex of $175-255 million. A portion of capex is towards the rollout of laser projectors, which are expected to be available in 37% of screens by year end. • Other Amenities and Initiatives: Expanded concessions are also valuable contributors to the strong revenue growth. Per patron revenue was 30% above 2019, and contribution per patron was 35% above 2019. Price increases on concessions have generally kept pace with inflation, with increased uptake from consumers, an important driver of the per cap spending metrics well exceeding 2019 levels. Souvenir merchandise has been a valuable inducement to higher take rates on concessions. The availability of at-home popcorn will be expanded across additional retail outlets. • Liquidity remains area of focus: AMC Entertainment ended the quarter with $730 million of cash, with additional liquidity available under its revolving credit facility. Additional share issuance has supported improvement of the company’s liquidity position. In addition to providing some security against volatility in the box office, it would also enable a repositioning of the capital structure to a better leverage position. The strong box office enabled the company to generate positive FCF. The company has been rationalizing its footprint to improve profitability with 156 locations closed and 57 opened. • Slate Uncertainty: A larger and broader film slate with a diverse array of genres and potential audiences is helpful to the company’s and industry’s performance. With the strikes settled, studios can resume work on delayed productions to fill out the 2024 and 2025 slates. A number of films previoRusly slated for 2024 have been pushed out to 2025. There may still be titles that ultimately are pushed out from 2024 to later dates, but the resumption of production is encouraging, and should support greater clarity on the slate, and potentially more films to be released in 2024. Our current expectations are for a slight decline in box office YOY, though there is significant uncertainty on the range of results. Alternative content such as the Taylor Swift: The Eras Tour concert film highlighted the fact that positive surprises can unexpectedly surface as well. We are also encouraged by the resumption of moviegoing habits for some consumers. • MARKET PERFORM investment rating: Significant uncertainty remains for AMC due to its high degree of financial leverage. Management has been successful in raising equity that has improved AMC’s potential to move past the pandemic, but risk levels remain high. The company has raised $550 million in equity capital YTD. Company Description AMC Entertainment Holdings, Inc. engages in the theatrical exhibition business through its subsidiaries. It operates through the U.S. Markets and International Markets segments. The U.S. Markets segment is involved in owning, leasing, or operating theaters and screens in the U.S. The International Markets segment focuses on owning, leasing, or operating theaters and screens in the United Kingdom, Germany, Spain, Italy, Ireland, Portugal, Sweden, Finland, Norway, Denmark, and Saudi Arabia. The company was founded by Barney Dubinsky, Maurice Durwood and Edward Durwood in 1920 and is headquartered in Leawood, KS. |
